
Ethereum (ETH/USD) is forming a bullish pattern that could push its market bids towards $1,900.
Key Ethereum Takeaways
- Ethereum crashed by approximately 36 percent after setting up its record high at $2,041 on February 19.
- Despite significant losses, ETH/USD seems to be developing a reversal pattern that could improve its short-term bullish bias.
- The upside outlook appears in line with the rest of the cryptocurrency market, tailing Bitcoin’s gains.
Ethereum faced heavy criticism after its transaction, and gas fees increased massively. In some instances, users were forced to pay a $50 fee for transacting as little as $5.
As usual, its top rival projects benefited by presenting themselves as better alternatives. Binance Smart Chain, for instance, attracted record volumes in February, while its native token BNB surged by more than 365 percent in the same month alone.
However, speculative investments pushed Ethereum prices higher as the token continued to garner interest from mainstream institutions. New York-based Grayscale Investments purchased 3,347 Ethereum worth approximately $5.2 million earlier this week. The firm has bought 243,519 ETH worth more than $380 million in the last 30 days after reopening its Ethereum Trust in 2021.
It indicated that Grayscale sees a potential demand for Ethereum-based shares among institutional investors. Meanwhile, many still anticipate that the blockchain project would beat its rivals after switching its protocol full from proof-of-work to proof-of-stake by this year’s end.
As of Wednesday, ETH/USD was up 28.25 percent from its recent bottom near $1,292. The pair reached an intraday high of $1,657 before correcting lower due to modest selling pressure near the local tops.
Inverse Head & Shoulder
It is worth noting that Ethereum’s recent run-up confirmed resistance at an upward sloping trendline. So it appears, the price ceiling serves as a neckline to an inverse head and shoulder pattern, further confirmed by three consecutive trough formations, with the middle one higher than the other two.
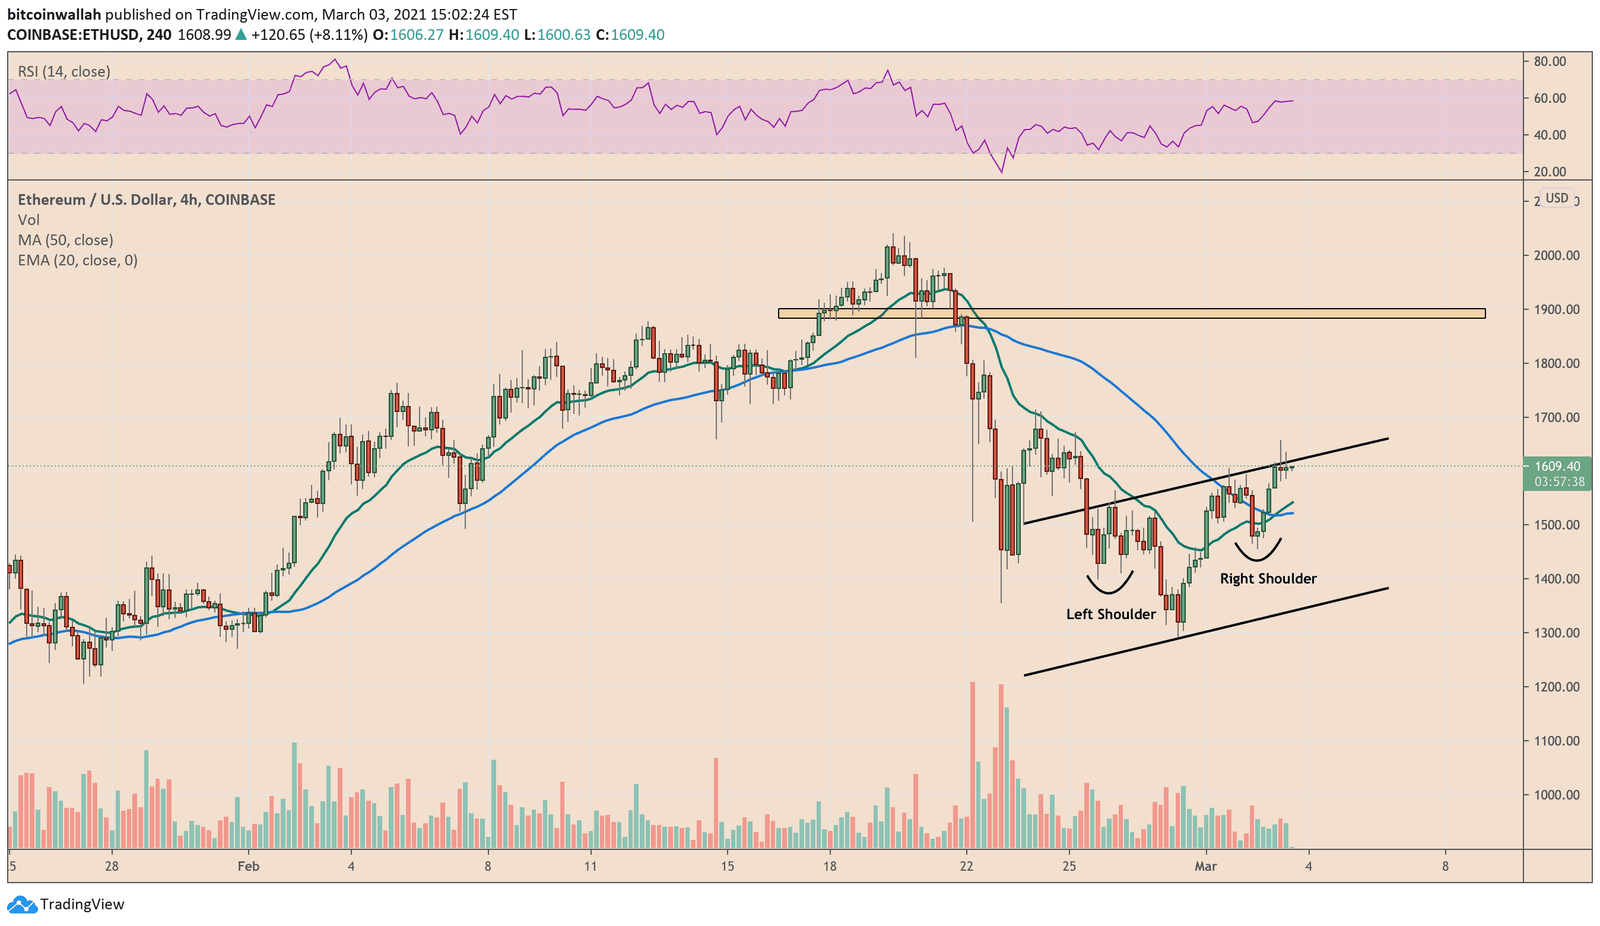
Typically, the ETH/USD exchange rate should break bullish above the neckline resistance to target levels that are above by as much as the pattern’s maximum height. That means the total gap between the neckline and the middle trough’s bottom.
The reading comes at $278. That roughly puts Ethereum’s IH&S upside target near $1,900.
Conversely, a failure to break above the neckline resistance risks invalidating the bullish inverse pattern. Traders should watch out for next supports near ETH/USD’s 20-period and 50-period moving averages.
