

NOIDA (CoinChapter.com) — Expedia Group (NASDAQ: EXPE) share prices might fall victim to the company’s upcoming earnings report despite traders being bullish on the share’s price prospects.
Expedia is due to release its Q4 2023 earnings report on Feb. 8, with the consensus mark for earnings standing at $1.67 per share, suggesting growth of 32.5% YoY. Moreover, the market consensus predicts gross bookings to go up by 6.6% year over year.
Furthermore, robust core technology, AI, machine learning, service, and payment strategies could help improve the firm’s performance in Q4 2023.
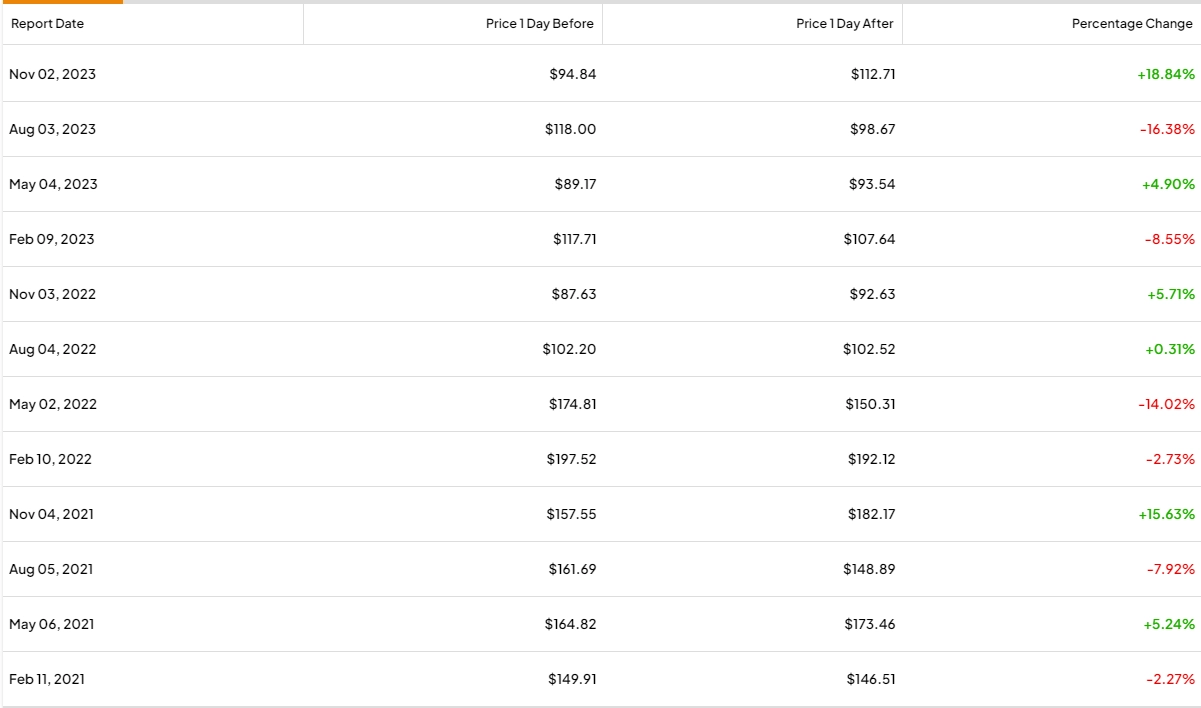
However, since 2021, the EXPE price the day after the quarterly earnings report release has dipped 50% of the time. A bearish response has followed nearly every positive response to a quarterly earnings report over the past three years, per Tipranks data.
The historical pattern suggests that the EXPE price will likely suffer corrections following the release of the earnings report. Furthermore, the firm’s stocks have been on a bull run since Nov. 2023, which could result in bears booking profits following a positive earnings report.
Traders remain unsure of entering the market despite being bullish on EXPE’s price action. A trader with the X username ‘Nebraskangooner‘ told his nearly 333,200 followers that EXPE would likely chart a new ATH soon. However, “[Expedia’s Q4] earnings this week make it risky to enter.”
Could do a small position on my HODL portfolio if anything but earnings are just too much of a coinflip for me.
Nebraskangooner wrote in a post.EXPE Forms Bullish Pattern Ahead Of Expedia Q4 Earnings Report Release
As market participants await the Expedia earnings report, EXPE price moves inside a bullish technical pattern called the ‘Bull Flag.’
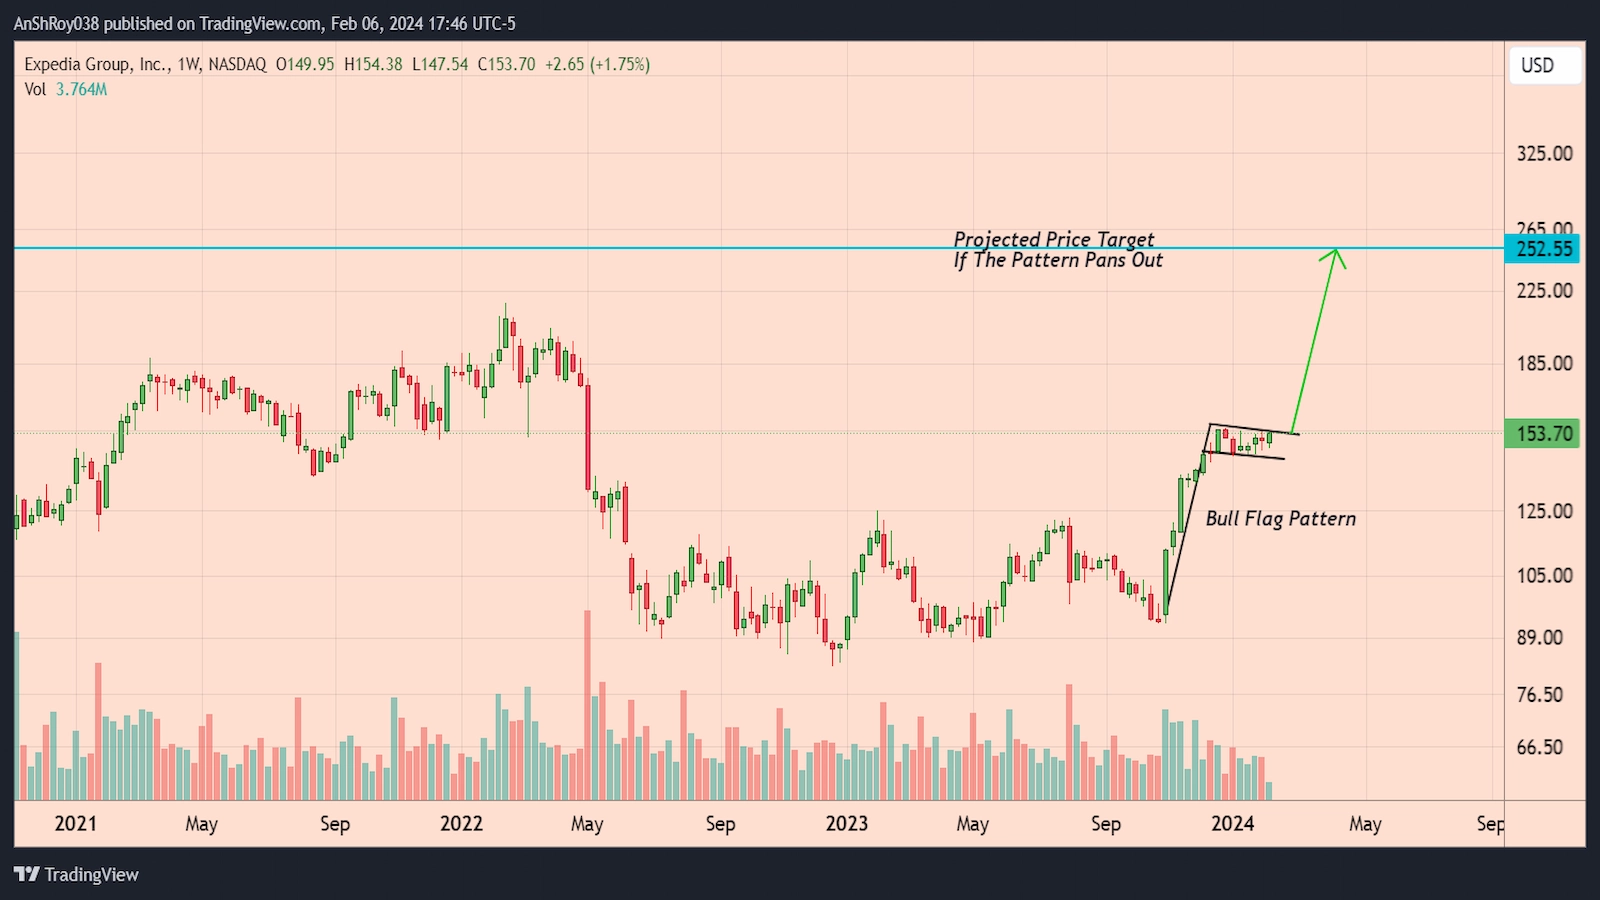
Bull flags consist of a flag pole, resulting from a near-vertical rise in the crypto token’s prices. Assets in a strong uptrend often form the pattern.
A period of consolidation succeeding the steep uptrend forms the flag of the pattern. Despite the strong vertical rally, the asset price does not drop as bulls maintain the buying pressure. As a result, the breakout from the flag pattern often results in a powerful uptrend.
The pattern is completed when the price breaks out of the flag area, continuing the previous upward trend. Traders calculate the price target of the breakout by adding the length of the flag pole to the breakout price level.
Per the rules of technical analysis, EXPE price might rally over 64% to reach the theoretical price target near $255.5 if Expedia shares confirm the pattern.
EXPE Price In Holding Pattern
In the runup to Expedia’s Q4 earnings report, the firm’s shares have remained in a holding pattern, swinging between $145 and $155.
EXPE price has had a mostly positive February so far, with the share’s price reclaiming the 20-day EMA (red wave) support near $149 after EXPE price spiked 2.5% to reach a daily high near $154.4 on Feb. 6.
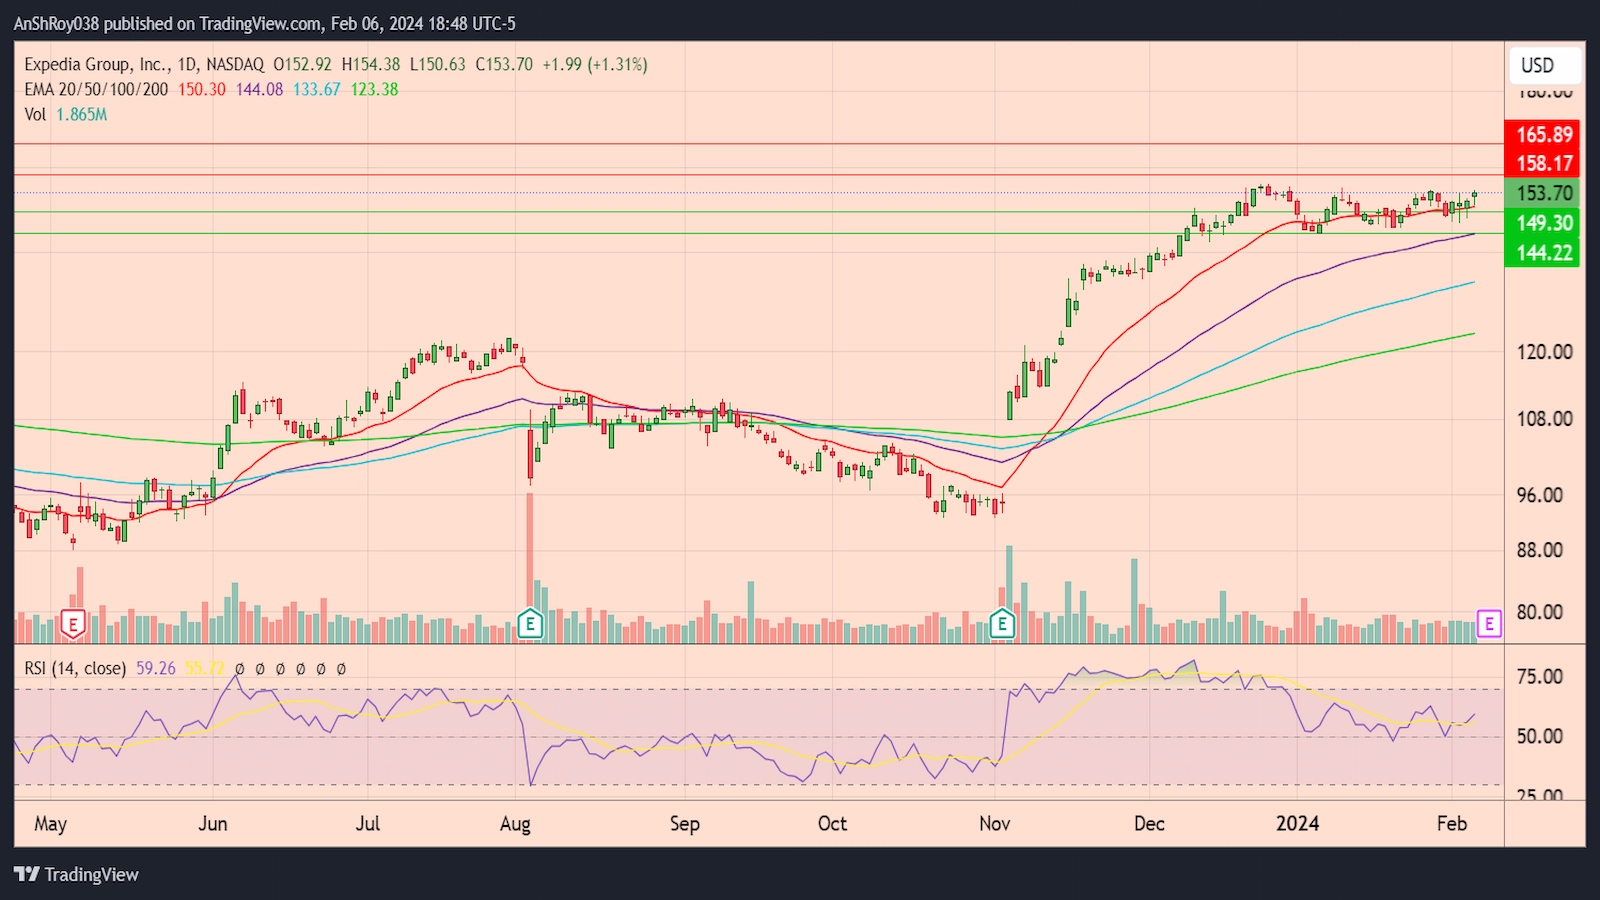
If the Expedia earnings report starts a rally, EXPE price would likely flip the immediate resistance near $158. Afterward, Expedia shares might rally to the resistance near $166 before correcting.
Conversely, breaching the immediate support could attract short sellers to the market, with traders shorting Expedia stocks with a target around the 50-day EMA (purple wave) support near $144.
The RSI for EXPE remained neutral, clocking a reading near 59.26 on the daily charts.

… [Trackback]
[…] Here you will find 56609 more Information on that Topic: coinchapter.com/expedia-earnings-report-mar-expe/ […]
… [Trackback]
[…] Read More on to that Topic: coinchapter.com/expedia-earnings-report-mar-expe/ […]
… [Trackback]
[…] Find More on on that Topic: coinchapter.com/expedia-earnings-report-mar-expe/ […]
… [Trackback]
[…] Read More on that Topic: coinchapter.com/expedia-earnings-report-mar-expe/ […]
… [Trackback]
[…] Find More to that Topic: coinchapter.com/expedia-earnings-report-mar-expe/ […]
… [Trackback]
[…] Here you will find 80076 additional Info on that Topic: coinchapter.com/expedia-earnings-report-mar-expe/ […]
… [Trackback]
[…] Read More Info here on that Topic: coinchapter.com/expedia-earnings-report-mar-expe/ […]