

Key Takeaways:
- Several crypto tokens plummeted on Halloween.
- RNDR, AAVE, AXS, MINA, and FLOW tokens led the crypto token in losses.
- The plummet came after reports of rug pulls on Oct. 30
NEW DELHI (CoinChapter.com) — Cryptocurrencies are bloody on this year’s Halloween, with several tokens painting red candles in their charts. However, tokens like RNDR (Render Network), AAVE (Aave), AXS (Axie Infinity), MINA (Mina Protocol), and FLOW (Flow) led the markets in daily losses.
Interestingly, the Halloween massacre began a day early, with investors waking up to the news of two rug pulls.
Blockchain security firm PeckShield highlighted that a crypto project called Memecoin (MEME) rug pulled its investors when someone in the team swapped 4.8 quadrillion MEME tokens for nearly 44 ETH.

It will be wise to remember that there are multiple crypto projects with names nearly identical to Memecoin or its token MEME, with some of the projects being legitimate. PeckShield also shared details of two more rug pulls.
The MEMEPAD token on Ethereum suffered an identical fate as Memecoin, with someone swapping 4.85 quadrillion MEMEPAD tokens for nearly 45 ETH tokens. Moreover, the TITANX token, another Ethereum-based token, saw someone swapping 4.85 quadrillion (yes, the same amount) for roughly 46 ETH.
All three tokens saw a 100% drop in their respective prices.
RNDR Price Continues Its Downtrend
Render, an AI-based blockchain protocol, seems to be coming down from the recent AI hype. After major tech giants reported unimpressive figures in their Q3 2023 earnings, investors decided to hop off the AI boat.
Furthermore, the ghost of FTX-Alameda Research is haunting RNDR’s price action. Data provider Lookonchain noted that RNDR tokens constituted the majority share in the most recent transfer by the troubled firm, accounting for nearly $18 million of the total $27.2 million FTX transferred on Oct. 31.
The wallet transfer likely created speculation of a token dump in the making, which resulted in traders panic selling the token.
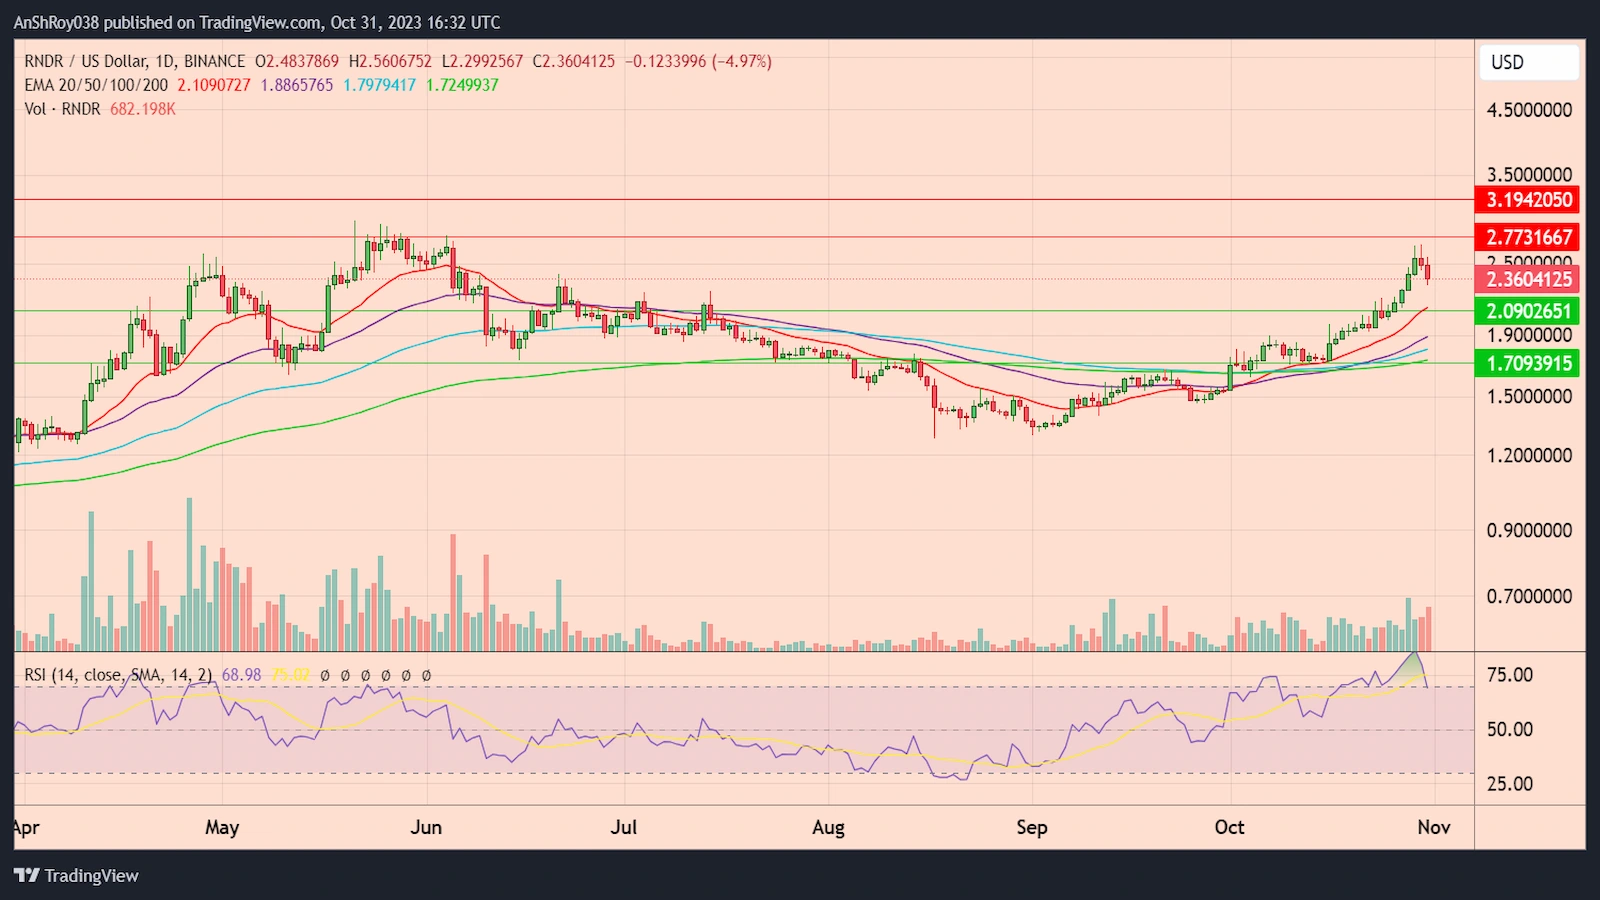
RNDR price dropped over 14% from Oct 30’s high near $2.68 before bulls stopped the plummet. However, if the selling continues, RNDR price might drop to the 20-day EMA (the red wave) support near $2.1.
Moreover, a breakdown below the immediate support might force bulls to defend the 200-day EMA (the green wave) support near $1.71.
Conversely, an uptrend from here would require RNDR price to break above the resistance near $2.8 before targeting the resistance near $3.2.
The RSI for RDNR is neutral again, after a multi-day foray in the overbought region, with a score of 68.98 on the daily charts.
AAVE Price Fails To Break Above Multi-Month Trendline Resistance
This Crypto Halloween, the AAVE token did not have the FTX ghost dragging it to the grave, yet its prices dropped by nearly 10% since Oct 30 to reach a daily low near $78.8 on Oct. 31.
It seems bears aggressively defended the multi-month descending trendline (black) resistance, which has rebutted AAVE price rally multiple times since Jan. 2023. However, the long lower wick on the AAVE price’s daily candle suggests that the bulls have not given up yet.
The crypto token price would need to break above the descending trendline resistance before targeting the resistance near $88.72. Moreover, flipping the immediate resistance could help AAVE price reach the resistance near $96.6 before correcting.
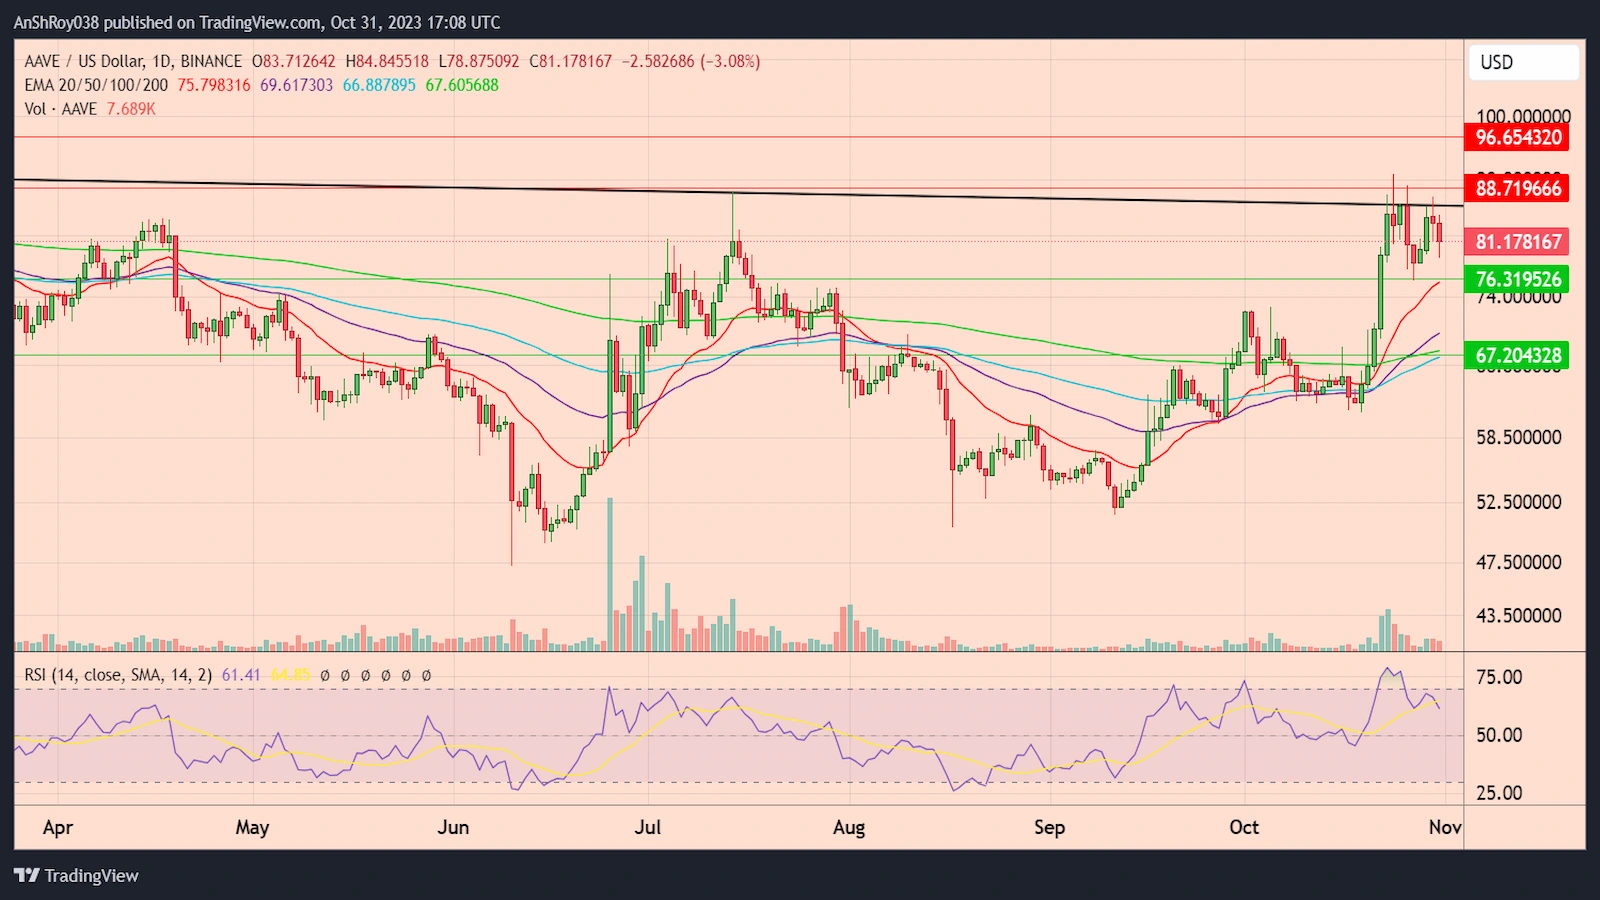
On the other hand, if bulls buckle under the selling pressure, AAVE price could drop to the 20-day EMA (the red wave) support near $76.3. A breakdown below the immediate support might force bulls to defend the 200-day EMA (the green wave) support near $67.
The RSI for AAVE remained neutral, with a reading of 61.41 on the daily charts.
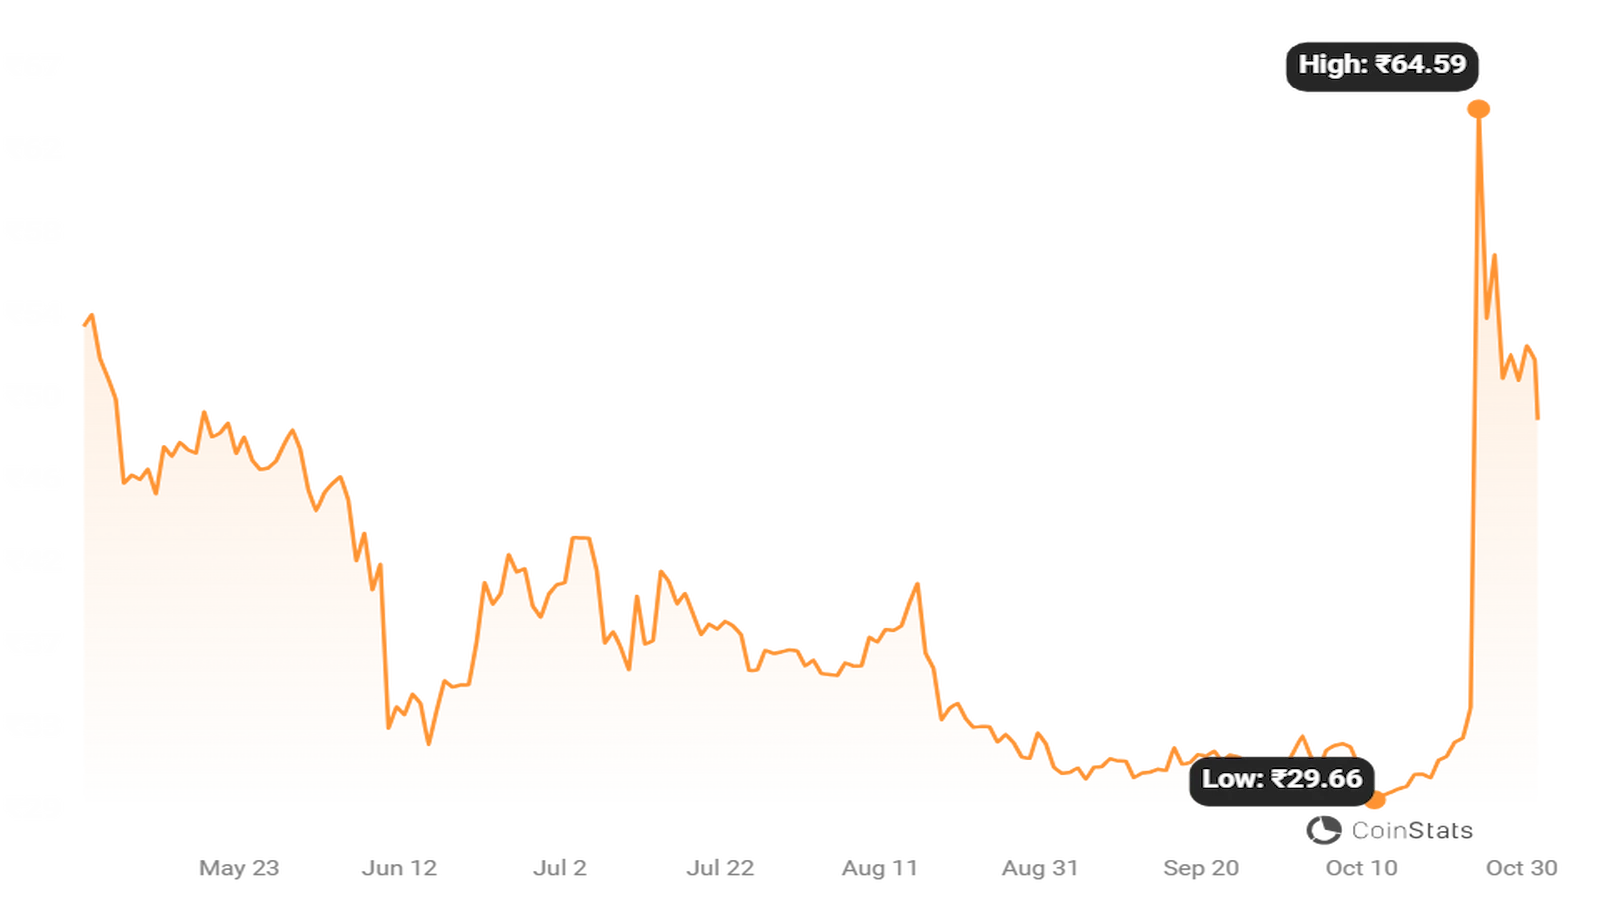
This Crypto Halloween, AXS Price Victim Of Profit Booking
Axie Infinity’s native token, AXS, price fell victim to profit booking after a recent rally helped the token recover its losses since Aug. 16, 2023.
However, the Axie Infinity token’s price rally came to a close on Oct. 31, after AXS price dropped nearly 9% to reach a daily low near $5.26.
An increase in selling pressure would likely send AXS price to the 100-day EMA (the blue wave) support near $5.03. Breaching the immediate support level might force the Axie Infinity token to test the support near $4.4 before recovering.
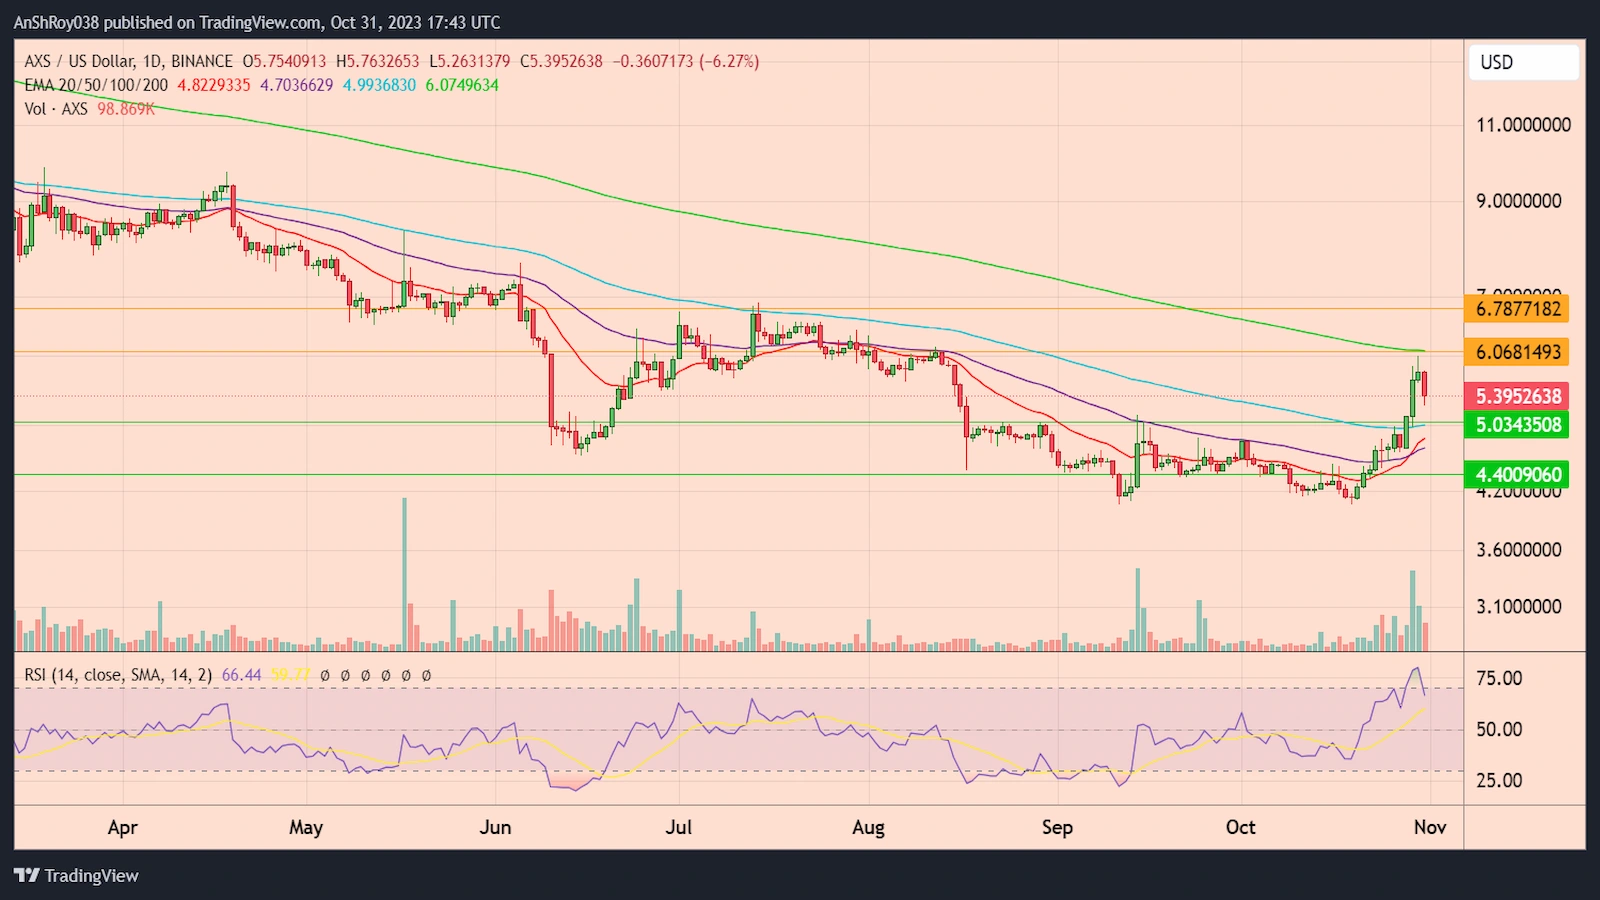
Conversely, a bullish rally would pit AXS price against the 200-day EMA (the green wave) resistance near $6.1. Breaking and consolidating above the immediate resistance could help AXS price capture the resistance near $6.8.
The RSI for AXS remained neutral, with a value of 66.44 on the daily charts.
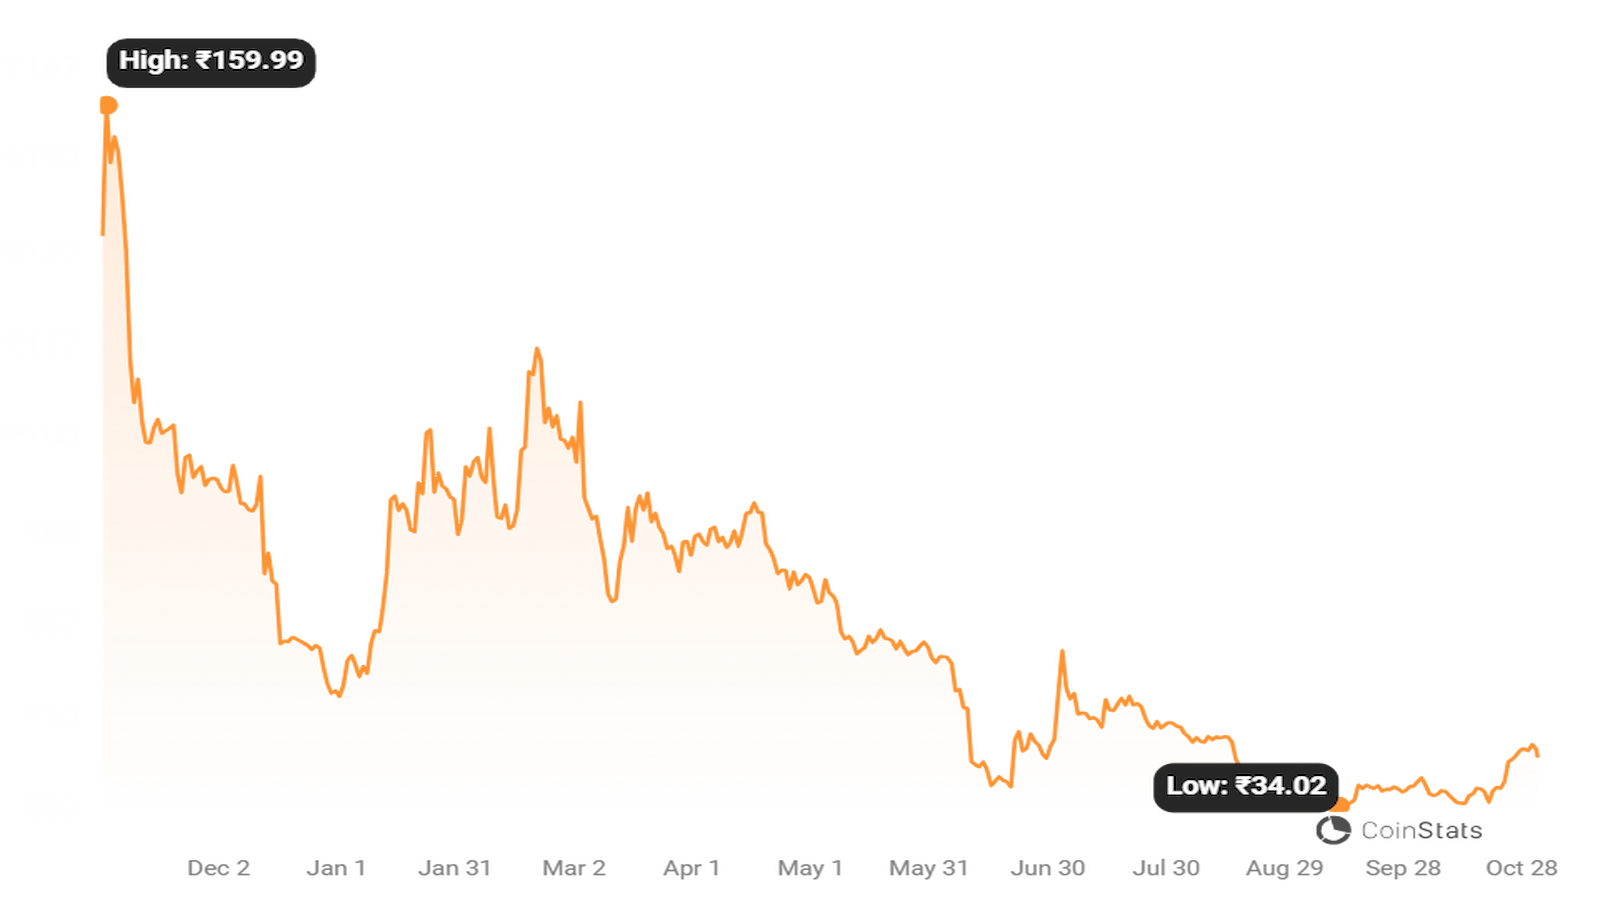
MINA Price Hungover From Recent High This Crypto Halloween
Blockchain platform Mina Protocol price recently outperformed most of its peers after spiking over 100% on Oct. 24. Afterward, MINA price pared most of its gains to close Oct. 24 up by nearly 60%. Since then, the token has entered a correction phase, forming nearly consecutive lower lows.
Since Oct 25, MINA price has dropped by 25% to reach a daily low near $0.57 on Oct. 31, after dropping nearly 11% on the day. Bulls are making an effort, but it might not be enough to save MINA price from dropping to the 20-day EMA (the red wave) support near $0.53.
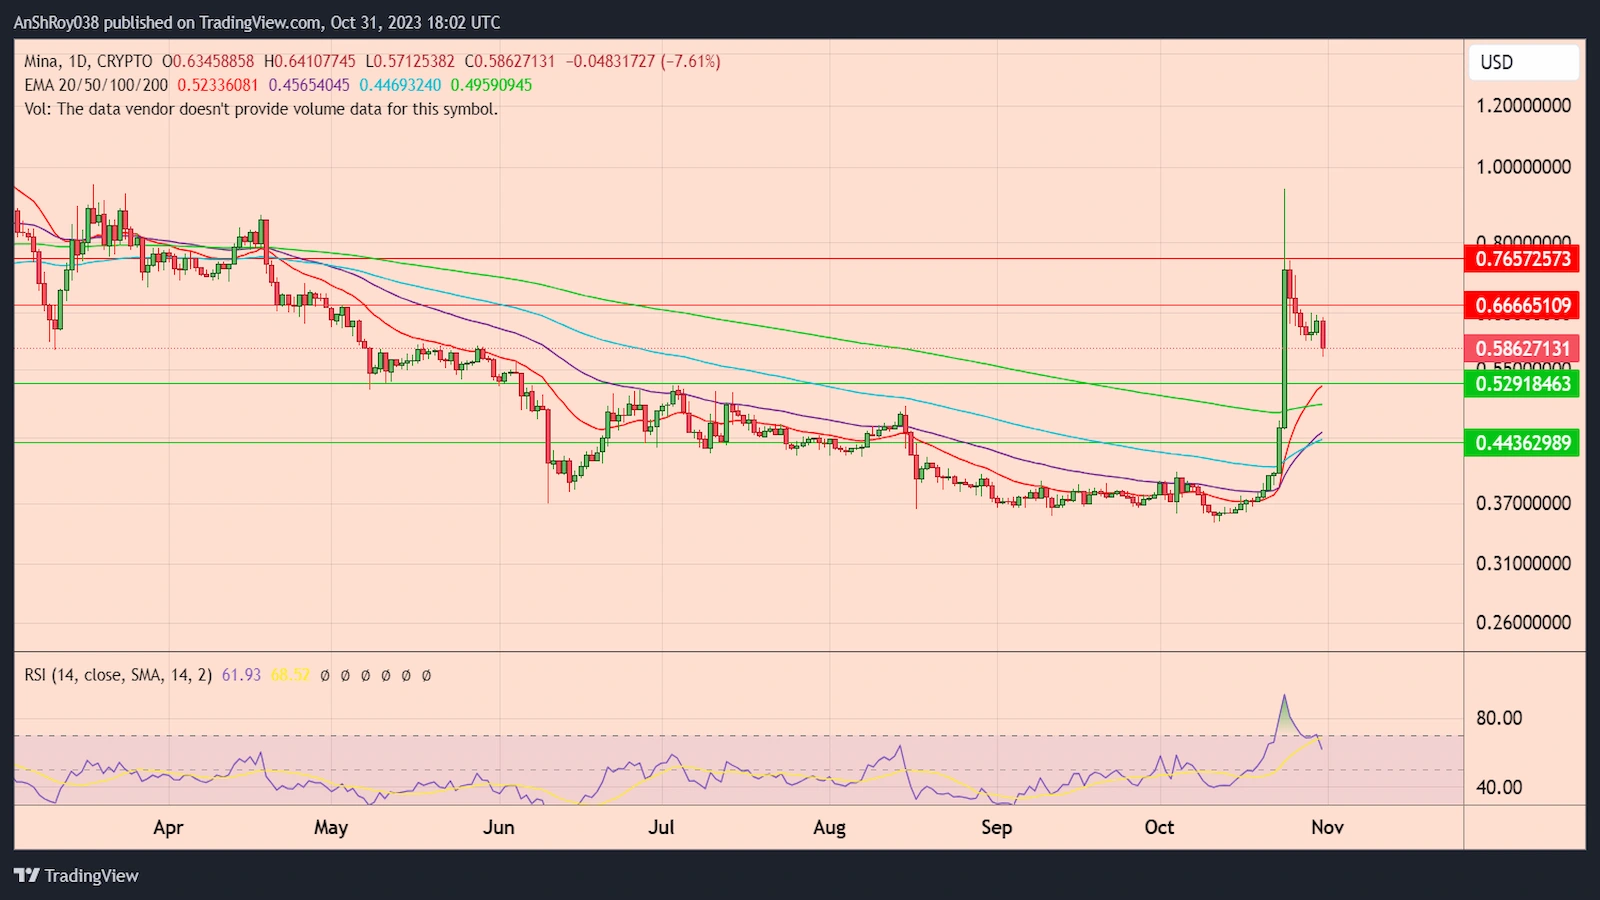
Breaching the immediate support could see MINA price drop to the 100-day EMA (the blue wave) support near $0.44.
Conversely, the MINA price would need to break above the immediate resistance near $0.666 to infuse confidence in the rally. Breaking and consolidating above the immediate resistance might help the Mina Protocol token price target the resistance near $0.76 before correcting.
The RSI for MINA remained neutral, with a score of 61.93 on the daily charts.
FLOW Price Holds Above Key Support This Halloween
FLOW price plunged after a minor rally helped the token reach its highest level since Aug. 15 earlier this year.
The Flow crypto token price fell over 8% to reach a daily low near $0.5 before recovering some of the lost ground.
The sudden drop in price forced bulls to defend the 20-day EMA (the red wave) support near $0.49. If FLOW price breaches the immediate resistance, the token might drop to the support near $0.432.
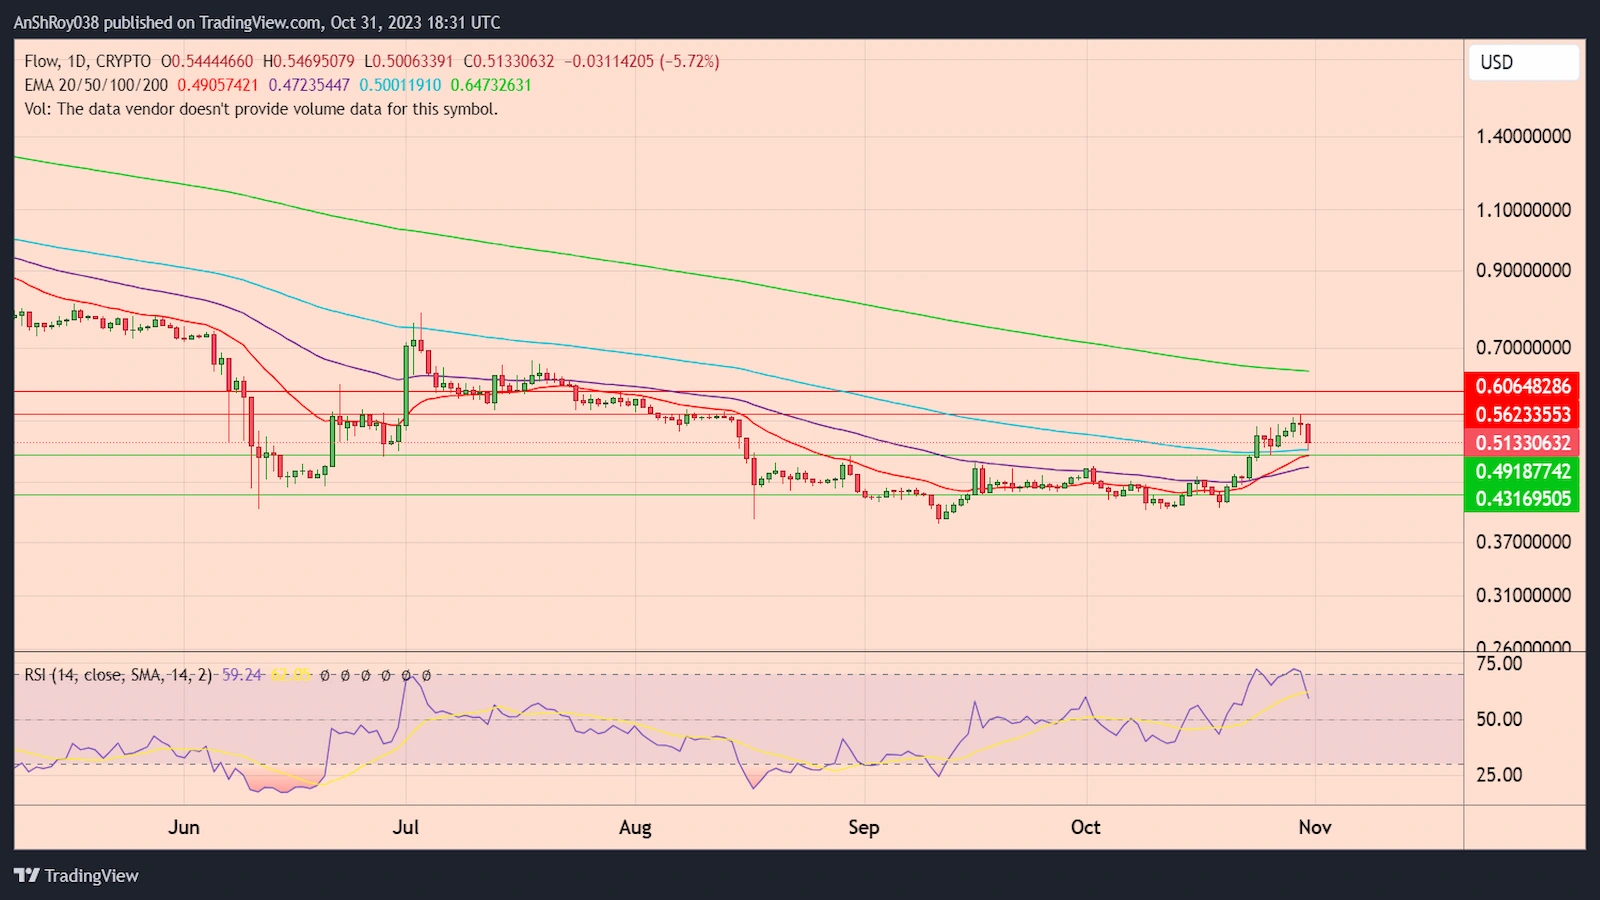
Conversely, an uptrend might see the FLOW price break above the immediate resistance near $0.562 before targeting the resistance near $0.606.
The RSI for FLOW remained neutral, with a score of 59.24 on the daily price chart.
