
Key Takeaways:
- Helium price has formed a bullish pattern called falling wedge.
- The price target from the pattern is 262% from current price levels.
- However, bearish pressure for HNT price remains strong, with bears defending EMA levels.
 Price Eyes 262% Jump From Bullish Wedge Pattern")
NEW DELHI (CoinChapter.com) — Helium (HNT) has formed a bullish technical pattern called the falling wedge.
In detail, the technical pattern forms when the price fluctuates inside a pair of falling trendlines that would converge down the slope. The outcome of such downside patterns is typically a price breakout to the upside.
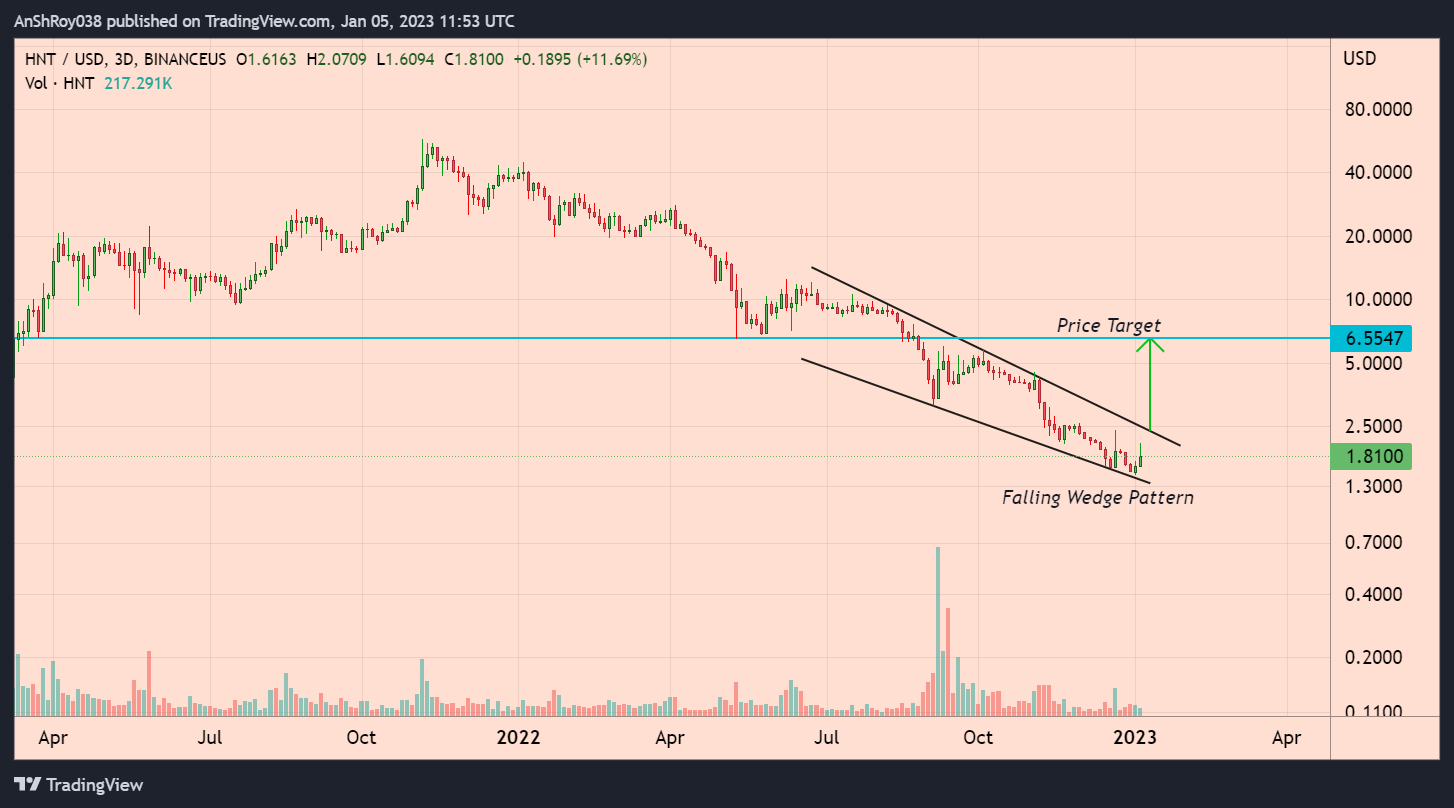
One key feature of the pattern is that volumes usually decline as the trendlines converge.
The upside target for the breakout is equal to the maximum distance between the falling wedge’s upper and lower trendlines. Per the rules of technical analysis, the HNT price might jump more than 262% if the Helium token confirms the pattern.
Also Read: Core Scientific Stock (NASDAQ: CORZ) crashes after filing for Chapter 11 bankruptcy
However, the ongoing market downtrend has seen several crypto tokens form a falling wedge pattern. As such, Helium bulls will need to increase the buying pressure significantly for HNT to confirm the bullish pattern.
According to the Helium website, Hotspot creators provide and validate wireless coverage and transfer device data over the network to earn HNT tokens.
HNT Price Struggling To Break Above EMA Resistances
Meanwhile, HNT price jumped nearly 38% since Jan 2 to form a daily high near $2.071 on Jan 5. However, bears started selling on Jan 5, resulting in HNT paring most of its 25% daily gains. Furthermore, the downward-sloping EMA trendlines underscore the bearish pressure against the Helium token.
If the bears continue to sell, the HNT price might drop test support near $1.5, from which the Helium token started its recent uptrend. Moreover, if the immediate support level fails, the HNT price could fall to $1.23, which Helium last reached in Dec 2020 before recovering.
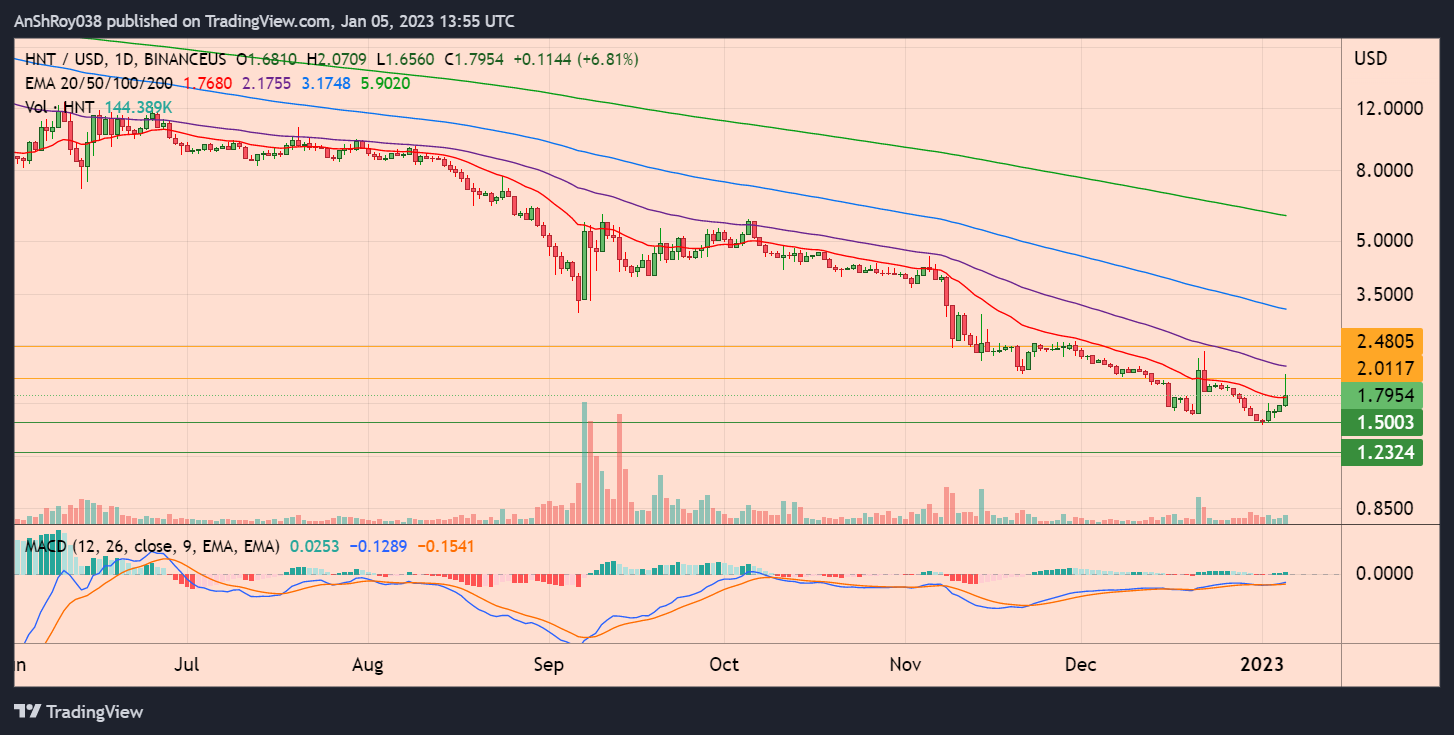
Meanwhile, the momentum oscillator MACD showed bullishness for the Helium token.
The MACD and its signal line formed a bullish crossover for HNT on Jan 3. Moreover, positive bars on the indicator’s histogram are expanding, indicating that the MACD line (difference between 12-day and 26-day EMA) is moving away from the MACD signal line (9-day EMA of MACD).
If the HNT price continues to rise, the Helium token might rise to challenge resistance near $2.01. Breaking and consolidating above immediate resistance would likely help the HNT needle above the 50-day EMA (purple wave) to reach $2.48 before retreating.
Pi Network pared its 2,300% gains. Is it still a buy? Read here to know more.

