
Yerevan (CoinChapter.com) — Holo (HOT) is attempting to perform a very rare stunt that involves breaking bullishly out of a pattern that was promising every kind of bearish pain to the token.
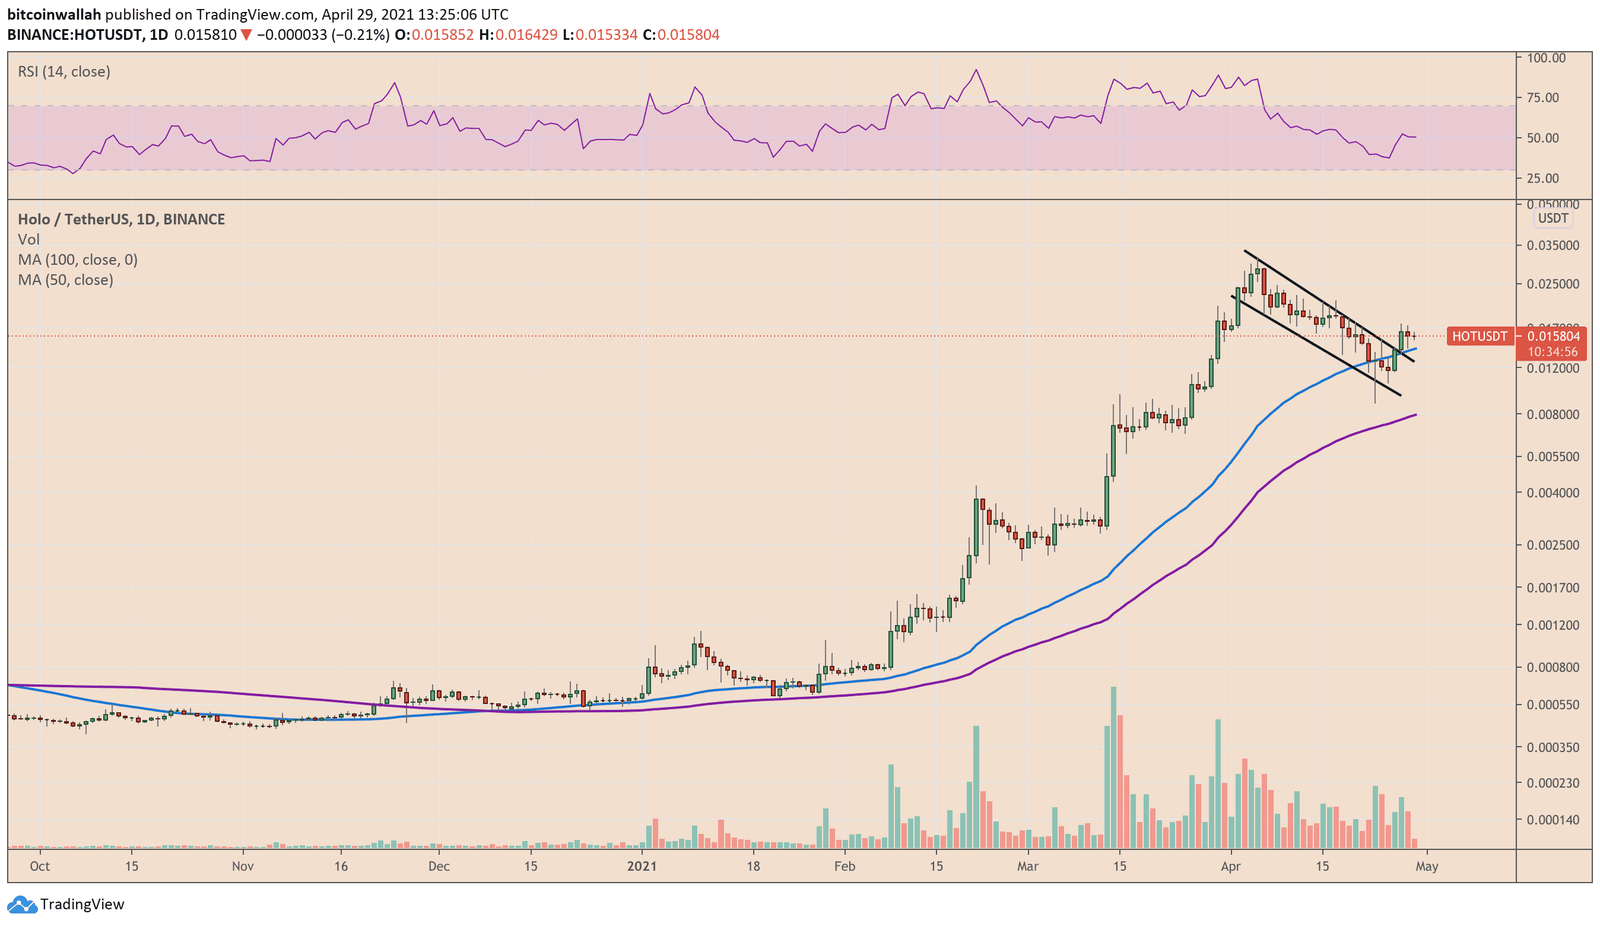
The HOT/USDT exchange rate has pierced above a short-term falling trendline resistance that constitutes a Bullish Flag pattern. The task earlier seemed difficult. Holo had corrected by more than 50 percent that technically threatens to invalidate the bullish continuation structure.
But CoinChapter.com has spoken about the odds in one of its earlier analyses. Entering this week, the odds appear to have more weight.
Read More: Holo (HOT) Follow Up 05: That Risky Bull Flag Pattern Holding Up
HOT/USDT now targets another record high following its Bullish Flag breakout. There remain inconsistencies with the upside move, but technically the pattern indicates a run-up towards $0.034, based on the Flag breakout target, typically measured per the uptrend’s height that precedes the downside consolidation move.
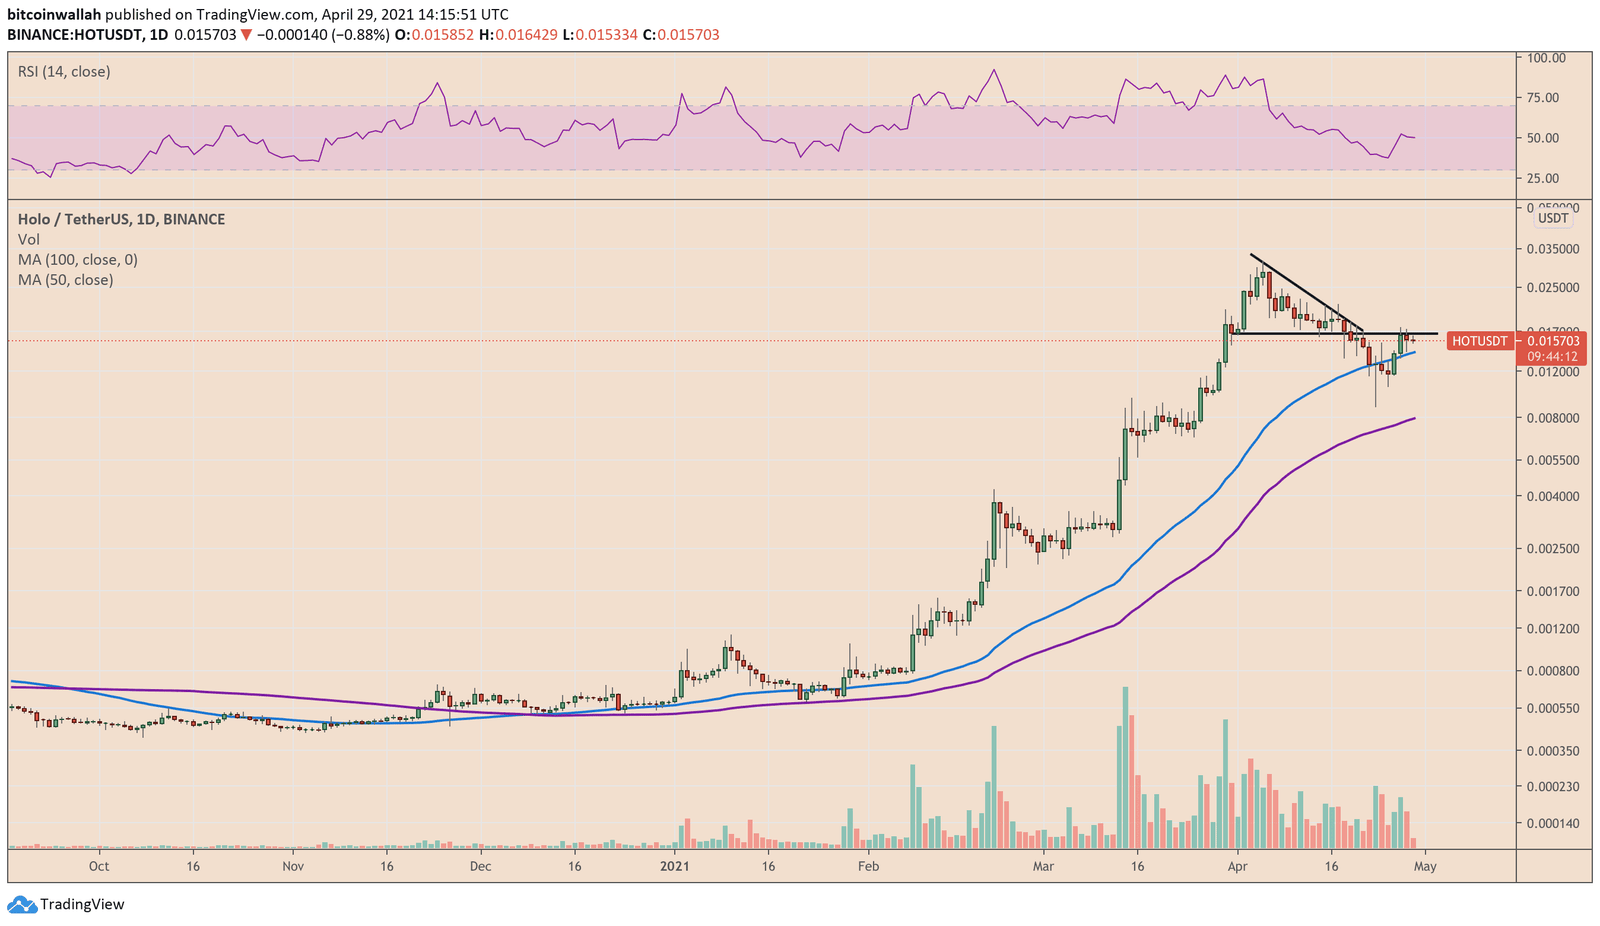
Holo Bearish Triangle
Bulls appear hesitant near the $0.017-resistance level this week. A break above it and the HOT/USDT rate may extend its breakout move to its previous high of circa $0.031. Meanwhile, renewed selling pressure could land the prices back into the Flag range that somewhat triggers a parallel technical setup, dictated by a Descending Triangle pattern.
Read More: Holo (HOT) Follow Up 04: A 76% Price Crash Underway
In retrospect, the HOT/USDT’s drop came as a part of a bearish reversal breakdown out of a Descending Triangle. It threatened to crash the prices to as low as $0.014. But following Holo’s 100 percent rebound off its local bottom level near $0.008, the price almost negated the risks associated with the Triangle pattern.
The 50-day moving average now provides additional support to the ongoing Holo price rebound, raising possibilities that it might continue trading upwards to suit its Flag breakout narrative.
Meanwhile, an upside rejection followed by a breakdown below the 50-day moving average increases the risks of re-activating the Descending Triangle breakdown pattern. In turn, that would mean a crash towards $0.014, as suggested above. It is advisable to put stop losses appropriate for any trend reversal surprises.

… [Trackback]
[…] Read More Information here to that Topic: coinchapter.com/holo-hot-follow-up-06-that-risky-bullish-breakout-is-almost-happening/ […]
… [Trackback]
[…] There you will find 8323 additional Info to that Topic: coinchapter.com/holo-hot-follow-up-06-that-risky-bullish-breakout-is-almost-happening/ […]
… [Trackback]
[…] Information to that Topic: coinchapter.com/holo-hot-follow-up-06-that-risky-bullish-breakout-is-almost-happening/ […]
… [Trackback]
[…] Read More on that Topic: coinchapter.com/holo-hot-follow-up-06-that-risky-bullish-breakout-is-almost-happening/ […]
… [Trackback]
[…] Info on that Topic: coinchapter.com/holo-hot-follow-up-06-that-risky-bullish-breakout-is-almost-happening/ […]