

Key Holo Outlook
- Holo (HOT) attempts a rebound after approaching its 50-day moving average support.
- But an absence of strong trading volumes continues to pose downside risks.
- Meanwhile, the price appears to have located short-term support atop a horizontal trendline, which constitutes a bearish reversal triangle.
Yerevan (CoinChapter.com) — Holo (HOT) prices underwent a bloody weekend like every other digital asset in the cryptocurrency market. The data integrity protocol token almost tailed Bitcoin, the flagship cryptocurrency, to its intraday losses and gains. It showed that the pair HOT/USDT had no catalysts of its own, which exposed it to the mercy of top-cap tokens.
The short-term correlation between Bitcoin and Holo could prove problematic. If the BTC/USD exchange rate corrects further lower than its recently-established record high of $64,896.75 (data from Coinbase), it could prompt traders to offset their losses by selling tokens that were more profitable than Bitcoin to them. HOT’s year-to-date performance sits above 2,528 percent.
Read more: Bitcoin Weekly Analysis: Its Do or Die After Weekend Bloodbath
In BTC’s case, the profits are a dwarfed 94 percent. Naturally, there is more money to make from Holo at this point.
Descending Triangle
More bearish tailwinds for HOT/USDT come from a potential descending triangle formation. In the previous Holo follow-up, CoinChapter.com discussed the possibility of a “risky” bullish breakout, but it had based the upside theory on a Falling Wedge formation. We called it risky because of fears that bulls would not follow through with this bias owing to higher HOT valuations.
Read more: Holo (HOT) Follow Up: Risky Bullish Breakout in Play
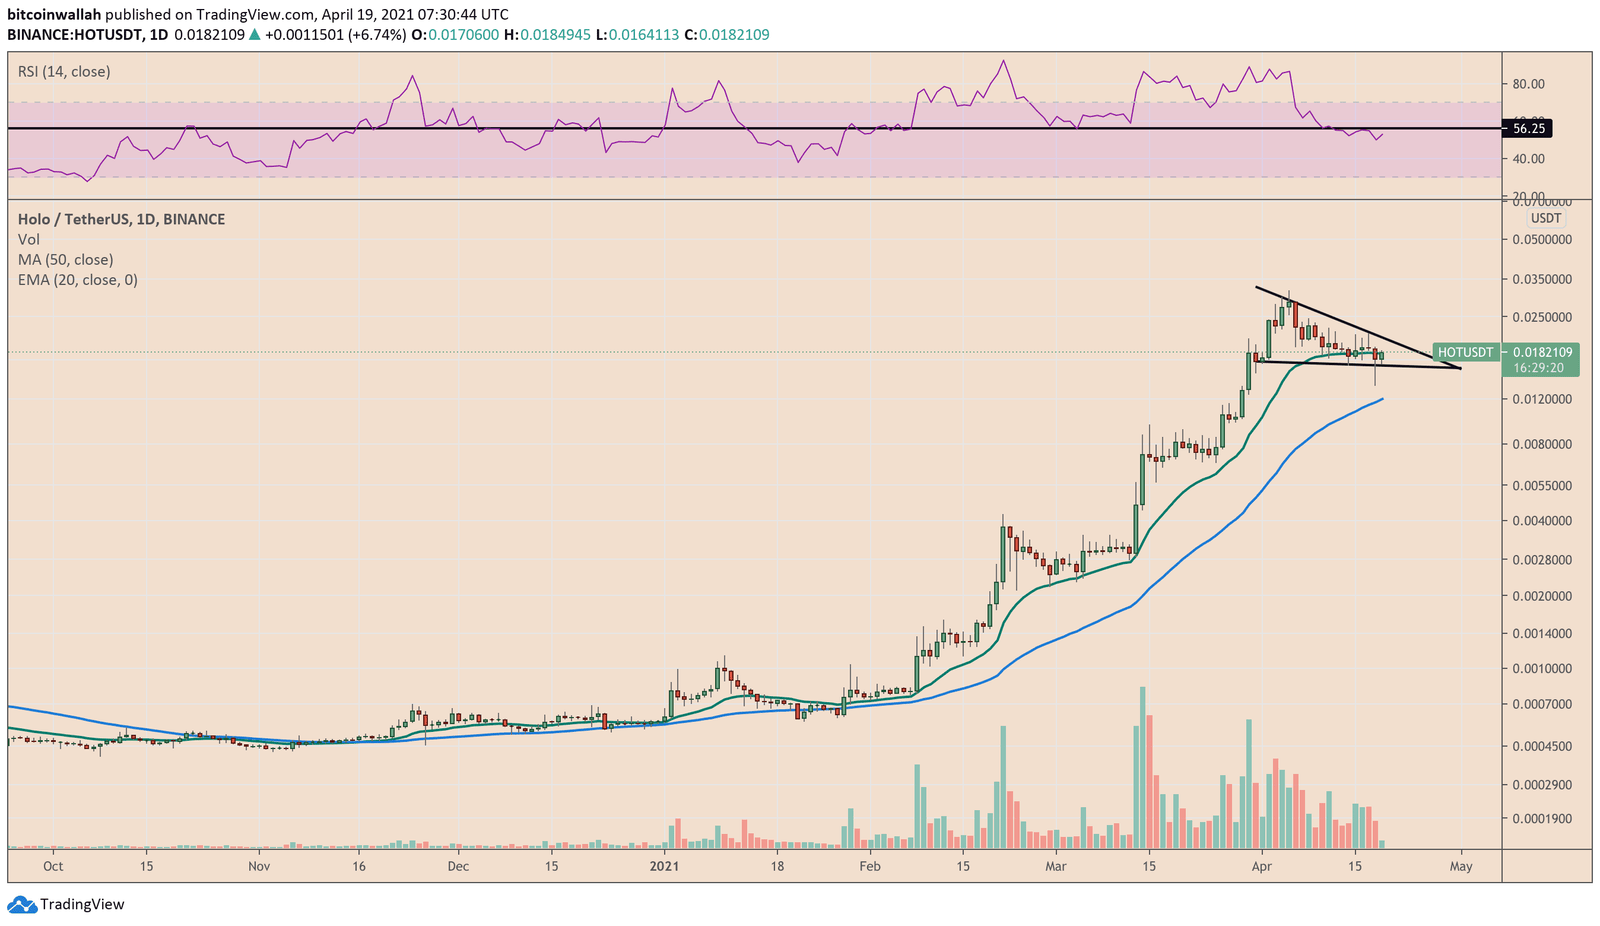
Heading into the new weekly session, HOT appears to want to turn its bullish wedge scenario into a bearish triangle. It has repeatedly tested a horizontal trendline as support while forming declining peaks. Many traditional analysts see it as a sign of bullish exhaustion — a bearish reversal structure that comes into play after the price breaks down below the horizontal support trendline.
Should HOT pursue a breakdown, its technical downside target will be as low as the maximum distance between Triangle’s upper and lower trendline. That puts the Holo token en route to $0.0045, a mid-March 2021 support level.
Meanwhile, a breakout above the Triangle’s upper trendline invalidates the bearish theory.
Photo by Hans-Jurgen Mager on Unsplash

… [Trackback]
[…] Find More Information here to that Topic: coinchapter.com/holo-hot-follow-up-2-bearish-triangle-overpowering-bullish-wedge/ […]
… [Trackback]
[…] There you will find 77218 more Info on that Topic: coinchapter.com/holo-hot-follow-up-2-bearish-triangle-overpowering-bullish-wedge/ […]
… [Trackback]
[…] Read More on that Topic: coinchapter.com/holo-hot-follow-up-2-bearish-triangle-overpowering-bullish-wedge/ […]