
NEW DELHI (CoinChapter.com) — Bitcoin (BTC) prices reached $20,000 after the largest crypto by market cap fell for the ninth day straight, including a 15.55% drop on Jun 13. Additionally, BTC exchange inflows have spiked to reach levels last seen in Nov 2018.
Sell the Bitcoin “rips”
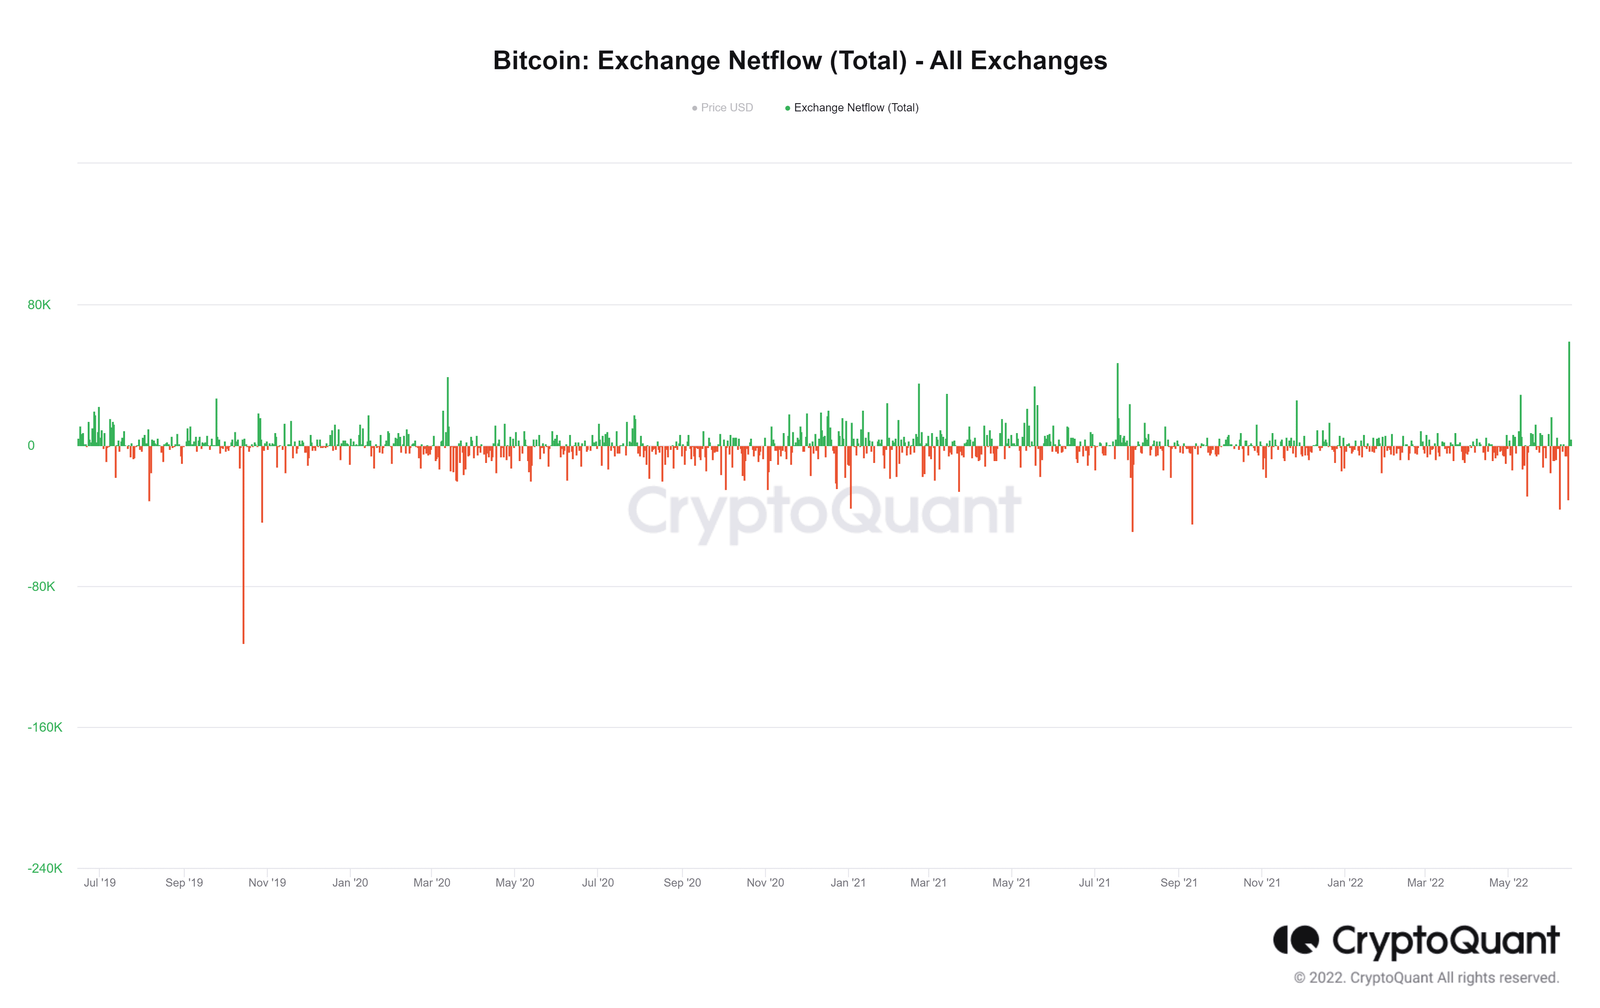
Data from the on-chain analytics platform CryptoQuant show major exchanges received a massive influx of BTC on Jun 14. One reason behind the inflows might be the panic that gripped the markets as Bitcoin prices fell below $21,000 for the first time since Dec 2020.

FUD surrounding Celcius Network suspending user withdrawals and transfers added to the bearish headwinds BTC price action is facing. Additionally, rumors of VC firm Three Arrows Capital (3AC) battling against insolvency did not help investor sentiments.
Also Read: Bitcoin (BTC) set to fall below $20K this week on Fed’s 0.75% rate hike FUD.Meanwhile, June 14 saw users move 59,376.6 BTC into exchange wallets, Bitcoin’s largest daily inflow since Nov 30, 2018. In detail, an increase in exchange inflow often suggests that investors might be getting ready to sell their BTC holdings.
Analysts remain skeptical of Bitcoin’s future. However, several analysts believe that a bottom for BTC prices might not be coming soon, with macro indicators likely to dictate Bitcoin price action.
Additionally, Aaron Samsonoff, CSO and co-founder of InvestDEFY, told CoinChapter that this might not be the time to buy the dip yet.
We are in a “sell the rips” versus “buying the dip” environment. In normal economic conditions, $20k-$24k range for BTC would be an opportunity to load up, but this is not a business-as-usual environment. Be aware it is a possibility we could see BTC or ETH prices cut in 1/2 during true panic.
Samsonoff said.RSI Oversold, But BTC Prices Continue To Falter
Meanwhile, Bitcoin prices reached a low of $20,079, a drop of nearly 10% from Jun 15’s high of $22,260, during trading on Wednesday before buyers pushed prices back above $21,000. The long lower wick on the day’s candle indicates aggressive buying action from the bulls.
The relative strength index for BTC is currently oversold on the daily and weekly timeframes. The RSI measures the magnitude of recent price changes to analyze overbought or oversold conditions. When the RSI goes below 30, the asset enters the oversold region.
An oversold RSI indicates a bullish trend reversal is on the cards. If BTC prices stage an uptrend, bulls must first conquer immediate resistance near $21,650 before challenging resistance near $24,400.
Also Read: Bitcoin mining firms sustain profits despite BTC dropping below $22K — Tesla, MicroStrategy lose billions.Finally, a sustained uptrend might push BTC prices to target resistance near the 20-day exponential moving average (20-day EMA, red wave) near $26,900 before corrections pare gains.
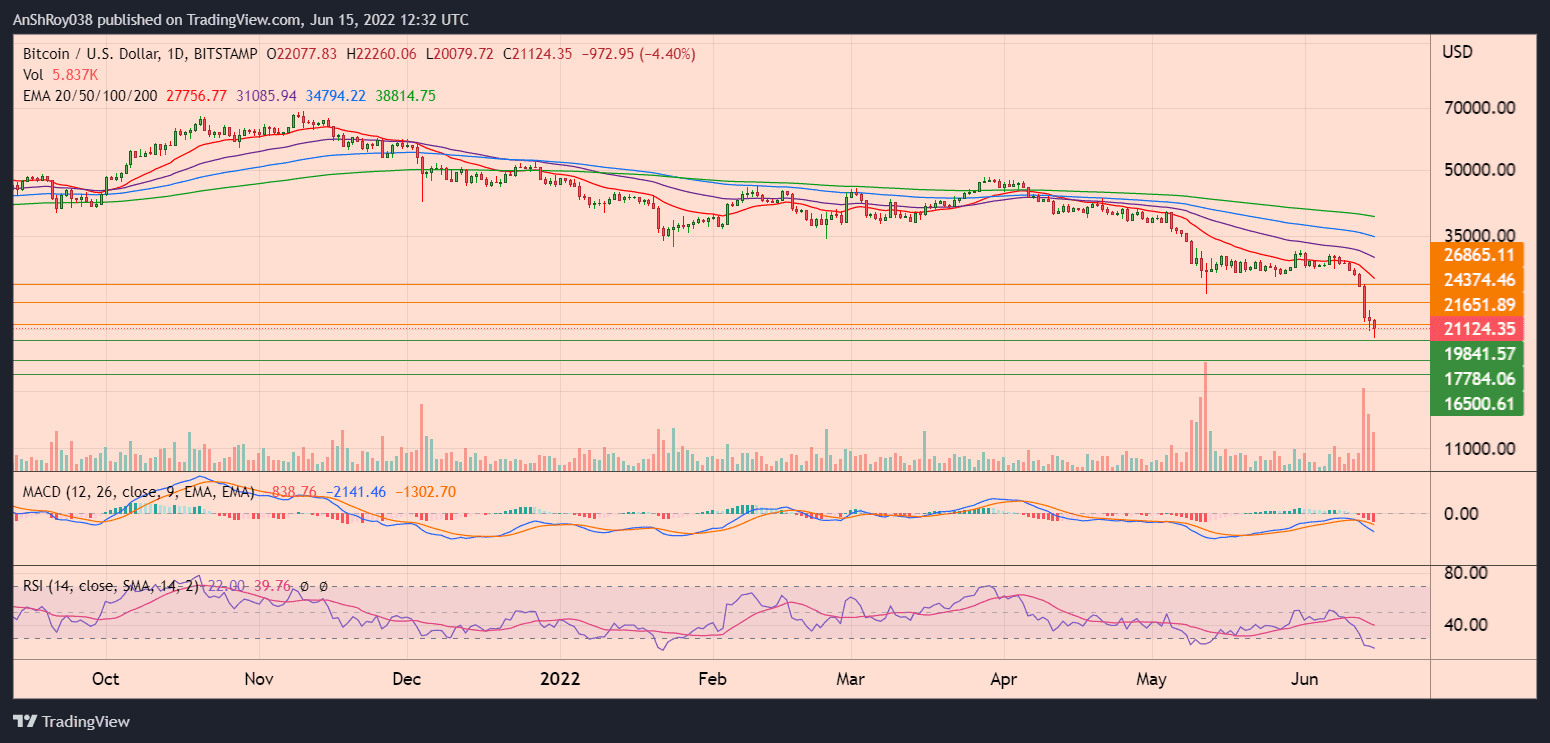
However, given the ongoing market sentiment, Samsonoff stated the ongoing crypto winter might last for another 6-18 months, depending on FED actions. Meanwhile, the momentum oscillator MACD continues to forecast a strengthening downward momentum for Bitcoin.
Moreover, the MACD line and the MACD signal line painted a bearish crossover on Jun 12. A bearish crossover occurs when the MACD line (difference of 12-day and 26-day EMA) moves below the MACD signal line (9-day EMA of MACD). Therefore, traders consider the pattern a sell signal.
If BTC prices continue their downtrend, the token might fall to support near $19,840. A breach below immediate resistance could force BTC prices down to support near $17,800, which previously supported BTC price action between Nov 30, 2020, and Dec 12, 2020.
Finally, a marketwide sell-off could see Bitcoin fall to $16,500 before recovering.
At writing, BTC was trading at $21,172, down 4.19% on the day.

… [Trackback]
[…] There you will find 17087 additional Information to that Topic: coinchapter.com/bitcoin-exchange-inflow-jumps-highest-since-2018-btc-price-reaches-20k/ […]
… [Trackback]
[…] Information on that Topic: coinchapter.com/bitcoin-exchange-inflow-jumps-highest-since-2018-btc-price-reaches-20k/ […]
… [Trackback]
[…] Info on that Topic: coinchapter.com/bitcoin-exchange-inflow-jumps-highest-since-2018-btc-price-reaches-20k/ […]
… [Trackback]
[…] Information to that Topic: coinchapter.com/bitcoin-exchange-inflow-jumps-highest-since-2018-btc-price-reaches-20k/ […]
… [Trackback]
[…] Read More Info here to that Topic: coinchapter.com/bitcoin-exchange-inflow-jumps-highest-since-2018-btc-price-reaches-20k/ […]
… [Trackback]
[…] Read More to that Topic: coinchapter.com/bitcoin-exchange-inflow-jumps-highest-since-2018-btc-price-reaches-20k/ […]