
Key Takeaways:
- Sandbox’s SAND token leaped into the list of top 50 cryptos by market cap with a 87.5% weekly jump.
- SAND broke out of a bullish technical pattern which might lead to the token testing its ATH.
NEW DELHI (CoinChapter.com) — SAND, the native token of blockchain game Sandbox, rocketed to the 33rd position in the list of top 50 cryptocurrencies by market capitalization on Nov 28. The leap follows an 87.5% gain in the last seven days.
The popular metaverse token has been rallying for a month now, gaining 366% November to date. Additionally, increased interest by big tech companies in the metaverse, mainly Facebook’s decision to rebrand itself to Meta, has been a key factor in the rise of SAND and similar virtual world tokens.
The metaverse is a digital world that exists beyond analog, combining virtual reality (VR), augmented reality (AR) with social media, online gaming, and cryptocurrencies to allow users to interact digitally.
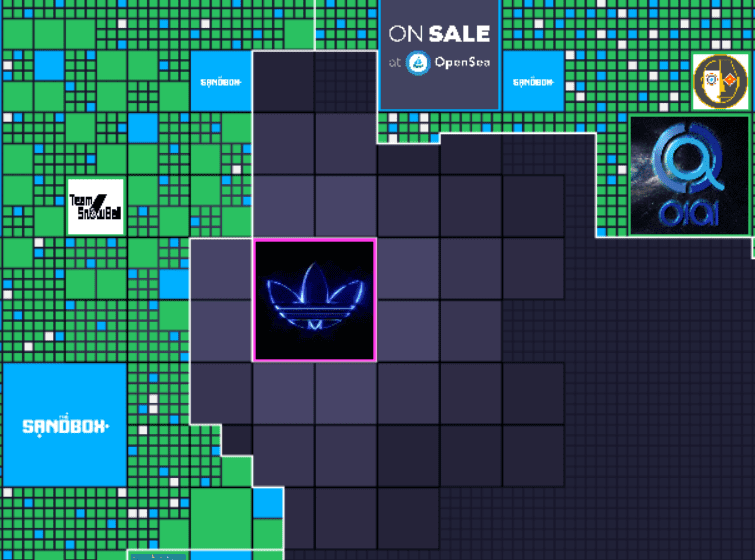
Related: Metaverse crypto assets eye 26% rally as Grayscale stokes bullish outlook.More bullish cues for SAND come from Sandbox’s potential partnership with sports merchandise giant Adidas. In detail, on Nov 23, Sandbox invited Adidas to join the metaverse.
A day later, Adidas announced they have partnered with crypto exchange Coinbase. However, the tweet did not give further details, stating it’s “probably nothing,” a popular crypto meme reference.
Moreover, it is not hard to imagine Adidas coming up with a virtual shop selling digital, tokenized Adidas wearables for in-game characters. Recently, Nike filed seven requests with the US Patent and Trademark Office to trademark its brand for virtual goods, including shoes, clothing, etc.
Likewise, it is safe to assume that Adidas has similar plans to market its products in the virtual world.
Sandbox Price Analysis
Sandbox broke above a falling wedge pattern on its 4-Hour (4H) charts on Nov 28. In detail, two trendlines connecting the highs and lows of a price series create a wedge pattern. A falling wedge is a bullish reversal pattern, with prices targeting an upwards move equal to the distance between the wedges’ resistance and support at the pattern’s start.
For SAND, the price target is $8.011. The Sandbox token tested the wedge’s support before rebounding from its 50-4H MA line. Bulls pushed SAND above its 20-4H EMA as prices broke out of the technical pattern. As a result, the Sandbox token would need to stay above its 26-4H EMA line to reach the wedge’s predicted price target.
Also Read: SAND hits another record high on Sandbox Metaverse Alpha launch FOMO.At present, SAND has immediate resistance at $7.75. Further upside movement would bring SAND near its target price level. If it moves above the wedge’s price target, profit taking by retail traders could lead to prices correcting after reaching $8.071.
However, if SAND survives the sell-off, prices would move to $8.337 in the token’s bid to challenge its recent ATH.
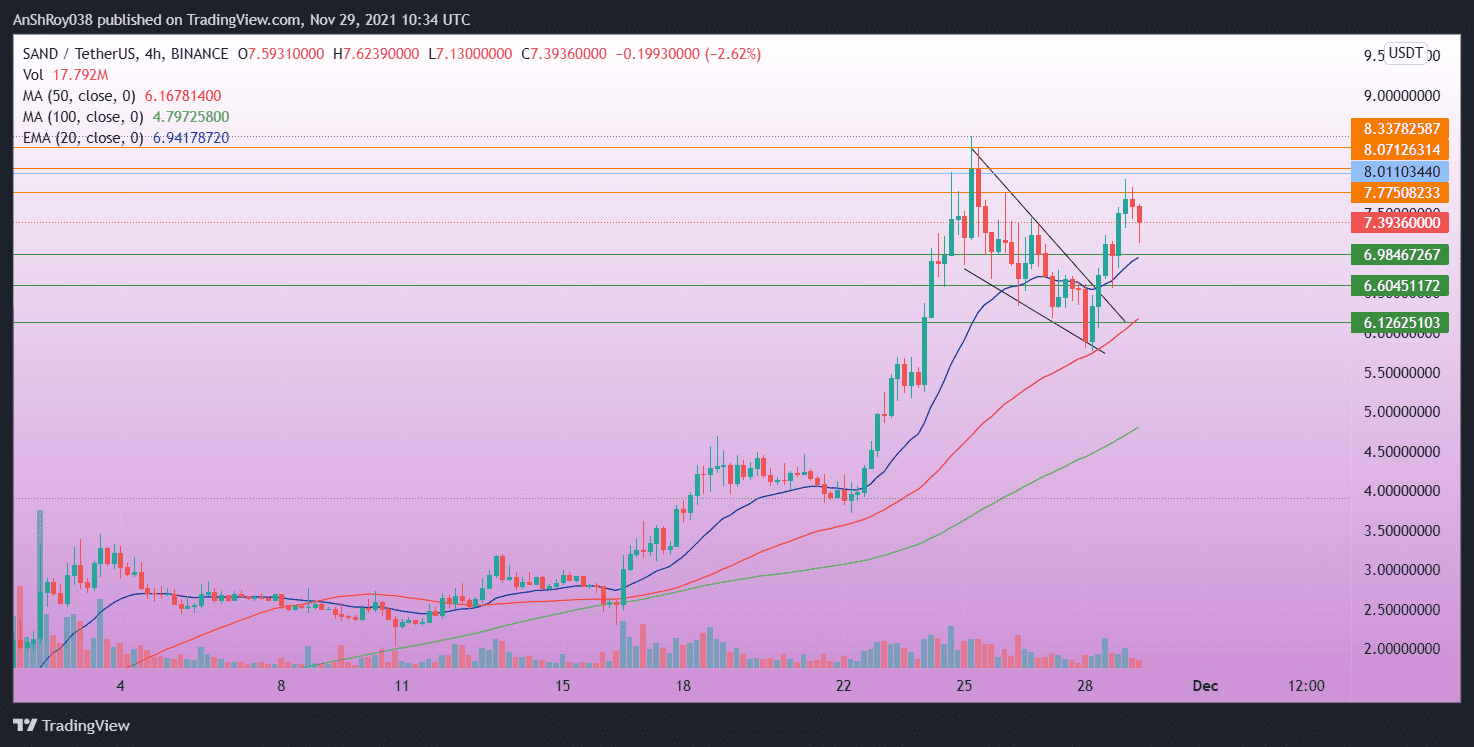
If the breakout fails, SAND will seek support at $6.984, near its 20-4H EMA line. As such, it would indicate that selling sentiment is strong, and prices could fall to $6.604. Finally, a marketwide sell-off could bring prices to $6.126, near the Sandbox token’s 50-4H MA line.
Meanwhile, on the daily charts, trend-based momentum oscillator MACD remains bullish for SAND. Bars on the MACD histogram indicate the MACD line (difference of 12-day and 26-day EMA) is moving above the MACD signal line (9-day EMA of MACD).
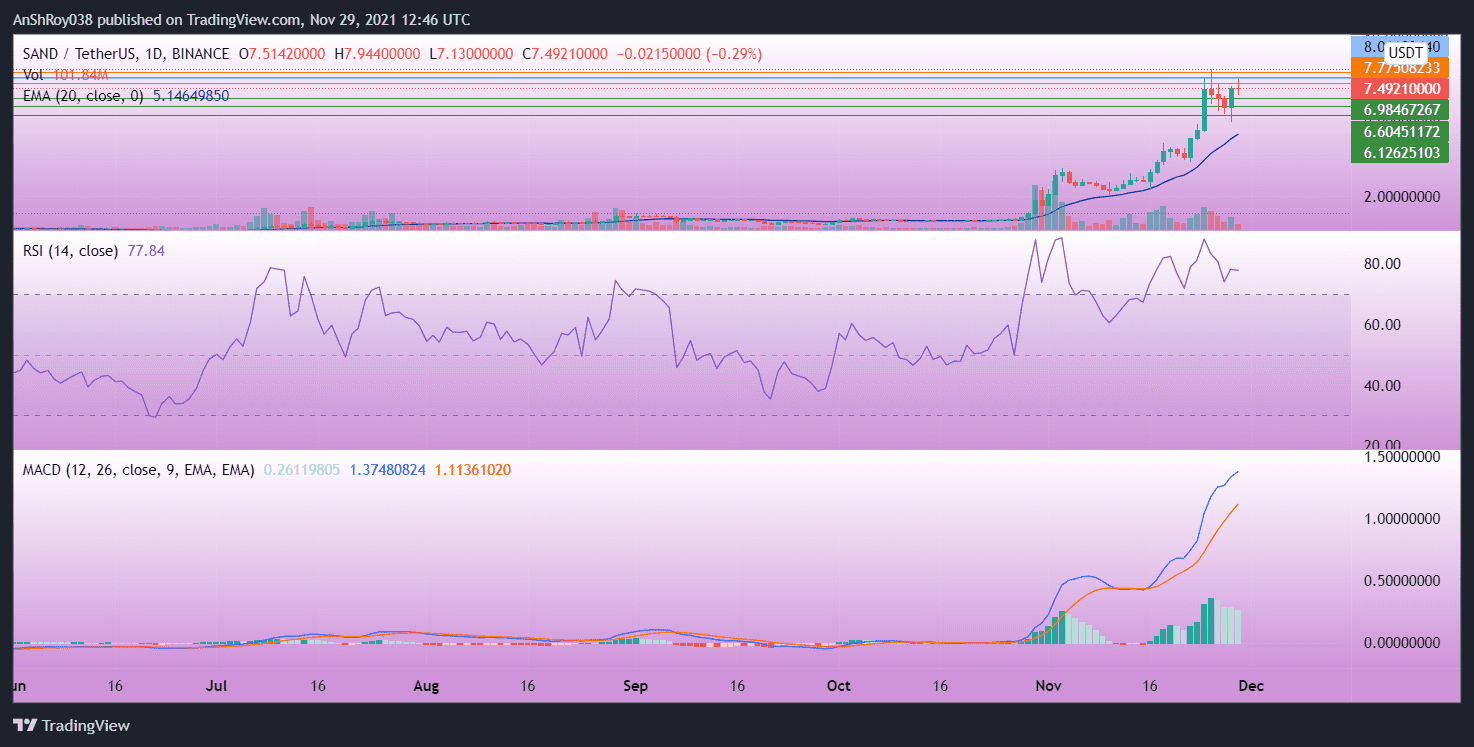
However, the bars on the MACD histogram, which plots the difference between the MACD line and its signal line, are contracting, indicating the bullish momentum forecast is losing steam. The relative strength index is in the overbought region, clocking 77.84 on the daily charts.
An RSI above 70 indicates an overbought asset, and its trend is likely to reverse soon.
At press time, SAND was trading at $7.412, up 1.17% on the day.

… [Trackback]
[…] Read More Information here on that Topic: coinchapter.com/metaverses-sand-token-enters-top-50-cryptos-list-after-rallying-87-50-in-a-week/ […]
… [Trackback]
[…] Find More here to that Topic: coinchapter.com/metaverses-sand-token-enters-top-50-cryptos-list-after-rallying-87-50-in-a-week/ […]
… [Trackback]
[…] Here you will find 84367 additional Information to that Topic: coinchapter.com/metaverses-sand-token-enters-top-50-cryptos-list-after-rallying-87-50-in-a-week/ […]