Key Takeaways:
- Solana (SOL) has painted a head and shoulders pattern that might result in a 32% drop from current prices.
- SOL token allocation, fewer nodes indicate Solana isn’t as decentralized as it claims to be.
NEW DELHI (CoinChapter.com) — Blockchain platform Solana’s native token SOL might be looking at bearish waters if a technical chart pattern holds.
In detail, SOL’s price action has formed a chart pattern called the Head and Shoulders (H&S) pattern. The pattern appears as three peaks formed above a baseline, also called neckline, where two of the outside peaks are close in height, and the middle one is the highest.

Traders often consider the H&S pattern a reliable trend reversal indicator. The price target for a breakout below the neckline equals the distance between the head and the neckline. As such, SOL prices could fall as much as 32.6% from current price levels to reach $64.2, a price level last seen in Aug 2021.
Meanwhile, SOL’s 100-day Moving Average (yellow wave) and 200-day MA (red wave) are moving to form a death cross. Solana’s 50-day MA and 200-day MA had earlier formed a death cross as Feb began.
In detail, a death cross forms when a token’s short-term moving average trendline moves below a relative long-term moving average. Traders believe the technical pattern signals negative sentiment and weakness.

If the death cross and H&S FUD start a selling spree, prices could move below immediate support at $89 to reach $83.5. Moreover, a marketwide sell-off could see support near $79 come into play unless Solana moves to target the H&S pattern’s price target.
Also Read: Solana, Cosmos, and NEAR among the week’s biggest crypto losers.The relative strength index moves almost horizontally, clocking a neutral 44.01 on the daily charts.
Solana’s MACD Paints A Bullish Crossover
Trend-based momentum oscillator MACD charted a bullish crossover for the Solana token on Feb 21.
In detail, a bullish crossover occurs when the MACD line (difference between 12-day and 26-day EMA) moves above the MACD signal line (9-day EMA of MACD). As a result, the MACD histogram, which charts the difference between the MACD and its signal line, painted a green bar for SOL.
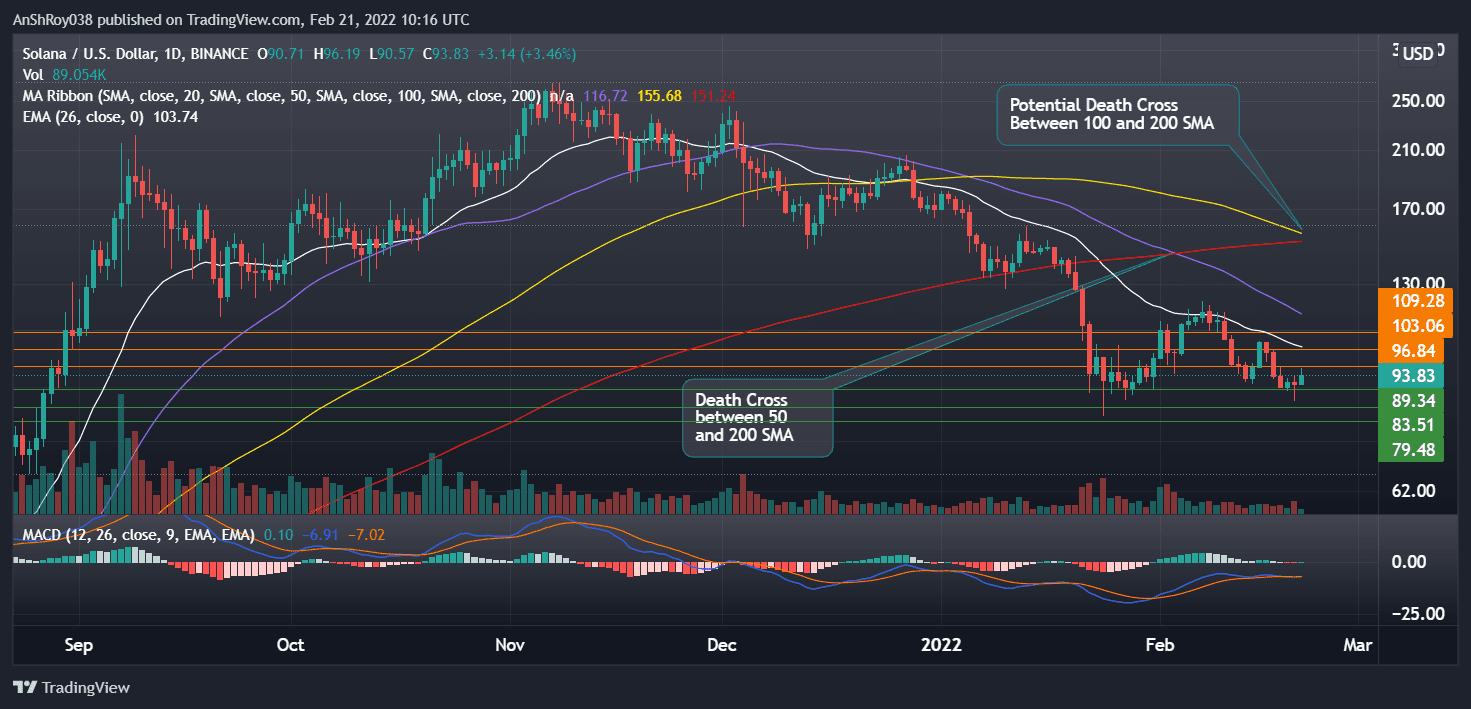
However, MACD’s bullishness seems weak, as the MACD line and its signal line are almost indistinguishable due to the recent downtrend. As such, the bullish crossover might not make a significant dent in Solana’s current bearish outlook.
If Solana starts an uptrend, the token faces resistance near the $97 price level. A sustained bullish rally might result in SOL challenging and flipping resistance near its 26-day EMA at $103.
Solana: Decentralized Or Centralized?
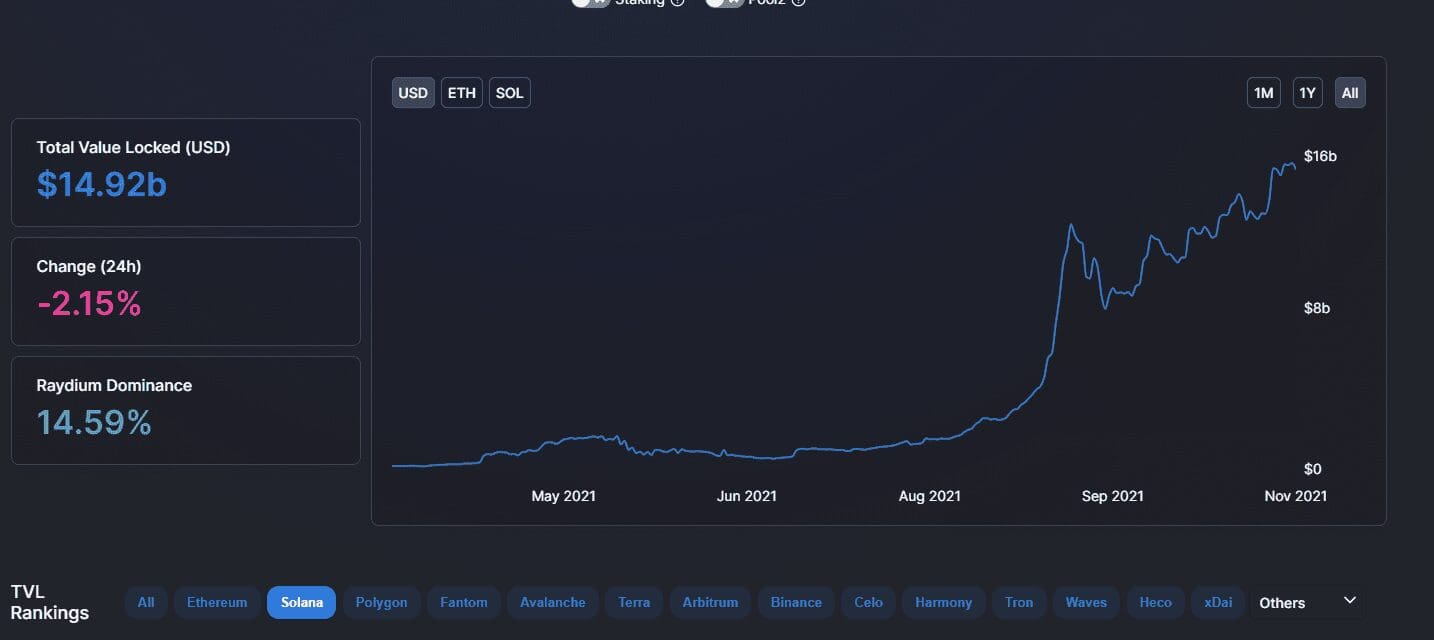
Solana claims to be a decentralized network, but the platform’s token distribution lends some doubt to its claims.
Also Read: Solana eyes explosive rally as SOL takes cues from this bullish Ethereum fractal.According to May 2021 data from blockchain research firm Messari, insiders hold nearly 50% of the platform’s native SOL token. These insiders include the Solana foundation (12.5%), developer team members (12.5%), VC investors, etc.
38% of the SOL tokens are in the community reserve fund, managed by the Solana foundation. In a decentralized network, the number of validator nodes determines the network’s security. Additionally, the number of nodes is often a measure of the decentralization of a blockchain platform.
In that context, Solana currently has 1,542 validator nodes compared to Ethereum’s 2,622 (at writing time). Fewer nodes do help Solana support a faster tps but compromises network security. Furthermore, it also means that Solana is less decentralized.
Moreover, Solana’s Nakamoto coefficient, a metric that helps gauge a blockchain’s decentralization, is 19. To put things in perspective, Bitcoin has a coefficient of 7,349, which dwarfs Solana’s score.
The lack of efficient decentralization has cost Solana, with the network experiencing three outages since Sept 2021.
At the time of writing, SOL was trading at $89, down 1% on the day.

… [Trackback]
[…] Information to that Topic: coinchapter.com/more-downside-risks-for-solana-as-sol-forms-head-and-shoulders-pattern/ […]
… [Trackback]
[…] Information to that Topic: coinchapter.com/more-downside-risks-for-solana-as-sol-forms-head-and-shoulders-pattern/ […]
… [Trackback]
[…] Read More to that Topic: coinchapter.com/more-downside-risks-for-solana-as-sol-forms-head-and-shoulders-pattern/ […]