
Key Takeaways:
- Solana (SOL) price bounced 22% in three days, breaking out of a significant resistance.
- Some technicals suggest the rally could be a bull trap.
- The digital asset’s TVL and dominane statistics back the bearish scenario.
YEREVAN (CoinChapter.com) – SOL, the in-house token of Ethereum competitor Solana, traded at $104.4 in Wednesday’s European session after a 22% rally since Feb. 28. Moreover, the digital asset cut through a significant resistance that halted the upside attempts since early Nov. 2021.
In detail, SOL charted within a pattern known as the Descending Channel. The latter constricted the price between two parallel trendlines with a negative slope. Furthermore, the setup pushed the price down, resulting in the lowest SOL value since Sep. 2021.
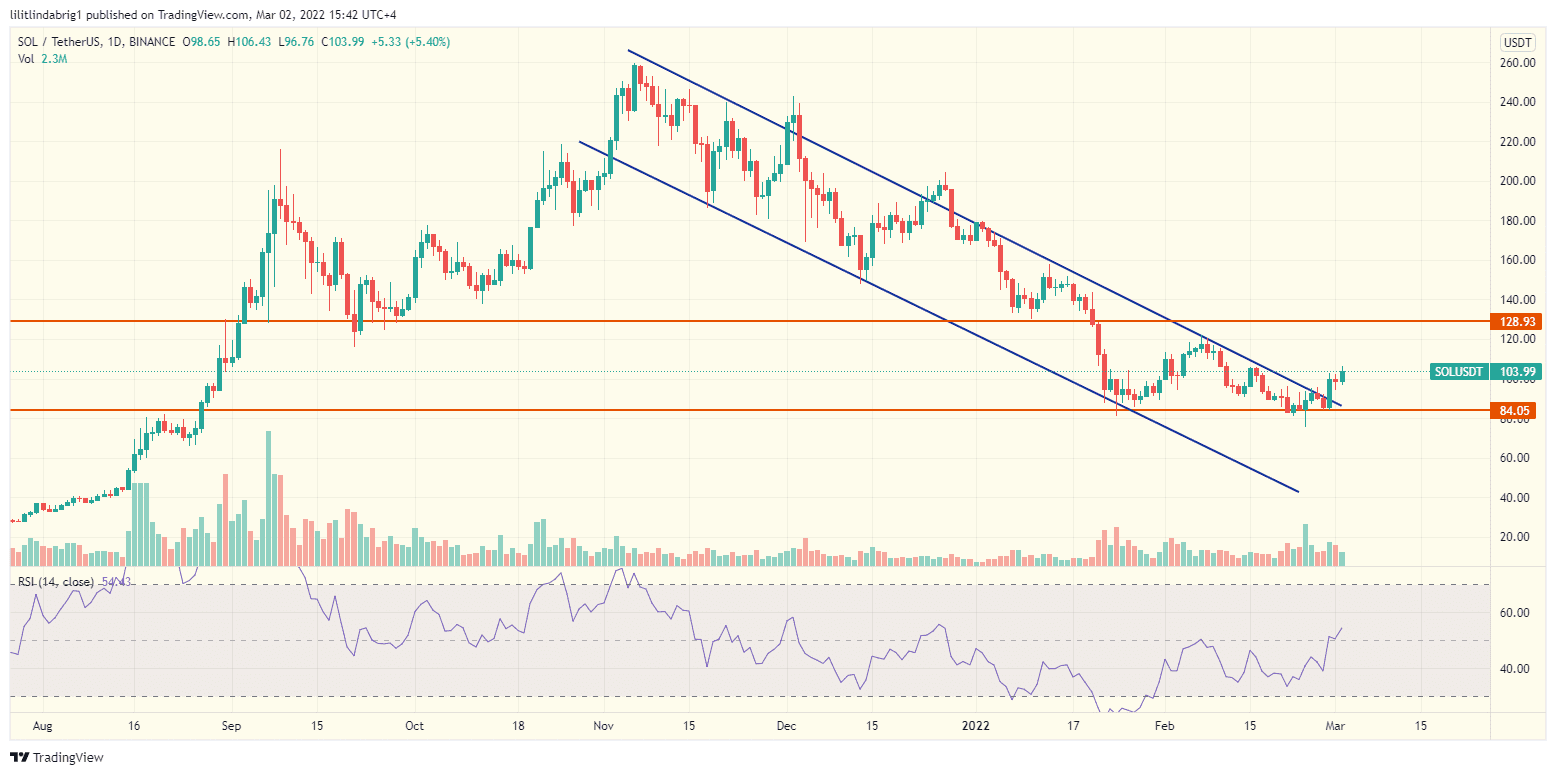
As mentioned, the digital asset powered through the resistance, possibly taking clues from Bitcoin, which bounced 18% in the same period. In detail, the Descending Channel does not predict a bias after the breakout. Thus, SOL’s vector no longer depends on the formation.
Also read: More downside risks for Solana as SOL forms head and shoulders pattern.The digital asset’s relative strength index (RSI) rose to 53, meaning high return expectations from traders. But the simultaneous decline in trading volume sings a bearish tune and suggests that the upside move might not have enough merit to sustain itself.
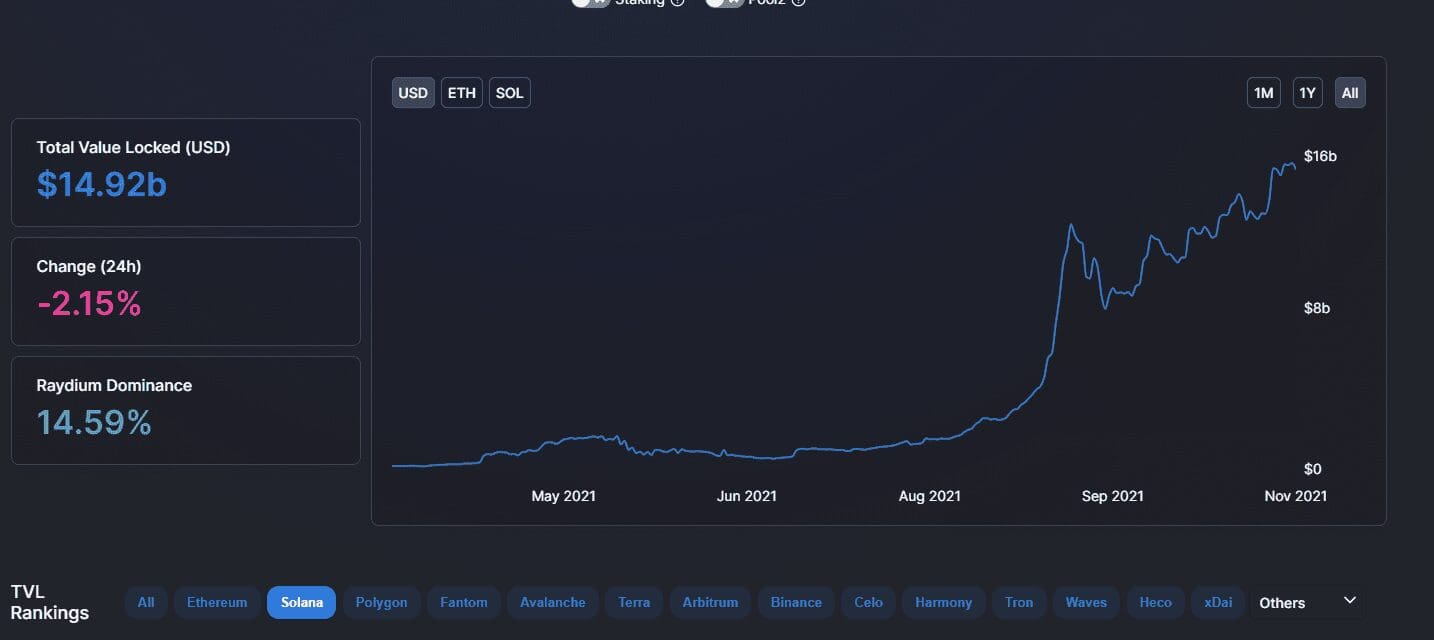
Additionally, Solana’s total value locked (TVL) and share on the DeFi market back the forecast.
Is Solana’s rally a bull trap?
Some on-chain metrics suggest that the latest bounce in SOL price does not reflect future gains. If so, the rally could be a bull trap, i.e., a false bullish move amid a broader bearish bias. In detail, Solana’s TVL stood over $211 billion on Mar. 2, a 17.5% decline from Dec. 1.

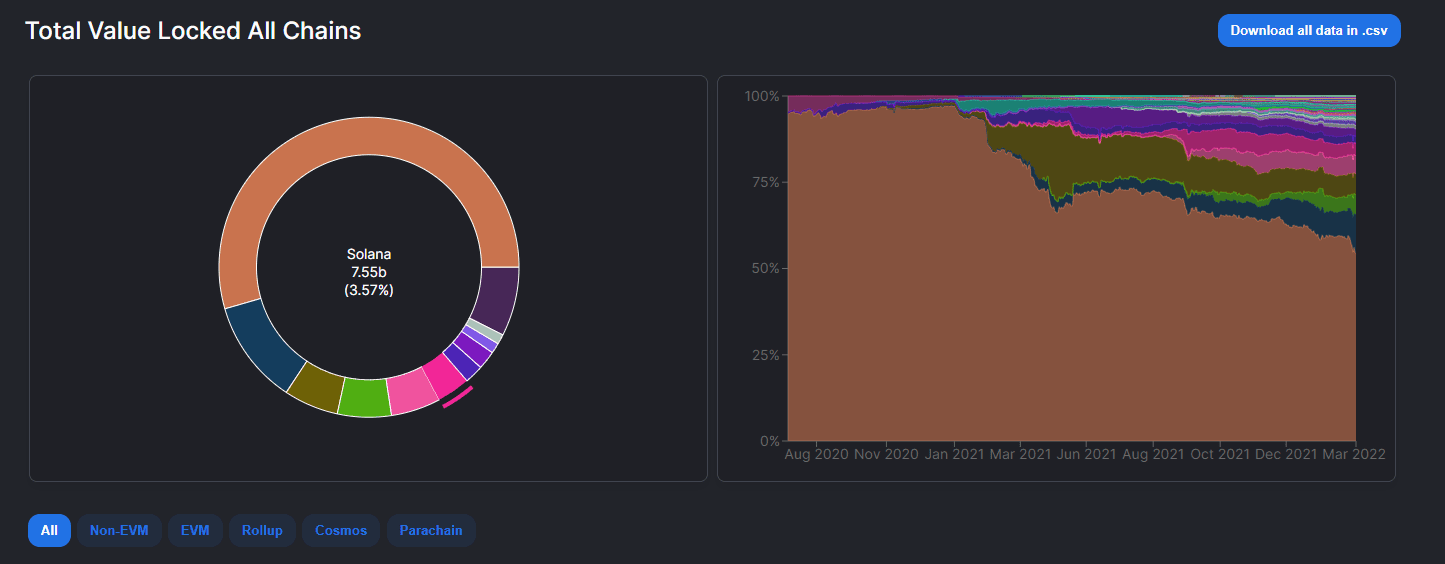
In detail, the overall crypto market decline could excuse the TVL shortage. However, Solana’s DeFi market dominance has been dropping as well. Platforms like Terra, Fantom, and Avalanche have increased their presence on the market, but Solana nearly halved its dominance in 4 months.
The Ethereum rival went from 6.15% on Nov. 4 to 3.58% on Mar. 2 and took 6th place in the TVL ranking.
Also read: Solana, Cosmos, and NEAR among the week's biggest crypto losers.The on-chain metrics mentioned above, combined with the declining trading volume, suggest that the SOL rally is short-lived. However, the digital asset also depends on Bitcoin and the crypto market at large. Thus, the upcoming sessions will show if the SOL bulls can win against the odds.

… [Trackback]
[…] Here you will find 8857 more Info to that Topic: coinchapter.com/sol-gains-22-in-3-days-abandoning-a-bearish-setup-comeback-rally-or-bull-trap/ […]
… [Trackback]
[…] Here you can find 85114 additional Information on that Topic: coinchapter.com/sol-gains-22-in-3-days-abandoning-a-bearish-setup-comeback-rally-or-bull-trap/ […]