Key Takeaways:
- S&P 500 is at a low point.
- Investor’s closely watching the Federal Reserve determine the inflation level.
- Seasonal patterns for September work against bullish traders.
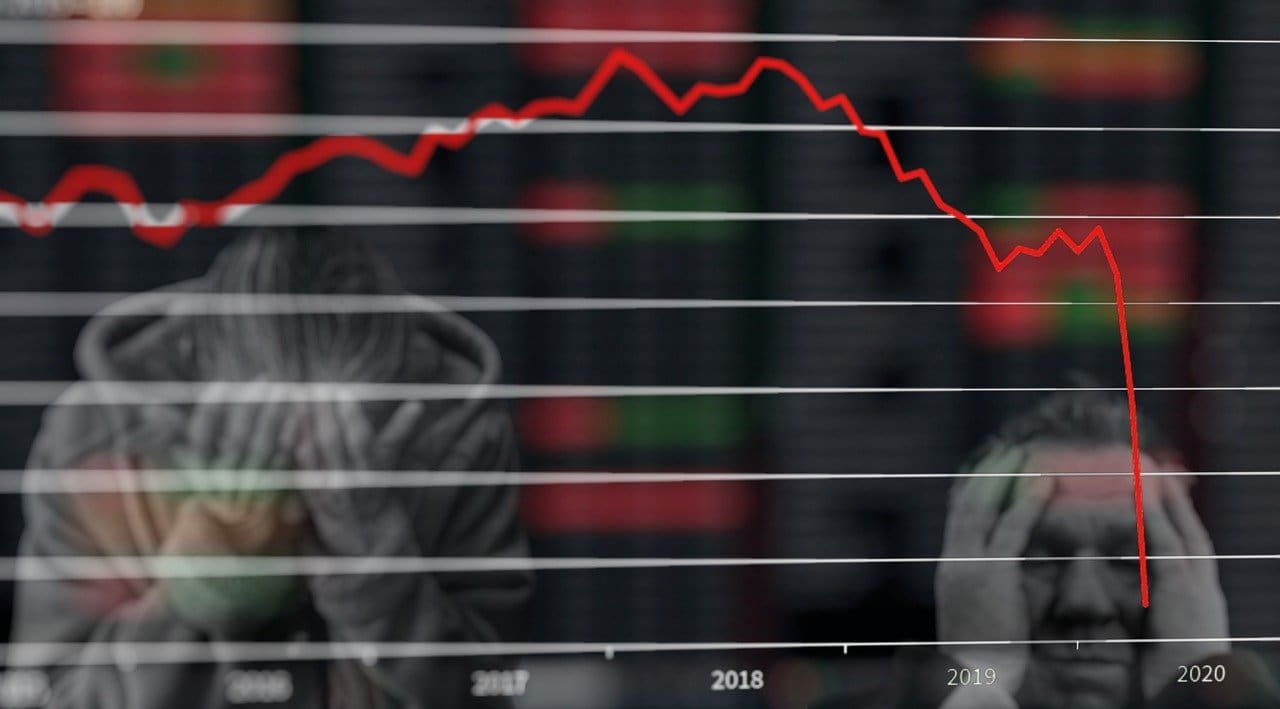
The S&P 500 Index ended August dipping to its lowest point since July 27, closing under the 4,000-mark, down over 17% year-to-date (YTD).
It was not all bad, though, as the year began strong with a January high of 4,796.56. Then, on May 9, the S&P 500 fell below 4,000 for the first time. But since then, buyers have struggled.

Stocks fell this month as investors are weighing the Federal Reserve’s resolve to curb inflation.
The first half of the month was respectable, but as the days wore on, investors became jittery because Fed speakers continued to bounce back and forth as they discussed a 50 bps or 75 bps interest rate increase.
Recession or No Recession?
Investors want to know if the U.S. is heading towards a recession or not.
Federal Reserve Chairman Jerome Powell said earlier in the month at Jackson Hole, WY, that the Central Bank will do everything necessary to fight inflation (by raising interest rates). As a result, financial markets were counting on limited rate increases after experiencing four already.
With more increases likely to come, that seems to signal recession worries.
Paul Christopher, head of global market strategy at Wells Fargo Investment Institute, said this past Tuesday:
“Stressed households are running out of resources.” Mr. Christopher added, “Even beyond limited savings and credit, falling equity market prices limit households’ ability and willingness to convert paper profits into cash.”
The U.S. labor market reported that job openings were up for the first time in four months, but employee turnover remains too high at 4.2 million.
Seasonal Patterns for September Often Do Not Favor Bull Traders
What may work against stock market traders are seasonal patterns. Historically, September has good liquidity, but as policymakers return after the lighter traded summer months, it highlights some key repeated patterns:
- Over the past 20 years, September has been the second worst month for the Deutscher Aktien Index (or GER40). However, please note that although this is a bad month for the DAX, the following three months are typically strong.
- Natural gas begins a strong seasonal run, but WTI crude oil is usually weak. As a result, September is the worst month for the S&P 500 and the second worst for the Nasdaq.
- In the precious metals sector, silver had its second-worst month in September.

… [Trackback]
[…] Find More to that Topic: coinchapter.com/sp-500-september-slump-scares-market-amid-recession-fears/ […]
… [Trackback]
[…] Here you can find 69851 more Info to that Topic: coinchapter.com/sp-500-september-slump-scares-market-amid-recession-fears/ […]
… [Trackback]
[…] There you will find 85783 more Info on that Topic: coinchapter.com/sp-500-september-slump-scares-market-amid-recession-fears/ […]
… [Trackback]
[…] Read More Info here on that Topic: coinchapter.com/sp-500-september-slump-scares-market-amid-recession-fears/ […]
… [Trackback]
[…] Information to that Topic: coinchapter.com/sp-500-september-slump-scares-market-amid-recession-fears/ […]
Четкое деление косметики бренда на линии, решающие конкретные проблемы, отсутствие путаницы в выборе ухода
Большое разнообразие выгодных и красивых подарочных наборов
С момента основания и до наших дней компания неизменно сохраняет дух своей основательницы Кармен
… [Trackback]
[…] Info to that Topic: coinchapter.com/sp-500-september-slump-scares-market-amid-recession-fears/ […]
… [Trackback]
[…] Info to that Topic: coinchapter.com/sp-500-september-slump-scares-market-amid-recession-fears/ […]