
YEREVAN (CoinChapter.com) – The stock market kicked off Q2 2022 with seven consecutive bearish weeks, declining 15%. Moreover, Michael Harris, an analyst, pointed to a new batch of losses ahead for equities, citing several crucial indicators.
#1 Declining ‘Buy The Dip’ indicator
‘Buy The Dip’ indicator reflects the market’s tendency to rebound after losses. It is the percentage of bearish days followed by bullish days in a rolling 252-day period. The chart below represents the correlation between the said indicator and Standard & Poor’s Depositary Receipts trust (SPDR S&P 500 ETF), the largest ETF in the world.
In short, the indicator’s peak represents a profitable market entry. Conversely, when ‘buy the dip’ drops, traders can expect a market decline and ‘sell the rips.’
Also read: More troubles ahead for Bitcoin (BTC) & cryptos as cash holdings go up.
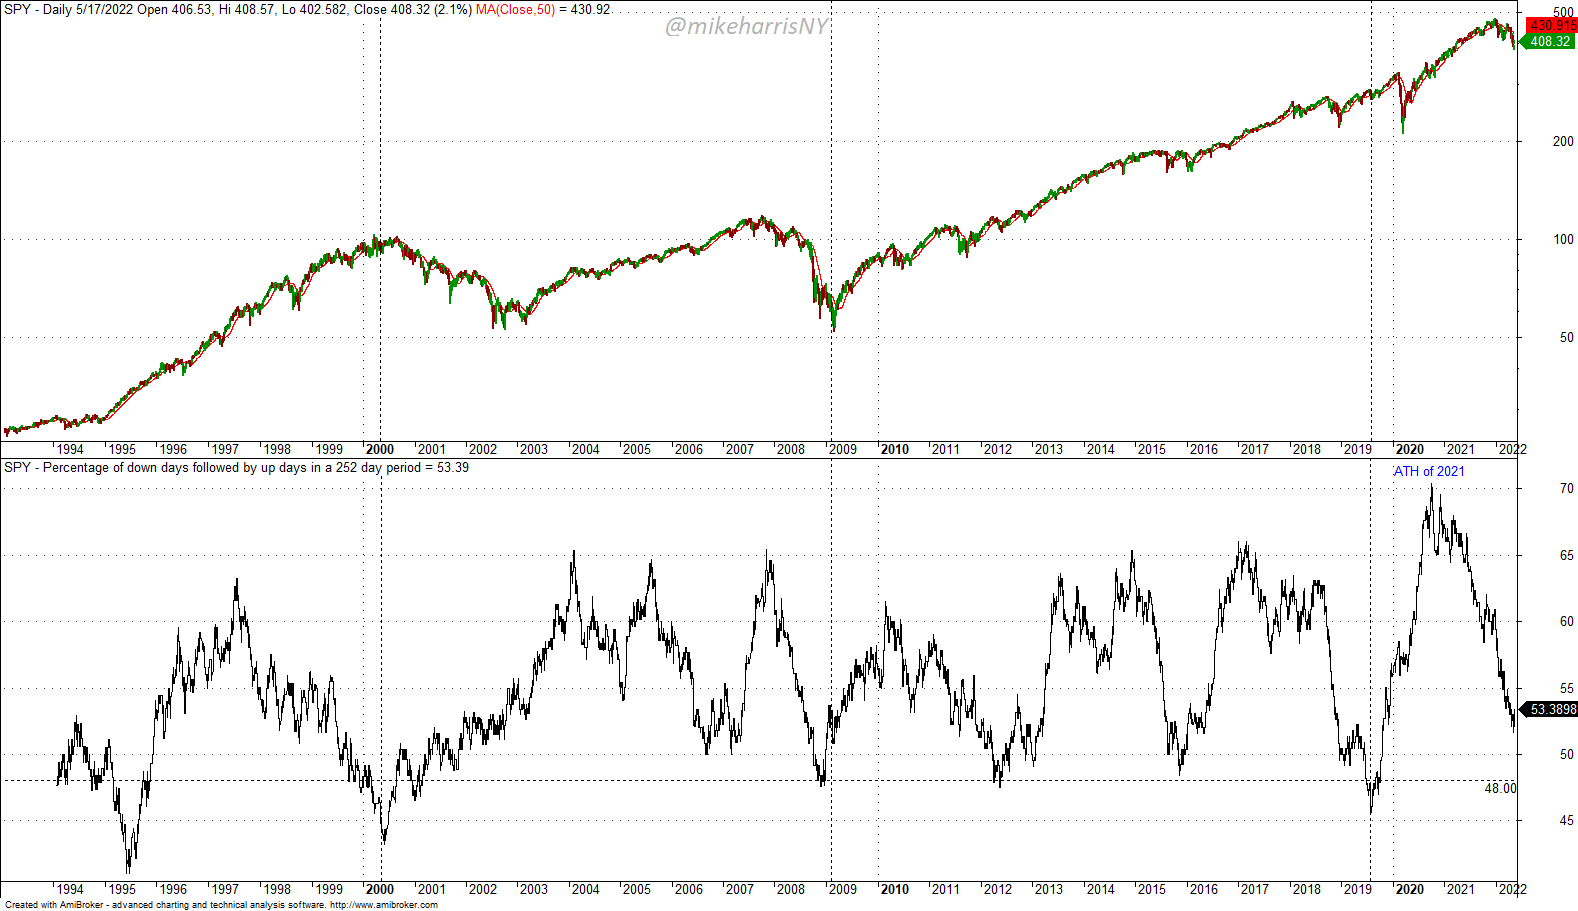
The chart clearly shows that the indicator’s dips below 50 historically coincided with market declines. Thus, Harris warned that the current drop towards the said margin throws bearish hints at traders.
#2 NASDAQ-100 to DOW-30 ratio near its peak
The expert also pointed out that NASDAQ-100 to DOW-30 ratio is an “interesting” factor in his research but not a definitive one. Thus, it can be useful when combined with other indicators.
In detail, DOW-30 (DJI) is a stock market index that tracks U.S. stock market performance and is commonly referred to as the “Dow” or the “Dow Jones Industrial Average.” The index reflects the combined stock price of 30 large, publicly-traded companies influential in the U.S. economy.
Meanwhile, NASDAQ-100 is a similar market index. It tracks equity securities issued by 100 of the largest non-financial companies listed on the Nasdaq stock market.
Also read: Experts warn of recession as global inflation goes over the roof.
The chart below reflects the NASDAQ-100 to DOW-30 ratio and its correlation with the NASDAQ-100 performance (1986-2022). Harris described the bear market between 2000 and mid-2002, pointing out that NASDAQ-100 experienced an 83% drawdown. At the same time, the NASDAQ-100/DOW-30 ratio plunged to 0.11 after topping off near 0.47.
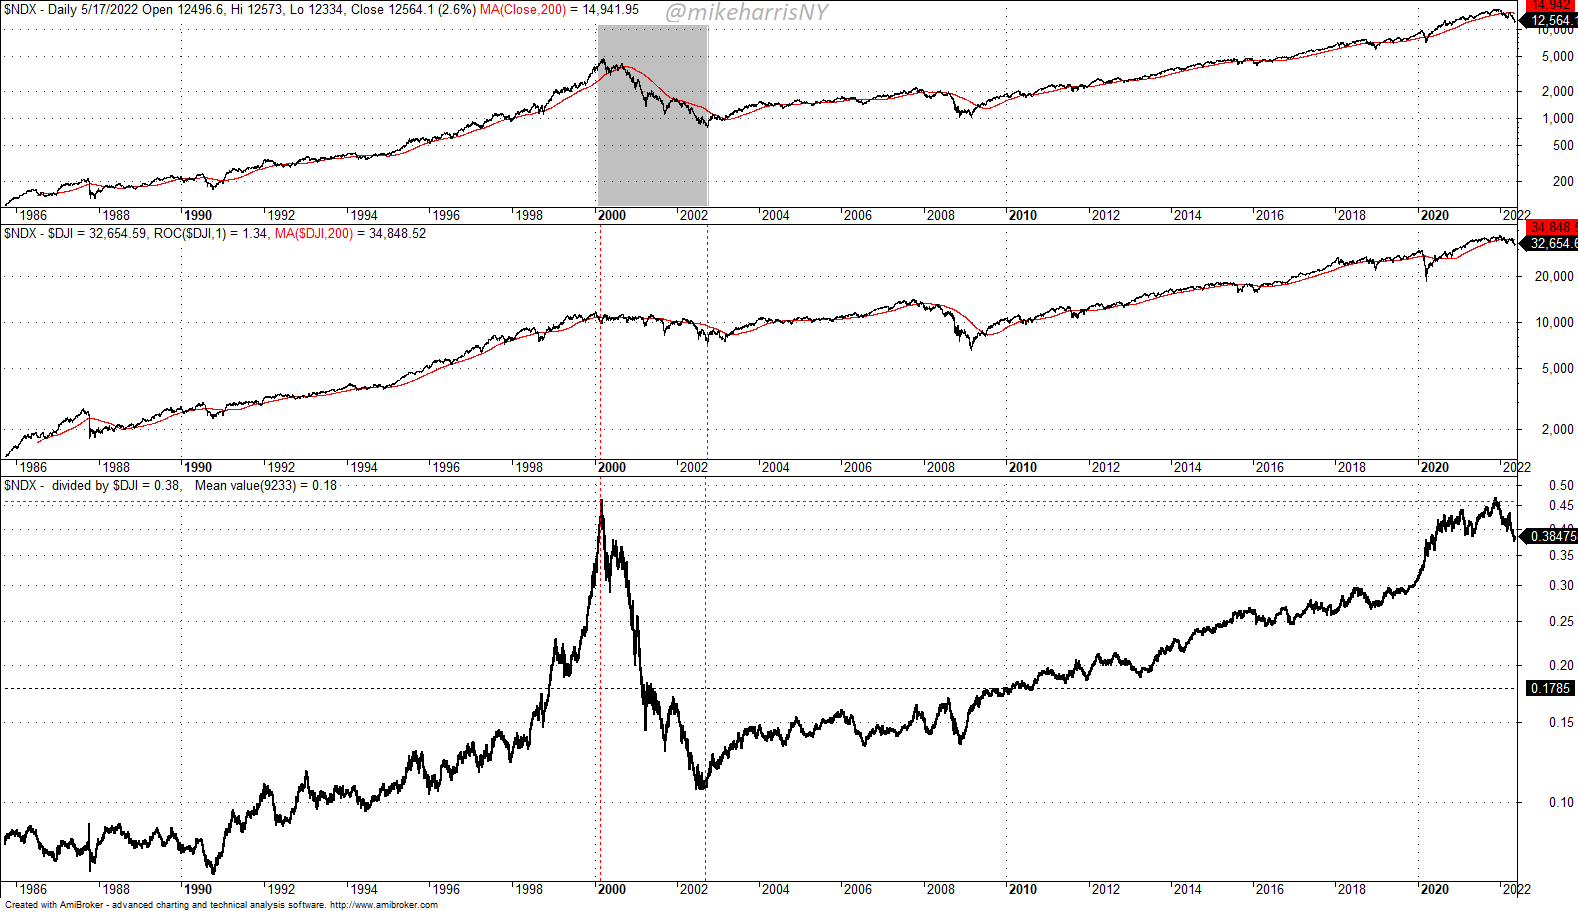
On a separate occasion, in late 2021, the ratio peaked near the same level. Soon after, the correction in tech stocks started. Thus, the recent top near the 0.47 margin ratio could also mean a looming drawdown.
#3 Tech stock’s reversion to the mean
Before describing the third reason behind the bearish outlook on stocks, it is important to clarify the definition of Mean Reversion.
Mean Reversion is a theory in finance. It assumes that an asset’s price eventually reaches its average over time. I.e., an overvalued asset will correct to match the average price. Similarly, an undervalued asset will also tend to converge to the mean.
Also read: Tether's $9B loss is arch stablecoin rival USDC's gain.Harris points out that the tech market experienced irrational exuberance in 2020-2021 due to excessive stimulus during the pandemic. As a result, the NASDAQ-100 rose significantly above its one-standard deviation channel (blue and red lines). The channel reflects the ‘spread’ of an asset’s price, or how much it varies from the average.
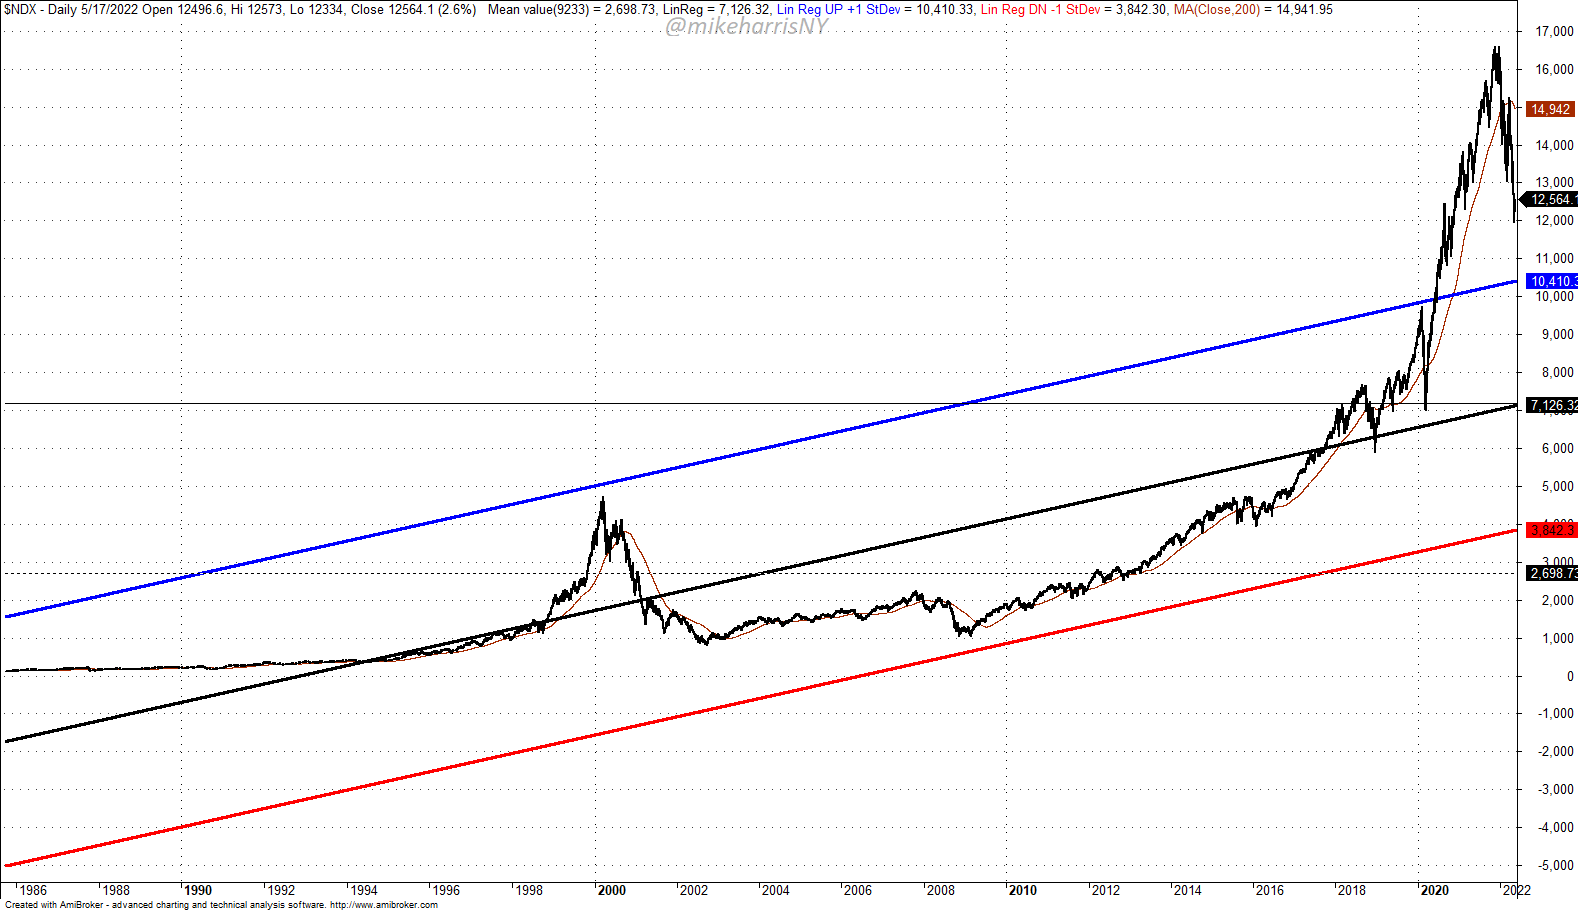
In a nutshell, the chart claims that as the NASDAQ-100 shot above the said channel, it will eventually regress to the mean (the black middle line). Notably, a drawdown to the average would represent a devastating 44% drop for the stock market.
Also read: Tesla, the so-called 'crypto exposure' stock, risks crashing —Experts. The three reasons separately do not give definitive predictions on the stocks’ upcoming bias. However, together they point to more turmoil for equities until the stimulus excesses clear out from the market.

… [Trackback]
[…] Find More Info here on that Topic: coinchapter.com/stock-market-selloff-is-far-from-over-3-reasons-why/ […]
… [Trackback]
[…] Information on that Topic: coinchapter.com/stock-market-selloff-is-far-from-over-3-reasons-why/ […]
… [Trackback]
[…] Here you will find 21432 more Info on that Topic: coinchapter.com/stock-market-selloff-is-far-from-over-3-reasons-why/ […]
… [Trackback]
[…] Here you can find 91360 more Information to that Topic: coinchapter.com/stock-market-selloff-is-far-from-over-3-reasons-why/ […]
… [Trackback]
[…] There you can find 4711 more Information on that Topic: coinchapter.com/stock-market-selloff-is-far-from-over-3-reasons-why/ […]
… [Trackback]
[…] Find More on that Topic: coinchapter.com/stock-market-selloff-is-far-from-over-3-reasons-why/ […]
… [Trackback]
[…] Info on that Topic: coinchapter.com/stock-market-selloff-is-far-from-over-3-reasons-why/ […]
… [Trackback]
[…] Find More on on that Topic: coinchapter.com/stock-market-selloff-is-far-from-over-3-reasons-why/ […]