

Key Takeaways:
- SUSHI price rallied over 20% on July 17, likely riding news of new partnerships.
- However, the SushiSwap token continued moving inside a bearish technical setup.
NEW DELHI (CoinChapter.com) — Decentralized exchange SushiSwap’s recent updates seem to have helped its native token, SUSHI, register a 20% spike in prices on July 17.
The DEX recently partnered with a “multi-chain liquidity mapping” platform Shared Liquidity Box. In a Twitter post, the liquidity-sharing platform claimed it was a “game-changing solution” that would revolutionize multi-chain liquidity mapping.
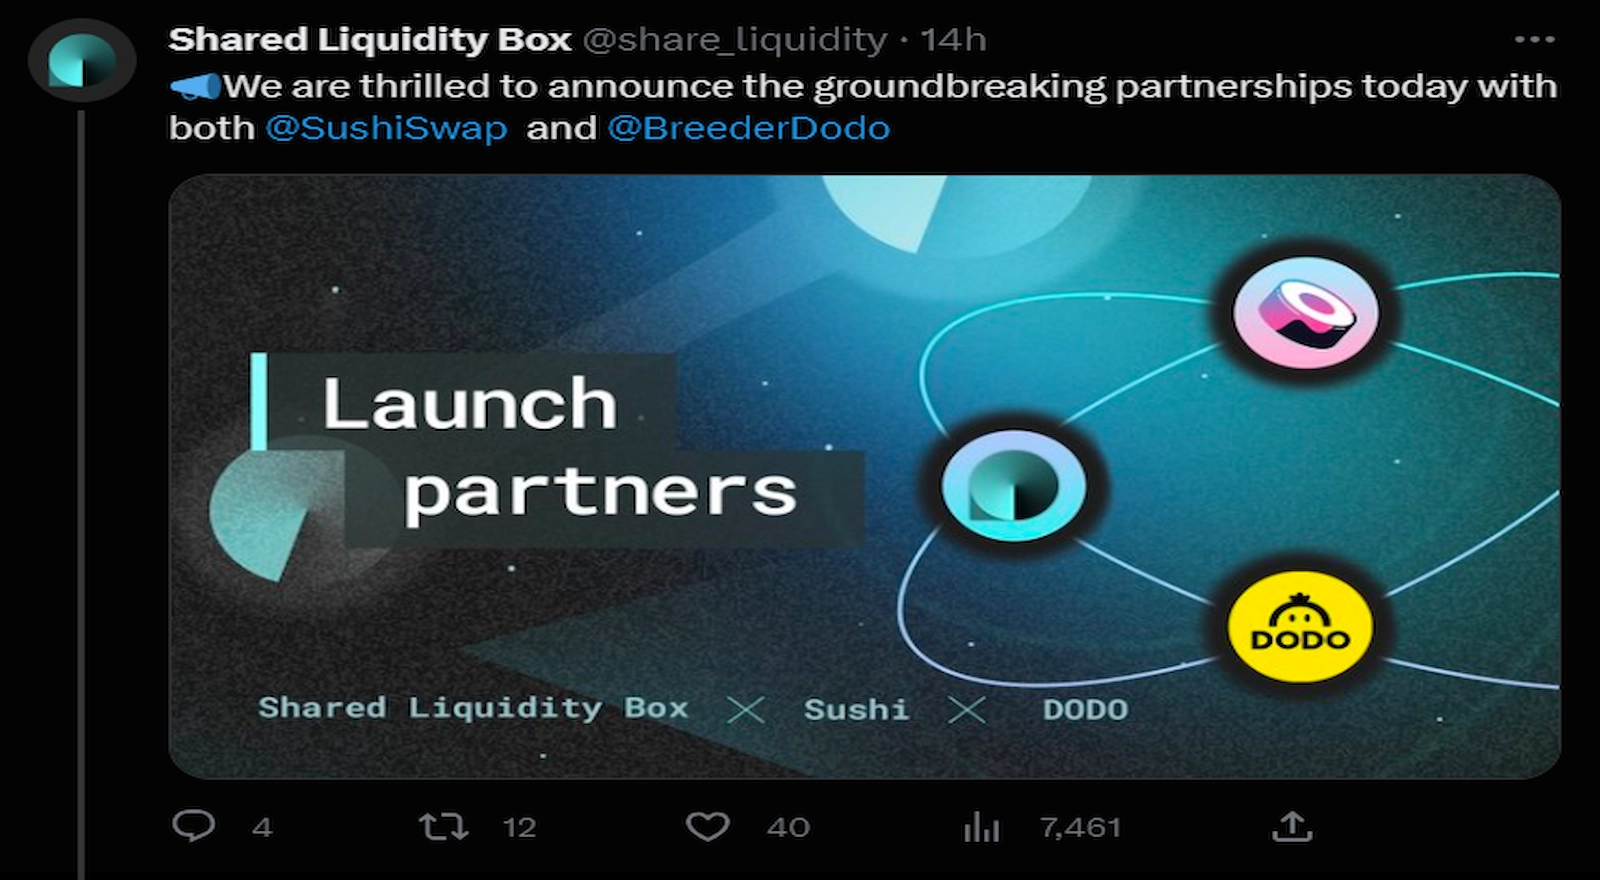
The partnership would allow SushiSwap users to use liquidity in the original chain to farm on multi-chains. As a result, users’ principal investment would remain safe while they explore additional revenue options.
Furthermore, SUSHI’s concentrated liquidity pools are available to users on Ethereum, Arbitrum, Optimism, and Polygon blockchain platforms. On the Ethereum network, the SUSHI/ETH pair offered the highest APR, while the same pair came in second in terms of APR on the Optimism blockchain.
Additionally, market sentiment about the SushiSwap token’s price prospects seems to be leaning in favor of the bulls. Several traders noted SUSHI’s recent gains, speculating a $0.9 price level for the token.
Another user noted that the “36-month-long DeFi bear market must truly be over” in light of SUSHI’s recent price action.
SUSHI Price Moving Inside A Bearish Pattern
Meanwhile, the SushiSwap token’s price has formed a bearish technical pattern aptly named the ‘Bear Flag.‘
In detail, the pattern forms when a cryptocurrency’s prices chart a sharp countertrend (the flag) after a short-lived trend. Flag patterns usually indicate a reversal of the countertrend. In addition, in a bearish pattern, volume might not always decline during consolidation.
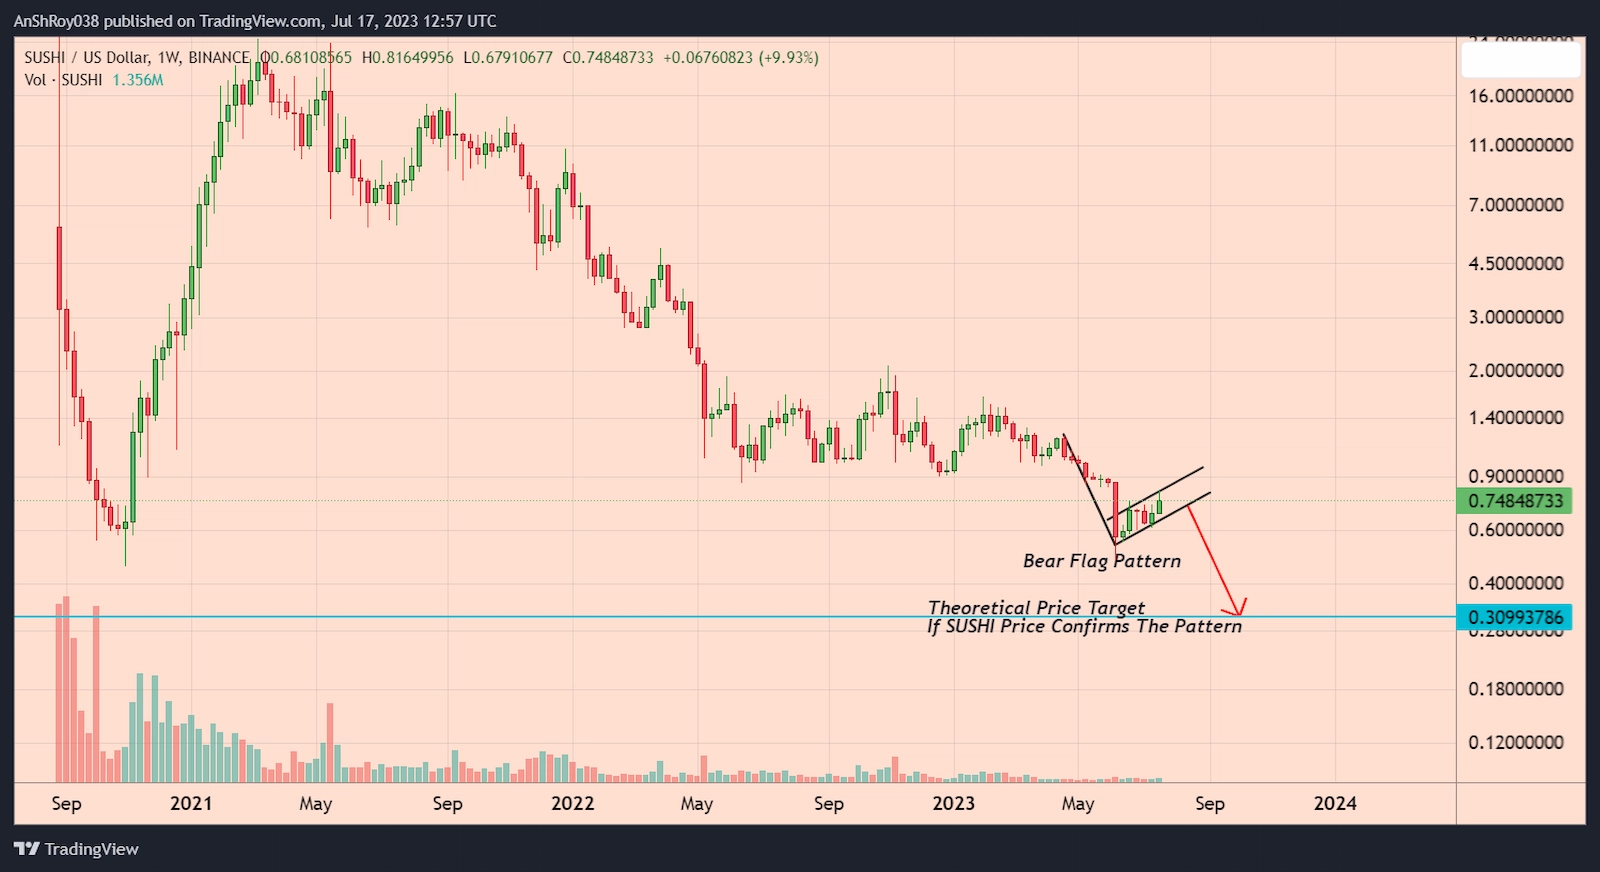
Since an uptrend marks the consolidation period after a sharp downtrend, investors move in due to FUD from the price fall. Hence, higher-than-average volumes often accompany the consolidation period.
Traders calculate the bear flag pattern’s price target by subtracting the flagpole’s length from the breakout price level. Hence, if the flag pattern pans out, SUSHI price could drop nearly 59% to reach $0.309 before recovering.
SushiSwap Bears Lose 50EMA, Now Defending 100EMA
The SushiSwap token price broke above the 50-day EMA (purple wave) trendline resistance on July 17 after spiking over 20% to a daily high of $0.816. Recent SUSHI price’s daily candle’s long upper wick indicates bears were aggressively defending the 50-day EMA level.
After losing the trendline resistance to the bulls, bears seem to be amassing near the 100-day EMA (blue wave) resistance near $0.813. Bulls would need to break and consolidate above the immediate resistance to infuse confidence in SUSHI price action before targeting the resistance near $0.88.
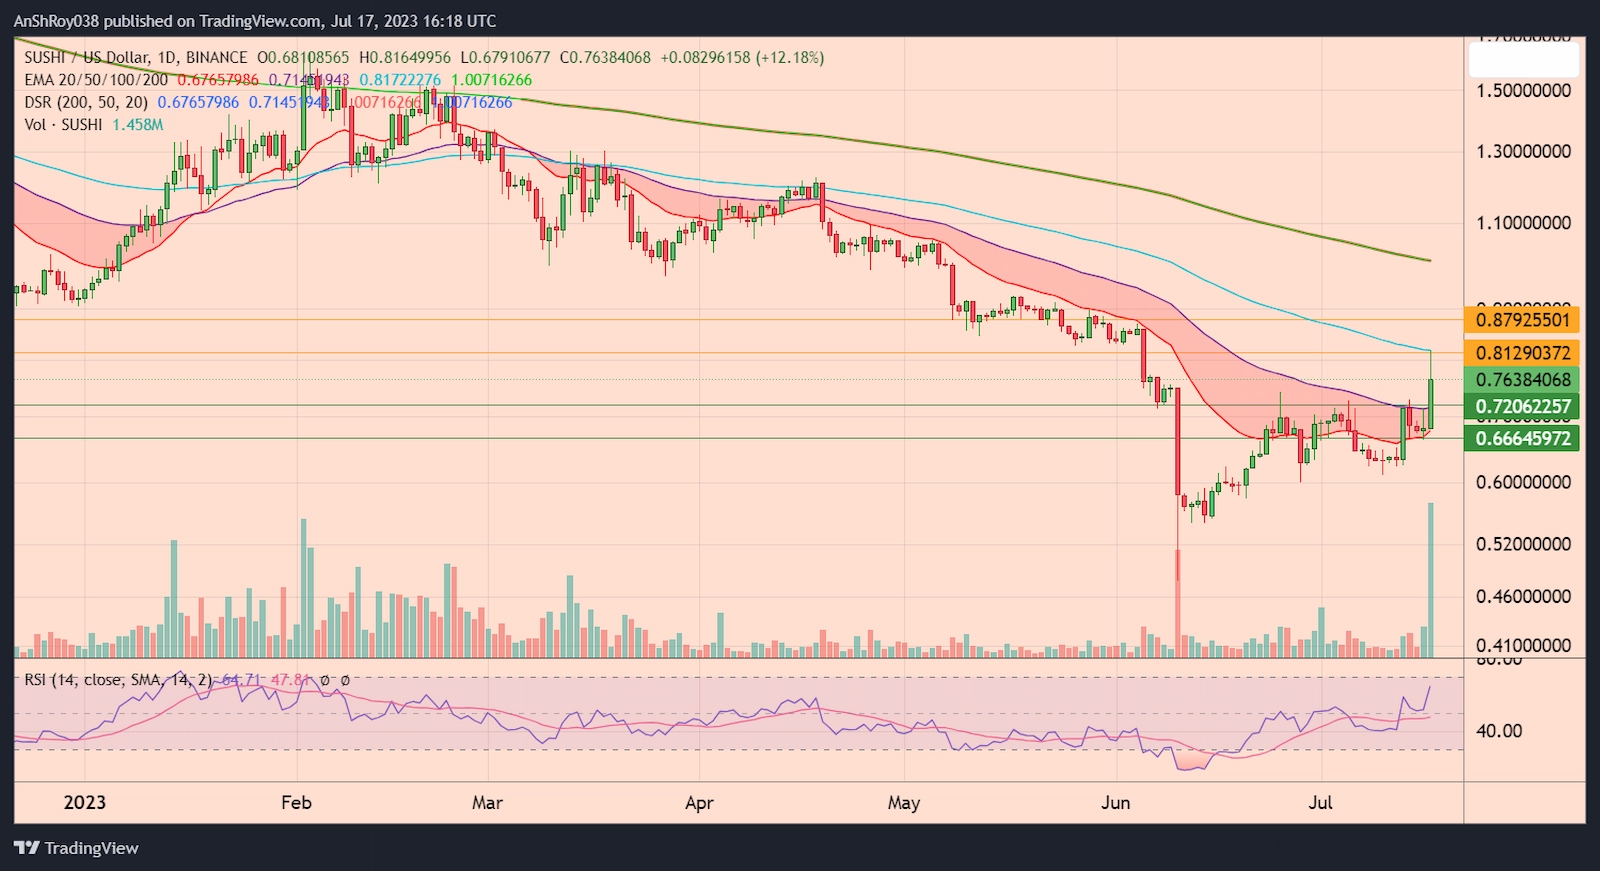
Conversely, if bears succeed in halting the SUSHI price’s rally, bulls will try to stall the downtrend near the 50-day EMA support near $0.721. Failure of the immediate support level might force the SushiSwap token price test the 20-day EMA (red wave) support near $0.666 before recovering.
The RSI for SUSHI remained neutral, albeit close to the overbought range, clocking at 64.71 on the daily charts.

