

- Bitcoin exchange reserves increasing and close to pre-May 19 dump levels
- Rapid profit-taking in BTC/USD derivate reserves
- An uptick in stablecoins parked on exchanges
JAIPUR (Coinchapter.com) – By posting a 6% jump from $29,500 to $31,400, Bitcoin broke out of the bearish abyss on July 21. But on-chain analysis presents a bearish picture for the flagship cryptocurrency in the short term.
According to Canadian on-chain analyst El Crypto Tavo, a decline in BTC/USD spot rates is just around the corner. Tavo, an author with Korean on-chain analytics firm CryptoQuant, confirmed his bearish bias based on three indicators:
- Bitcoin spot deposits on crypto exchanges, which has reached levels last seen before the May crypto crash
- Profit booking by BTC/USD derivative traders
- The rate of stablecoin deposits on digital asset exchanges
Let’s take a look at them individually.
Spot Bitcoin Reserves Increasing

Bitcoin’s flip below the $30,000 support caught many traders/investors off-guard. Tavo found out that the selloff was a function of the rising Bitcoin deposits on crypto exchanges in his on-chain observation. Spot BTC reserves rose to the level not seen since the cryptocurrency market drawdown in May.
At first, the rate of deposits was gradual, rising steadily during the noon trading sessions. Spot exchange reserves spiked later during the day when BTC/USD spot rates tumbled below $30,000. The surge was immediate. Crypto exchanges went from holding 1.16 million Bitcoins to 1.19 million BTC in a matter of few hours. The number kept going north with falling Bitcoin spot rates.
Related: Bitcoin price may drop to the $24k-$29k range if this technical setup plays out.
But who/which group of folks triggered such a large Bitcoin selling order? Crypto market intelligence providing firm IntoTheBlock hinted that it’s not the long-term holders. “Certainly, it hasn’t been long-term holders as the number of addresses holding >1 year has been growing consistently over the past 12 months”, said IntoTheBlock.
Only medium-term and short-term holders bought Bitcoin 3-6 months ago, makeup for Bitcoin’s current selling pressure. Short-term holders would look to exit their positions at any sign of a downturn, unlike long-term-holders who are in for the long haul.
Related: Bitcoin HODling: What do Realised Cap HODL waves say about it?
“Moreover, the In/Out of the Money analysis reveals that the majority of the long-term holders are still in a state of profit. 68.27% of the addresses currently holding BTC are still “in the money,” meaning that these investors are in for the long-term and haven’t been shaken out,” noted IntoTheBlock
Derivative Traders Booking Profits
Bitcoin derivative traders closing trades and exiting their positions is also a short-term bearish signal, Tavo noted. According to the on-chain analysis that the CryptoQuant analyst published, the recent Bitcoin selloff forced futures and options traders to close their active contracts and book profits.
Due to the same Bitcoin derivative volumes dipped from 1.32 million BTC to almost 1.31 million. Data from Skew corroborates Tavo’s observations. As per the below chart, the cryptocurrency market analytics company pointed out a decline in aggregated daily futures volumes since June 21.
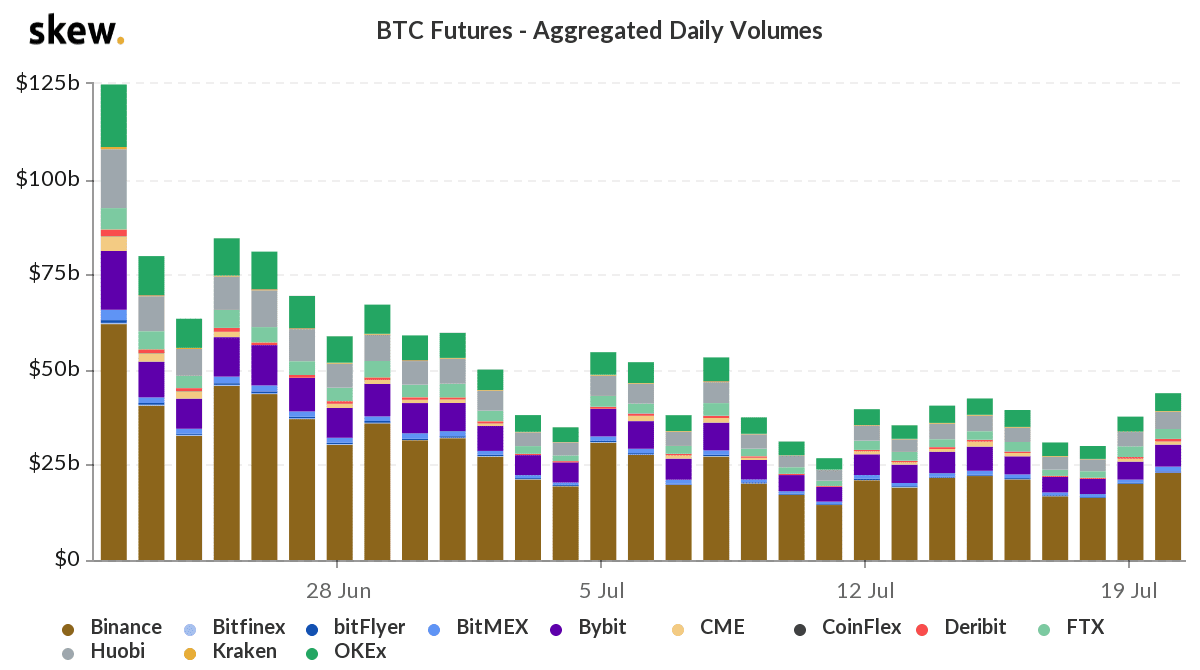
Diminished derivatives trading activity points to a trend where traders show little to no willingness to bet on the future of Bitcoin markets. Thereby inducing a sentiment of a lull.
Rise In Stablecoin Reserves
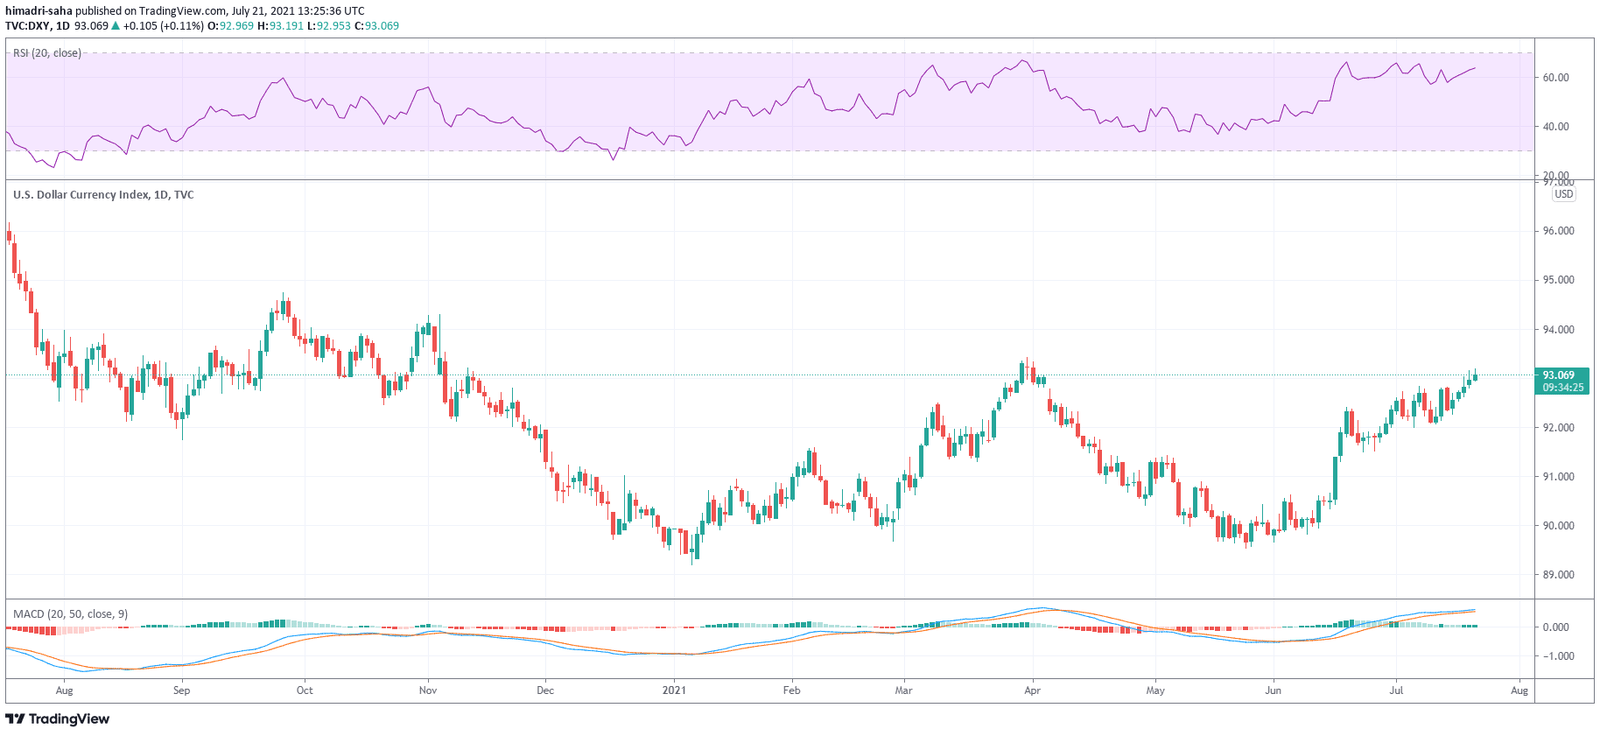
Increasing stablecoin reserves on crypto exchanges is a bearish indication, as per Tavo. It is a direct reflection of a market sentiment in which investors switch their haven perspective from crypto to the US dollar. Something which happened recently when BTC/USD prices dipped below $30,000.
And it shouldn’t come as a surprise.
The greenback has been growing from strength to strength since the US Federal Reserve announced interest rate hikes last month. From the low at 89.939 logged on June 11, the dollar index (which measures USD’s strength against major fiat currencies) charted a monstrous rally to 93.208. Long positions on the US dollar have never been higher.

… [Trackback]
[…] Find More here on that Topic: coinchapter.com/three-bitcoin-indicators-infer-bearish-moves-for-btc/ […]
… [Trackback]
[…] There you will find 65575 more Information on that Topic: coinchapter.com/three-bitcoin-indicators-infer-bearish-moves-for-btc/ […]