

NAIROBI (Coinchapter.com) – TON’s weekly price value soared, marking a near 50% increase as traders anticipated the Ton Foundation’s latest move. The trading chart for Toncoin (TON) paints a vivid picture of the cryptocurrency’s recent performance. This significant uptick in TON’s market price aligns with the foundation’s revelation of distributing $115 million worth of Toncoin.

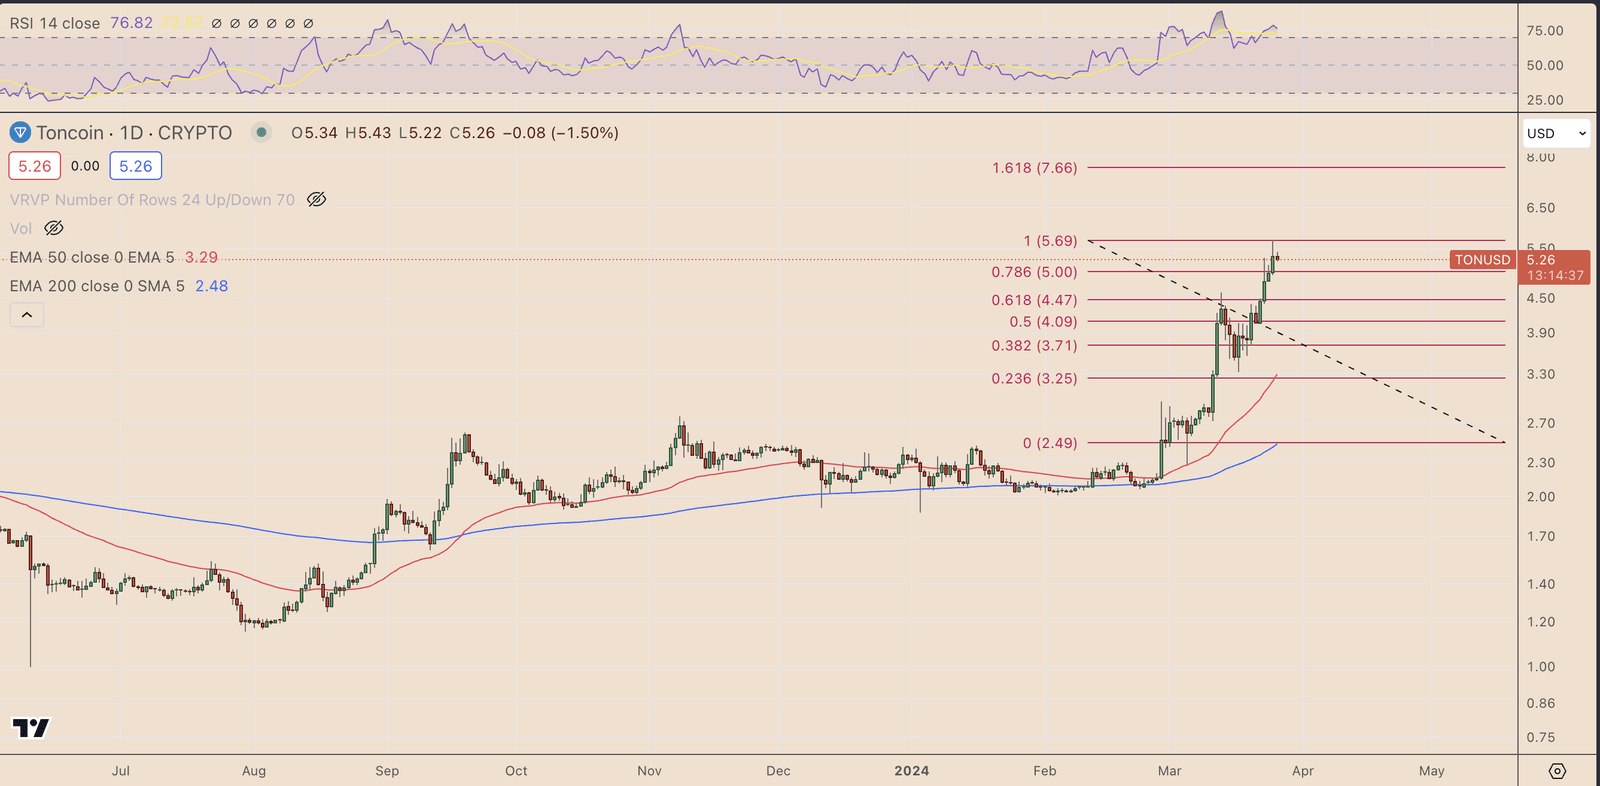
Technical indicators from the trading chart signal potential trouble ahead. The cryptocurrency’s rally has pushed RSI to a towering 77—a level well into the overbought territory, which often precedes a market pullback.
This current state of the RSI, combined with a price resistance at $5.69, suggests that TON may soon face a corrective phase. Historically, overbought conditions often trigger profit-taking and a decline in buying momentum, leading to price retracements. Should this pattern hold, TON’s price could see a pullback to support levels indicated by the Fibonacci retracement tool.
TON’s Weekly Price Surges, But Fib Levels Indicate Potential Targets
Assuming the overbought signal leads to a price correction, the Fib levels on the chart become crucial targets for TON’s pullback. The first notable level of support resides around $5.00, aligning with the 0.786 Fib level. If the correction deepens further, the price could see a descent to the 0.618 Fib level at approximately $4.47 or potentially to the 0.5 level, sitting near $4.09.
After the strong rally that pushed TON into overbought territory, the question now is whether this growth can be sustained. This is where the Fibonacci retracement levels become crucial for traders watching for a potential downturn. These support levels aren’t arbitrary numbers; they represent areas where the market has historically shown buying interest. If the current buying momentum fades, these levels could once again become zones of interest for buyers looking to step in.
A pullback could be imminent, with traders scrutinizing support levels for signs of a bounce or a deeper decline. Cryptocurrency markets are known for their volatility so any correction could be swift and substantial. This makes technical indicators like Fibonacci retracement crucial for navigating potential downturns.

… [Trackback]
[…] Find More to that Topic: coinchapter.com/tons-weekly-price-rally-reaches-50-brings-along-a-dangerous-signal/ […]