

NEW DELHI (CoinChapter.com) — The run-up to the spot Bitcoin ETF launch had traders in an uproar, with everyone expecting Bitcoin (BTC) and other cryptos to launch a massive bull run. Instead, BTC price is down nearly 21% from Jan. 11’s high of $49,000, with other major tokens joining the list of crypto losers.
The downtrend in Bitcoin prices was likely a classic case of the ‘buy the rumor, sell the news’ trading mechanism.
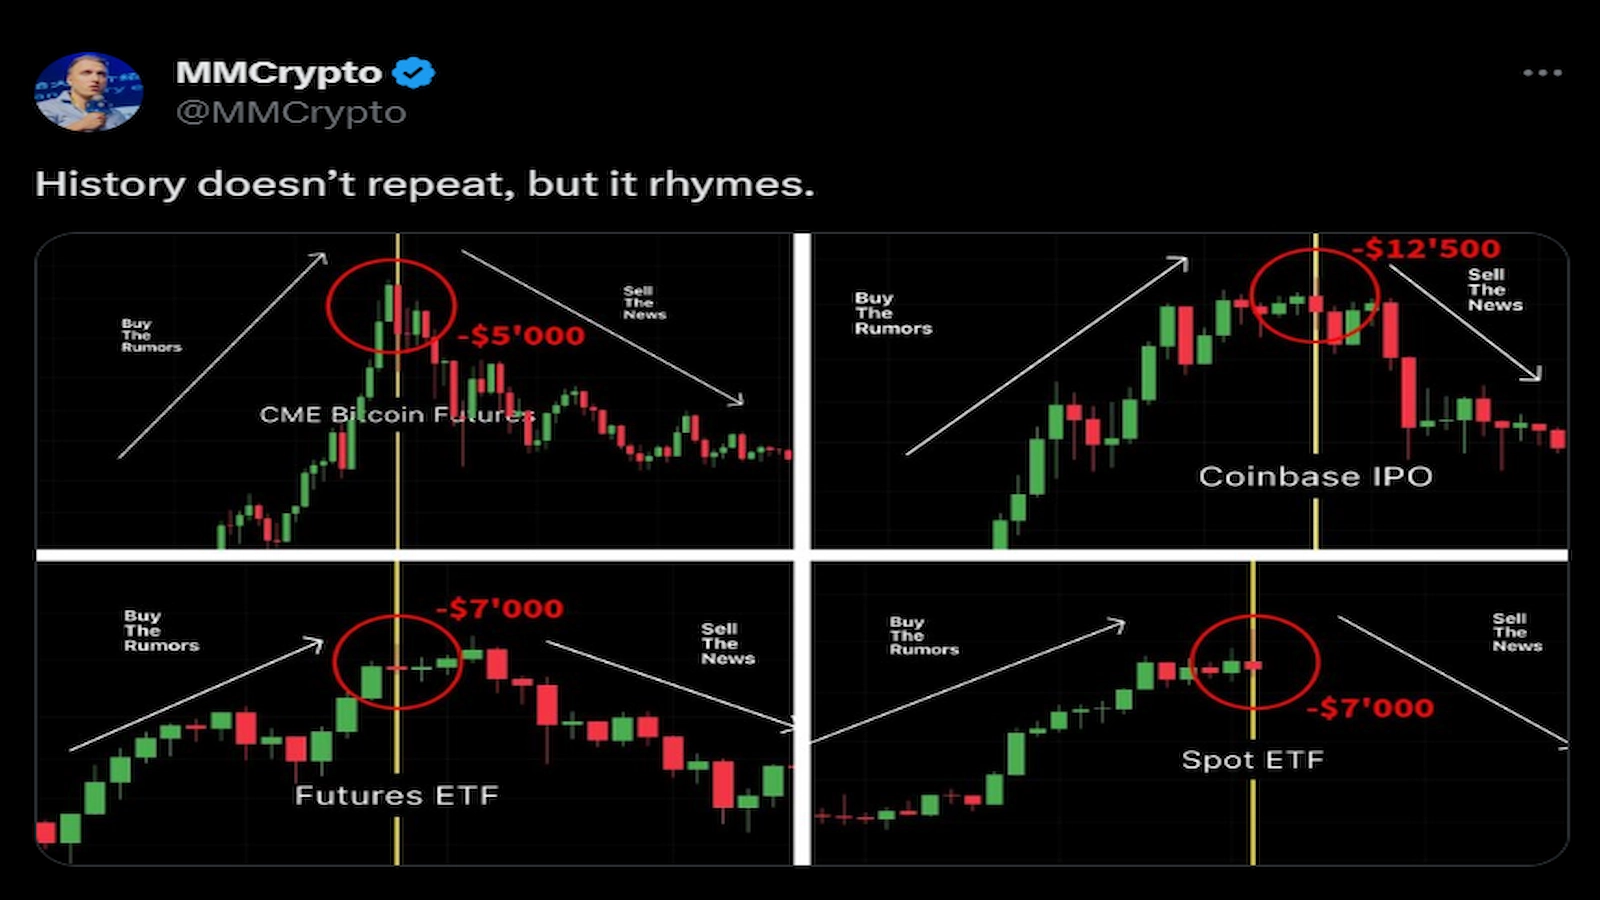
Crypto trader MMCrypto shared a post highlighting the trend of traders selling the news after major crypto events, such as the launch of the spot BTC ETF or Bitcoin futures ETF.
However, traders remain convinced that the current bear run is just a minor correction before BTC and other crypto losers paint a series of green candles, hopefully to respective new ATHs.
Here are the top 5 crypto losers among the top 15 tokens (by market cap) since the launch of the spot Bitcoin ETF.
1. AVAX Price Continues Dismal Run To Enter Crypto Losers List
Avalanche’s native token AVAX price has been one of the top crypto losers in the new year. The crypto token rallied with the wider crypto market, riding the spot BTC ETF hype. However, AVAX prices corrected sharply on Jan.11, with the resulting downtrend paring its gains since Dec. 8, 2023.
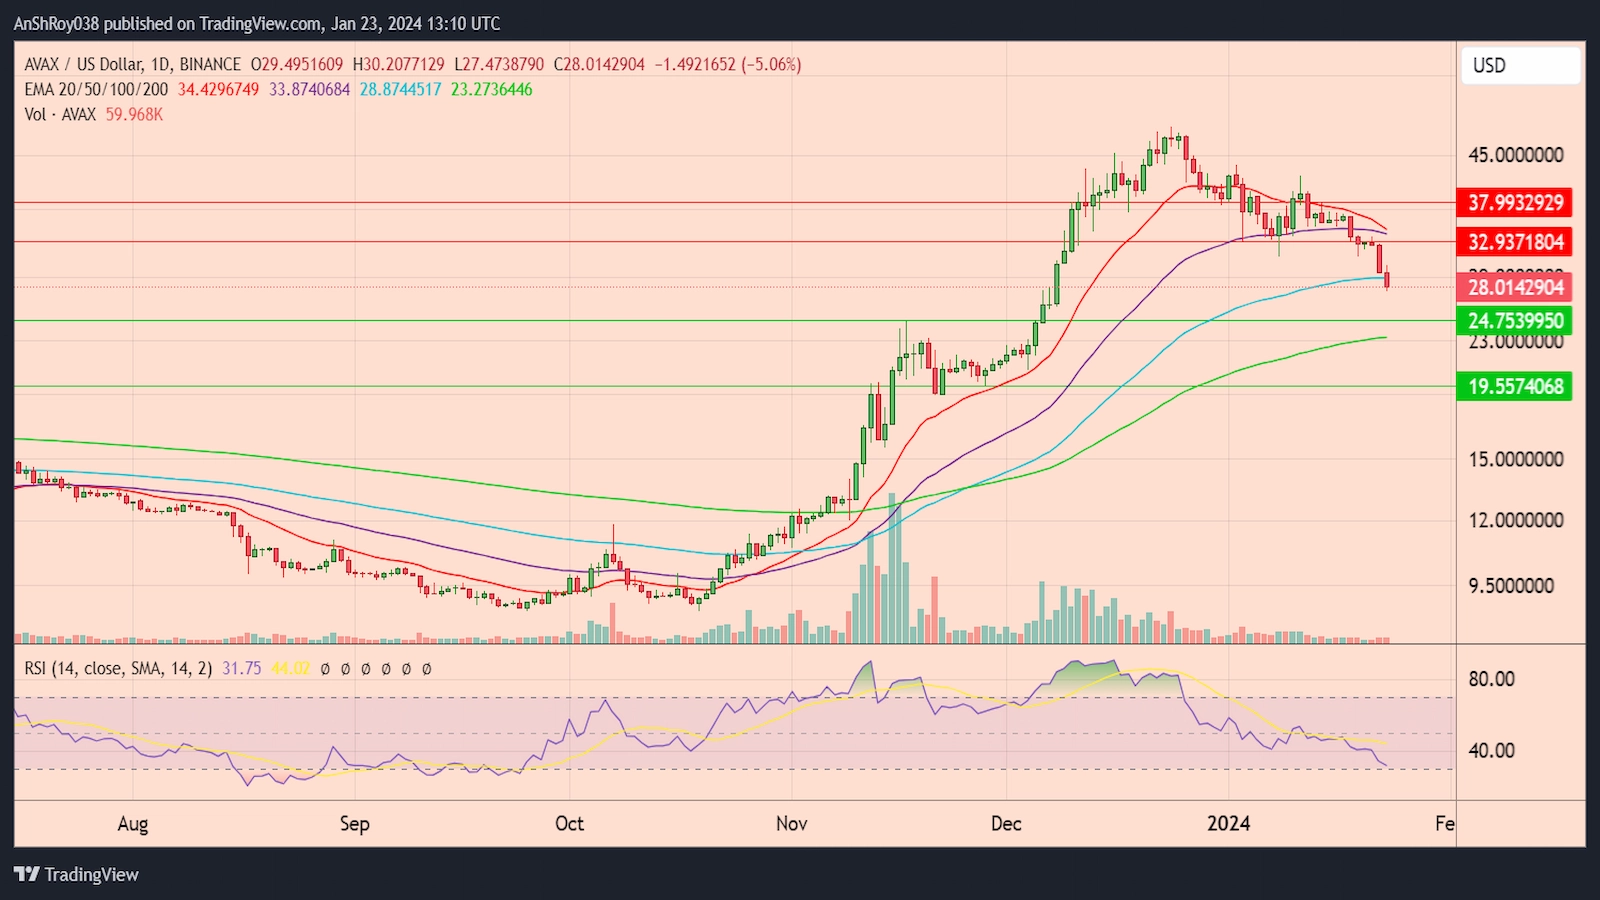
AVAX bulls had hoped that the Bitcoin ETF hype might help the token launch a rally to break its downtrend. Instead, the token is down by nearly 35% since Jan. 11, forming a daily low near $27 on Jan. 23.
If the bears continue to sell, the AVAX price could drop to the support near $24. Breaching the support might force the token to test the support near $19.5 before recovering. Conversely, a rally would see AVAX price rise to the resistance near $33.
Breaking above the resistance might help the token rally to $38 before correcting.
The RSI remained neutral, scoring 31.75 on the daily charts. AVAX bulls remain optimistic about the token’s prospects, claiming that the drop in the token’s prices forms a good entry point for traders.
2. Polkadot (DOT) Price Holding Above EMA Support
DOT price action paints a trendline nearly identical to AVAX’s, with the Polkadot token’s downtrend beginning on Dec. 26 last year. Post the spot Bitcoin ETF launch, DOT price rallied to a high near $8.6 on Jan. 11 before plunging over 30% to a daily low near $6 on Jan. 23.
Bulls are trying to keep DOT price above the 200-day EMA (green wave). Manta Network, a project associated with the Polkadot platform, recently completed its token issuance event, but DOT price did not react to the news.
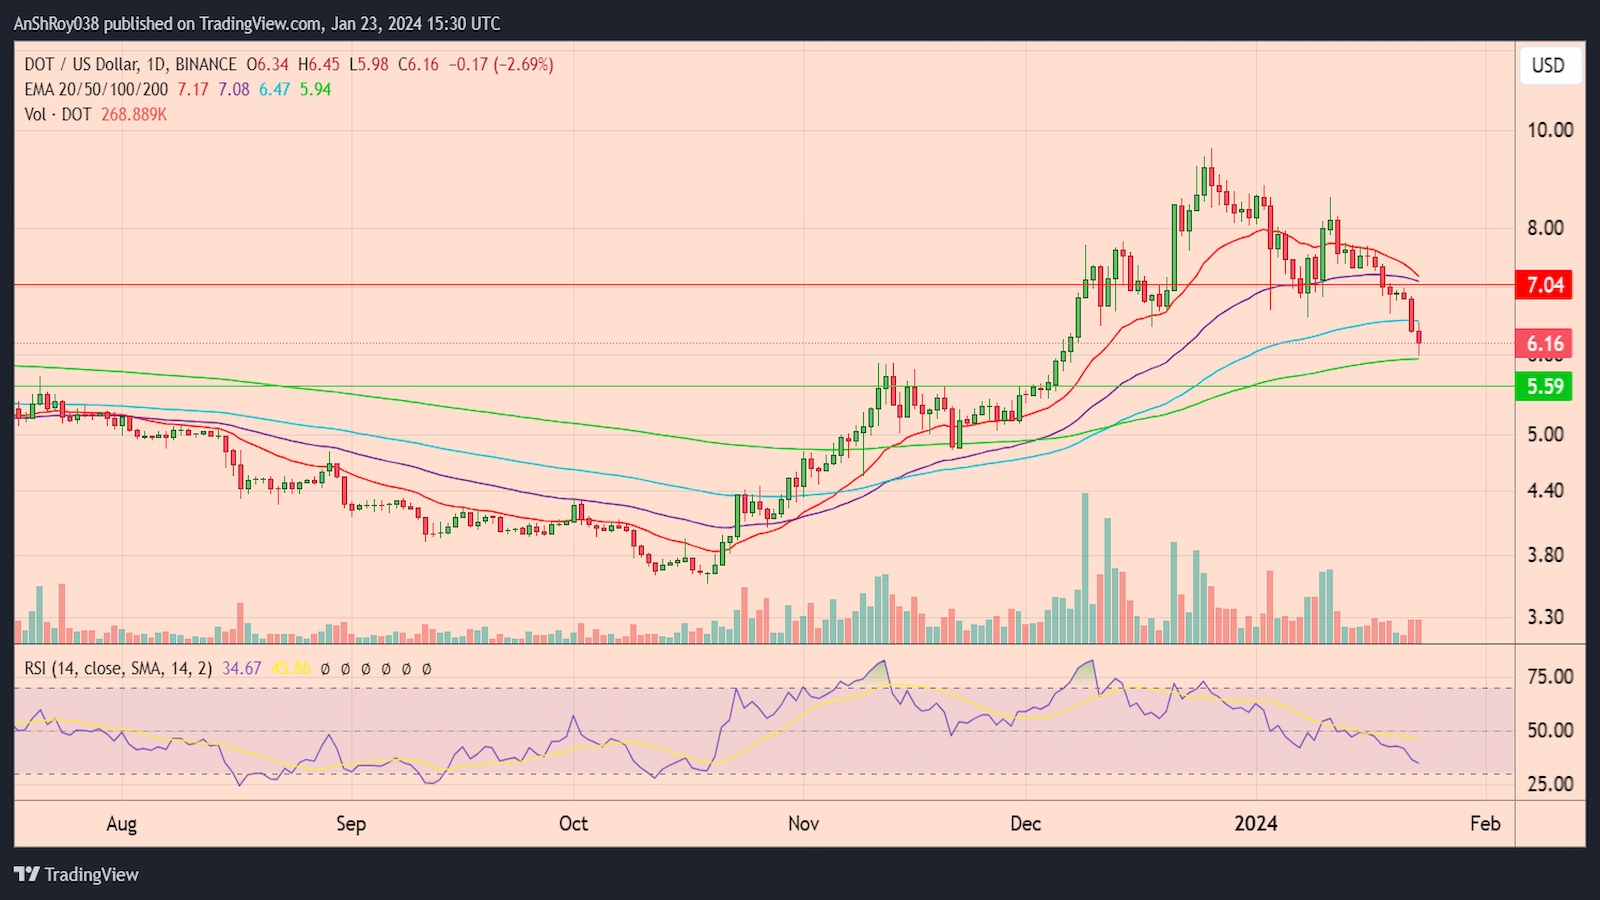
A rebound from the EMA support could see the DOT price rally to the 50-day EMA (purple wave) resistance near $7. On the other hand, if selling continues, the Polkadot token might drop to the support near $5.6 before recovering.
The RSI for DOT remained neutral, with a score of 34.67 on the daily charts.
3. Solana (SOL) Price Testing Bullish Pattern Support
Solana’s (SOL) price has been slightly more resilient than the other top crypto losers. After the spot Bitcoin ETF launch, SOL price dropped 26.3% to a daily low near $79. The token tests the bottom support line of a bullish technical pattern called the ‘bull flag.‘
Bull flags consist of a flag pole, resulting from a near-vertical rise in the crypto token’s prices. Assets in a strong uptrend often form the pattern. For the SOL price, the pattern is clearer in the weekly timeframe.
A period of consolidation succeeding the steep uptrend forms the flag of the pattern (dashed black lines). Despite the strong vertical rally, the asset price does not drop as bulls maintain the buying pressure. As a result, the breakout from the flag pattern often results in a powerful uptrend.
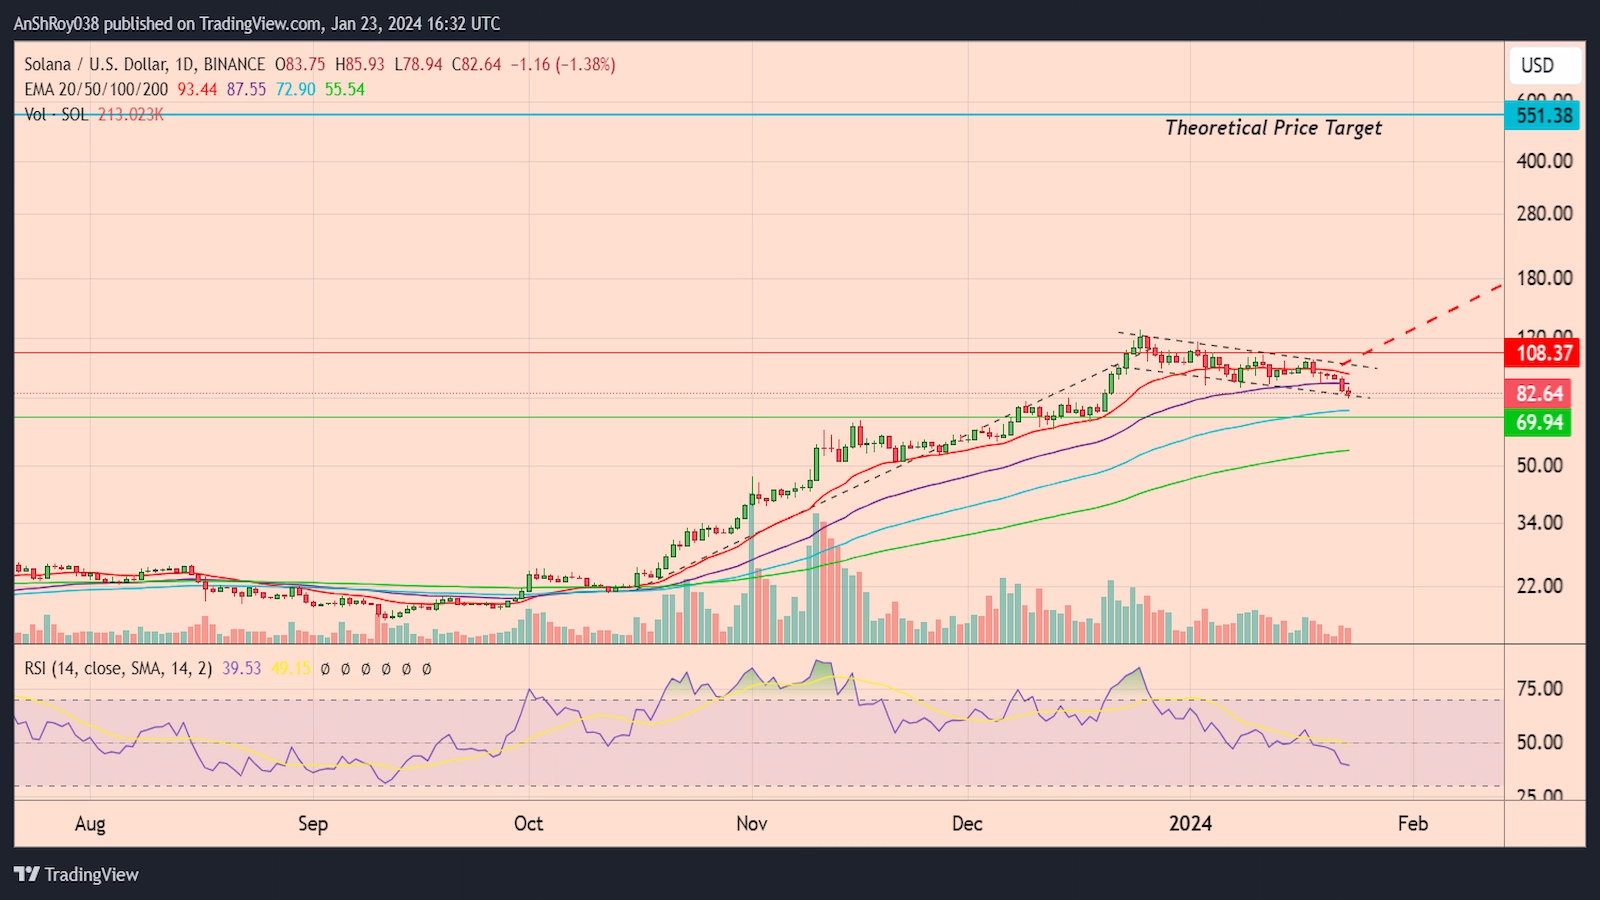
The pattern is completed when the price breaks out of the flag area, continuing the previous upward trend.
Traders calculate the price target of the breakout by adding the length of the flag pole to the breakout price level. Per the rules of technical analysis, the SOL price might rally over 569% to reach the theoretical price target near $551 if the Solana token confirms the pattern.
If the SOL price breaks the pattern’s support line, the token might drop to the support near $70. Conversely, if the pattern pans out, the resulting SOL price rally would face resistance near $108 before moving forward.
The RSI for SOL remained neutral, scoring 39.53 on the daily charts.
4. Cardano (ADA) Price Faces Death Cross Threat
Cardano price painted its third consecutive bearish candle on Jan. 23, testing descending trendline support (dashed black line), which bulls currently defend.
Unlike other crypto losers, ADA price has been in a downtrend since Dec. 14 last year, with a slight bounce in the run-up to the spot Bitcoin launch on Jan. 10.
The token dropped nearly 21% between Jan. 11 and Jan. 23 to reach a daily low near $0.49 on Tuesday.
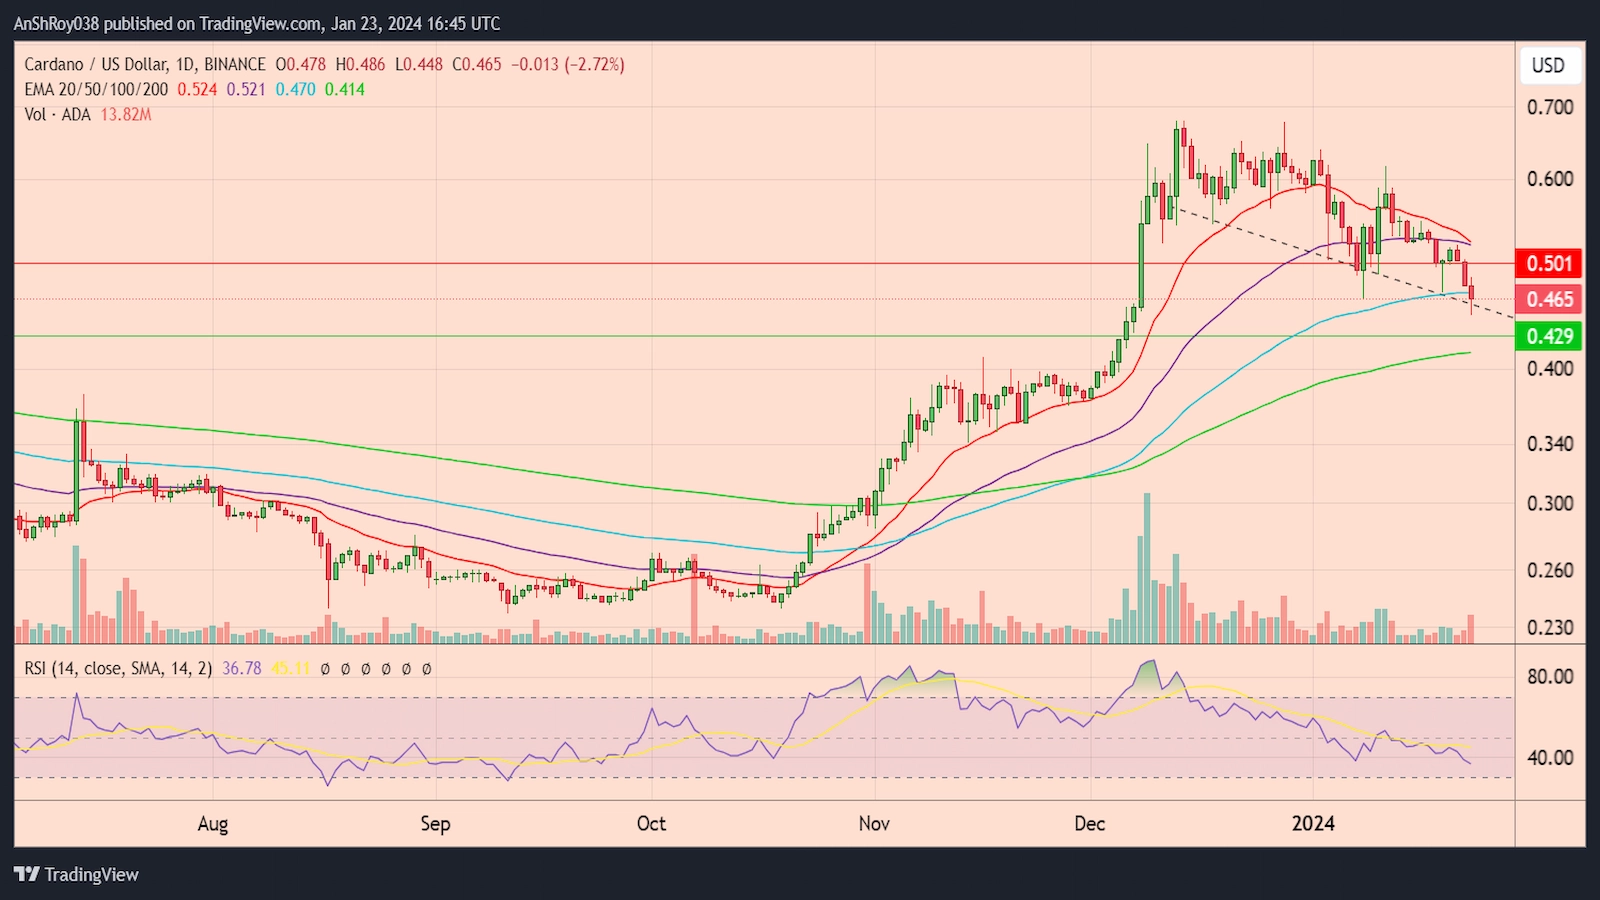
If the ADA price slinks below the descending trendline support, the Cardano token’s price could drop to the support near $0.43. However, once Bitcoin price starts rallying after the spot BTC ETF launch, ADA price could exit the list of top crypto losers and rally to the resistance near $0.5.
The RSI for ADA remained neutral, with a reading of 36.78 on daily charts.
5. Surprise Entry To The List Of Crypto Losers, Ethereum (ETH)
Once spot Bitcoin ETFs gained approval from the SEC, crypto hopium addicts turned their attention to Ethereum’s Ether (ETH) ETF speculations.
However, the hype was shortlived, as the sell-the-news crowd did not spare the prime altcoin, leading to the token’s entry in the list of top crypto losers post ETF launch.
ETH price dropped 19.7% following the spot BTC ETF launch on Jan. 10, reaching a daily low near $2,166 on Jan. 23 before bulls recovered some ground.
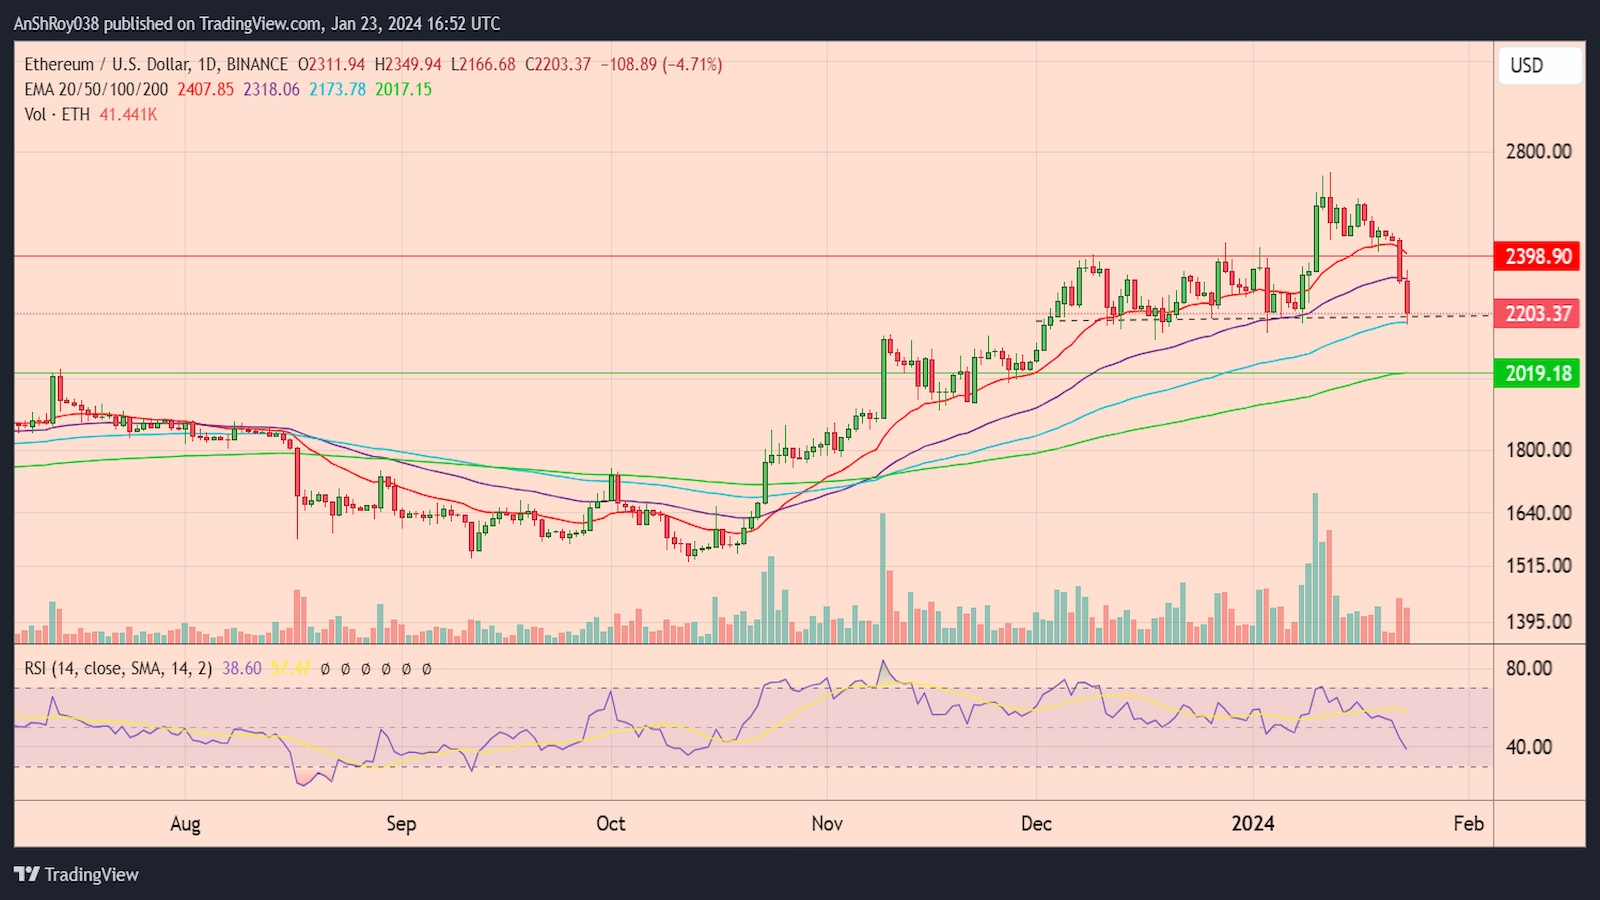
$2,200 remains a critical support level for the token, with ETH price testing it multiple times since Dec. 3 last year. Failure of the key resistance level could force the Ethereum token to drop to the support near $2,020.
On the other hand, any positive update regarding an ETH ETF could attract buyers to the market, helping the Ether price reach the resistance near $2,400 before consolidating.
The RSI for ETH remained neutral, with a score of 38.6 on the daily timeframe.

Чем интересен BlackSprut?
Сервис BlackSprut вызывает интерес многих пользователей. Что делает его уникальным?
Этот проект предоставляет интересные опции для своих пользователей. Оформление платформы характеризуется функциональностью, что позволяет ей быть доступной даже для тех, кто впервые сталкивается с подобными сервисами.
Важно отметить, что BlackSprut имеет свои особенности, которые отличают его в своей нише.
Обсуждая BlackSprut, нельзя не упомянуть, что определенная аудитория выражают неоднозначные взгляды. Одни выделяют его удобство, а некоторые оценивают его более критично.
Подводя итоги, BlackSprut остается предметом обсуждений и удерживает интерес широкой аудитории.
Обновленный домен BlackSprut – ищите здесь
Хотите найти актуальное зеркало на BlackSprut? Это можно сделать здесь.
https://bs2best
Сайт может меняться, поэтому важно знать обновленный домен.
Мы мониторим за изменениями чтобы предоставить новым зеркалом.
Посмотрите актуальную ссылку прямо сейчас!
Our platform offers plenty of slot games, designed for both beginners and experienced users.
Right here, you can discover retro-style games, modern video slots, and huge-win machines with high-quality visuals and realistic audio.
Whether you’re looking for easy fun or love engaging stories, you’re sure to find something that suits you.
http://detimgn.iboards.ru/viewtopic.php?f=80&t=41137
Every slot is playable anytime, with no installation, and perfectly tuned for both all devices.
Besides slots, the site provides helpful reviews, special offers, and player feedback to help you choose.
Register today, start playing, and enjoy the excitement of spinning!
На этом сайте вы можете испытать обширной коллекцией слотов.
Слоты обладают яркой графикой и интерактивным игровым процессом.
Каждая игра даёт особые бонусные возможности, повышающие вероятность победы.
1xbet слоты официальный сайт
Слоты созданы для игроков всех уровней.
Есть возможность воспользоваться демо-режимом, и потом испытать азарт игры на реальные ставки.
Попробуйте свои силы и окунитесь в захватывающий мир слотов.
Therapeutic hypothermia saves brain function. The Welcome to iMedix series explains cooling treatments for cardiac arrest survivors. Neurologists detail remarkable recovery cases. Modern medicine can turn back time—discover how with iMedix best podcasts!
Understanding food labels helps make informed nutritional choices. Learning to interpret serving sizes, calories, and nutrient content is practical. Knowing how to identify added sugars, sodium, and unhealthy fats is key. Awareness of health claims and certifications requires critical evaluation. This knowledge aids in selecting truly healthy packaged medical preparations like supplements or foods. Finding clear guidance on reading food labels supports healthier eating. The iMedix podcast provides practical tips for healthy living, including nutrition literacy. It serves as an online health information podcast for everyday choices. Tune into the iMedix online health podcast for label-reading skills. iMedix offers trusted health advice for your grocery shopping.
Здесь вам открывается шанс играть в обширной коллекцией игровых автоматов.
Слоты обладают красочной графикой и интерактивным игровым процессом.
Каждая игра даёт индивидуальные бонусные функции, увеличивающие шансы на выигрыш.
1xbet казино слоты
Игра в слоты подходит как новичков, так и опытных игроков.
Вы можете играть бесплатно, и потом испытать азарт игры на реальные ставки.
Проверьте свою удачу и получите удовольствие от яркого мира слотов.
Онлайн-площадка — официальная страница частного аналитической компании.
Мы оказываем услуги по частным расследованиям.
Команда сотрудников работает с предельной конфиденциальностью.
Нам доверяют наблюдение и разные виды расследований.
Услуги детектива
Любой запрос обрабатывается персонально.
Задействуем новейшие технологии и действуем в правовом поле.
Если вы ищете настоящих профессионалов — свяжитесь с нами.
This website provides many types of medications for home delivery.
Anyone can conveniently buy essential medicines without leaving home.
Our catalog includes everyday drugs and custom orders.
The full range is provided by trusted suppliers.
https://community.alteryx.com/t5/user/viewprofilepage/user-id/569359
We ensure quality and care, with data protection and prompt delivery.
Whether you’re filling a prescription, you’ll find safe products here.
Visit the store today and enjoy reliable online pharmacy service.
Онлайн-площадка — официальная страница лицензированного сыскного бюро.
Мы организуем услуги в сфере сыскной деятельности.
Коллектив детективов работает с максимальной осторожностью.
Наша работа включает наблюдение и анализ ситуаций.
Услуги детектива
Каждое обращение обрабатывается персонально.
Опираемся на новейшие технологии и соблюдаем юридические нормы.
Ищете достоверную информацию — добро пожаловать.
Traditional timepieces will always remain fashionable.
They symbolize heritage and offer a sense of artistry that modern gadgets simply cannot match.
These watches is powered by fine movements, making it both reliable and inspiring.
Timepiece lovers appreciate the craft behind them.
https://telegra.ph/Franck-Muller-2025-Timepieces-That-Defy-Time-Itself-03-27
Wearing a mechanical watch is not just about telling time, but about celebrating tradition.
Their styles are timeless, often passed from father to son.
Ultimately, mechanical watches will stand the test of time.
… [Trackback]
[…] Information on that Topic: coinchapter.com/top-5-crypto-losers-since-spot-bitcoin-etf-launch/ […]
… [Trackback]
[…] Find More here on that Topic: coinchapter.com/top-5-crypto-losers-since-spot-bitcoin-etf-launch/ […]
… [Trackback]
[…] Information to that Topic: coinchapter.com/top-5-crypto-losers-since-spot-bitcoin-etf-launch/ […]
Национальные награды имеют особое значение в общественной жизни.
Они отмечают заслуги людей, которые сделали значимый шаг в укрепление государства.
Эти знаки признания помогают формировать положительный образ гражданского подвига.
Кроме того, они вдохновляют людей на новые достижения.
производство наград
Оценка заслуг государством нередко усиливает доверие к человеку в коллективе.
Необходимо осознавать, что почётный знак имеет глубокий смысл, а выражение благодарности.
Она подчёркивает значимость труда, который был выполнен награждённым.
Таким образом, государственные награды остаются ключевым инструментом поощрения в нашей стране.
На этом сайте представлено много ценной информации.
Пользователи отмечают, что ресурс помогает быстро находить нужные сведения.
Информация поддерживается в актуальном состоянии, что делает сайт удобным для использования.
Многие считают, что навигация ресурса очень понятна и позволяет быстро ориентироваться.
Широкий выбор материалов делает ресурс универсальным для людей с разными интересами.
Также отмечается, что материалы оформлены аккуратно и читаются без труда.
Сайт помогает получать новые сведения благодаря детальным обзорам.
В итоге, этот ресурс можно назвать удобным местом для изучения важных тем для всех пользователей.
https://icolog.ru
На этом сайте представлено много ценной информации.
Пользователи отмечают, что ресурс удобен для поиска информации.
Материалы обновляются регулярно, что делает сайт удобным для использования.
Многие считают, что структура сайта интуитивно ясна и позволяет сэкономить время.
Разнообразный контент делает ресурс полезным для широкой аудитории.
Также отмечается, что материалы оформлены аккуратно и легко воспринимаются.
Сайт помогает расширять знания благодаря информативным материалам.
В целом, этот ресурс можно назвать полезной площадкой для всех пользователей.
https://koreavto.ru
На данном ресурсе представлено большое количество полезного контента.
Пользователи отмечают, что ресурс помогает быстро находить нужные сведения.
Материалы обновляются регулярно, что делает сайт практичным для чтения.
Многие считают, что навигация ресурса очень понятна и позволяет без труда находить нужное.
Большое разнообразие тем делает ресурс полезным для разных категорий пользователей.
Также отмечается, что материалы написаны профессионально и читаются без труда.
Сайт помогает расширять знания благодаря подробным статьям.
Таким образом, этот ресурс можно назвать полезной площадкой для всех пользователей.
https://icolog.ru
IQOS представляет собой инновационный продукт для использования табачных стиков.
В отличие от традиционных изделий, здесь используется принцип нагрева.
Многие пользователи отмечают, что такой формат характеризуется другим ощущением вкуса.
Устройство имеет компактный формат, что делает его практичным вариантом.
Аккуратное исполнение позволяет IQOS органично вписываться в повседневную жизнь.
Производитель уделяет внимание технической надёжности, что повышает общий уровень удобства.
Регулярное обслуживание помогает сохранять функциональность устройства.
Следовательно, IQOS остаётся технологичным продуктом для тех, кто выбирает данный формат.
https://terea777.shop/guevo/catalog