
Key Takeaways:
- TRX’s price dropped nearly 7% during trading on April 12.
- Binance US’s announcement of delisting the Tron token might have caused the decline.

NEW DELHI (CoinChapter.com) — Crypto exchange Binance US announced it would delist TRX, the native token of Justin Sun’s Tron blockchain. The news sparked a downtrend in TRX prices, forcing the token to shed nearly 7% during trading on April 12.
The news added to the woes of Justin Sun, who the US Securities and Exchange Commission charged with fraud in March this year. The regulatory body charged Sun with allegedly manipulating the secondary TRX market through wash trading.
Meanwhile, Binance US shared it would disable TRX staking on April 13 before removing the token from the staking page on April 14. However, withdrawals would remain open for the token so traders can withdraw their token holdings.
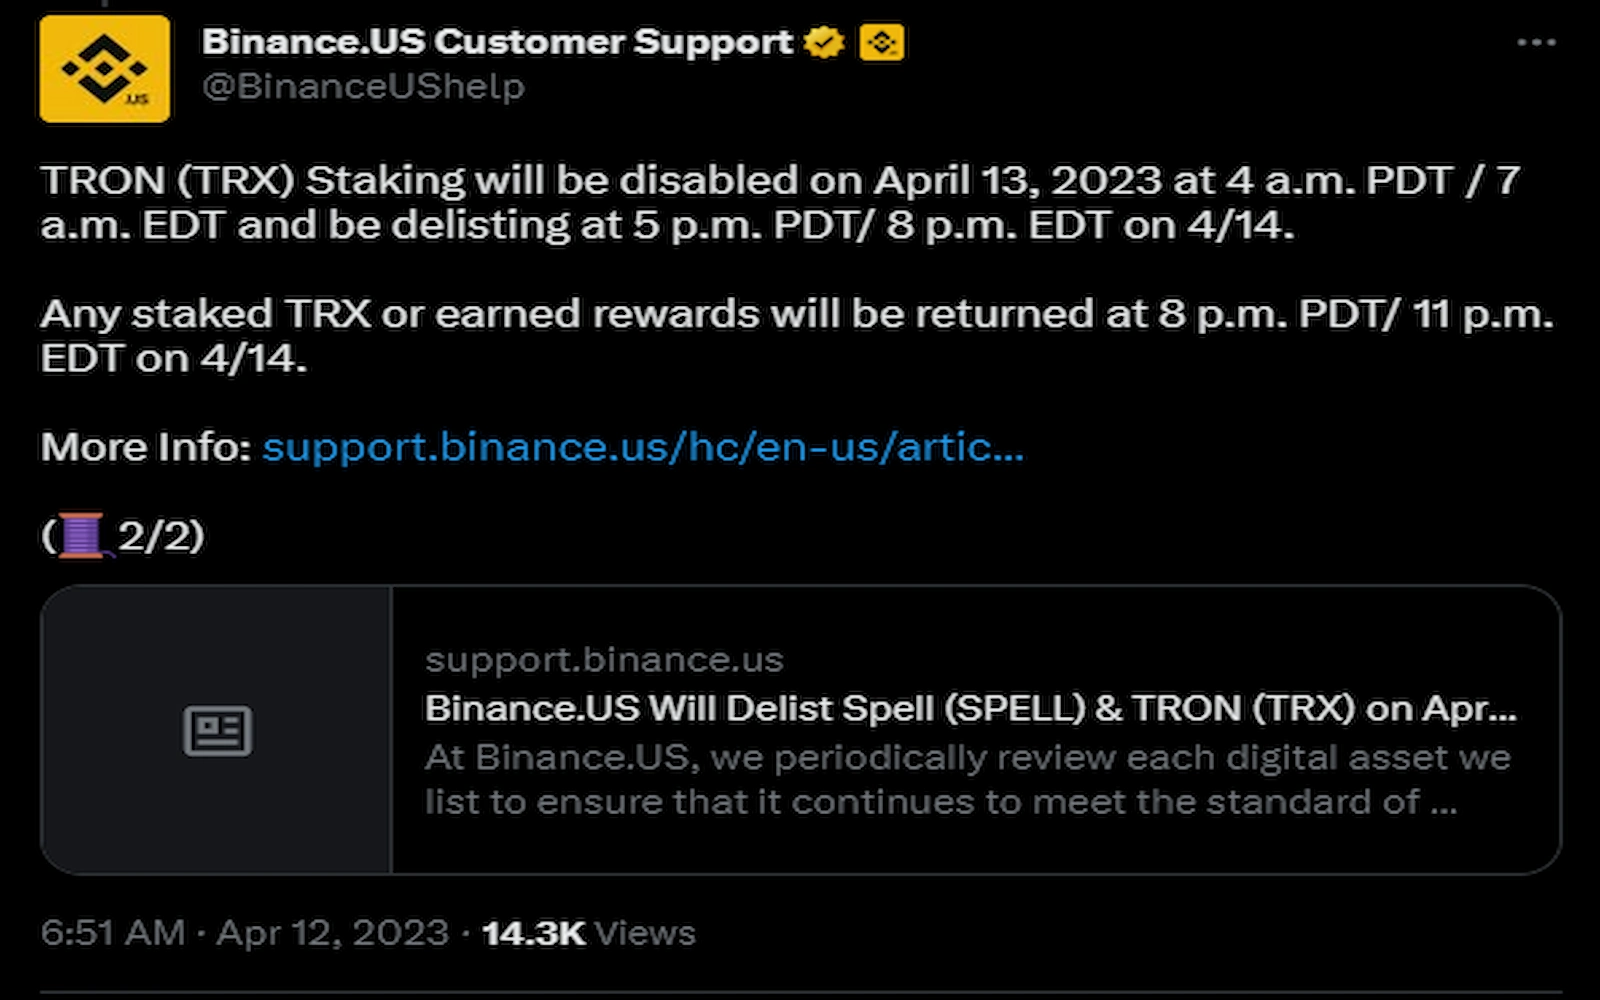
Trading for the Tron token would close on April 18. The US arm of Binance also delisted the Spell (SPELL) token. Some of the reasons the exchange cited for the delisting included the token’s regulatory standing in the US and changes in a digital asset’s risk profile.
TRX Price Form Two Bearish Patterns
Meanwhile, the TRX token has formed two concentric bearish patterns. In the shorter timeframe, TRX prices have formed a falling wedge pattern.
In detail, two up-sloping converging trend lines that connect a price series’s respective highs and lows form a rising wedge pattern. A bearish pattern can be a continuation or a reversal pattern.
Also Read: SOL Price Prediction: Solana Surges 10%, and Bulls Are Not Done YetUnfortunately, TRX’s rising wedge is a reversal pattern, sloping up with the prevailing trends. The price target of the pattern is equal to the height of the back of the wedge. If the Tron token confirms the pattern, the TRX price might fall to $0.0443, dropping nearly 30%.
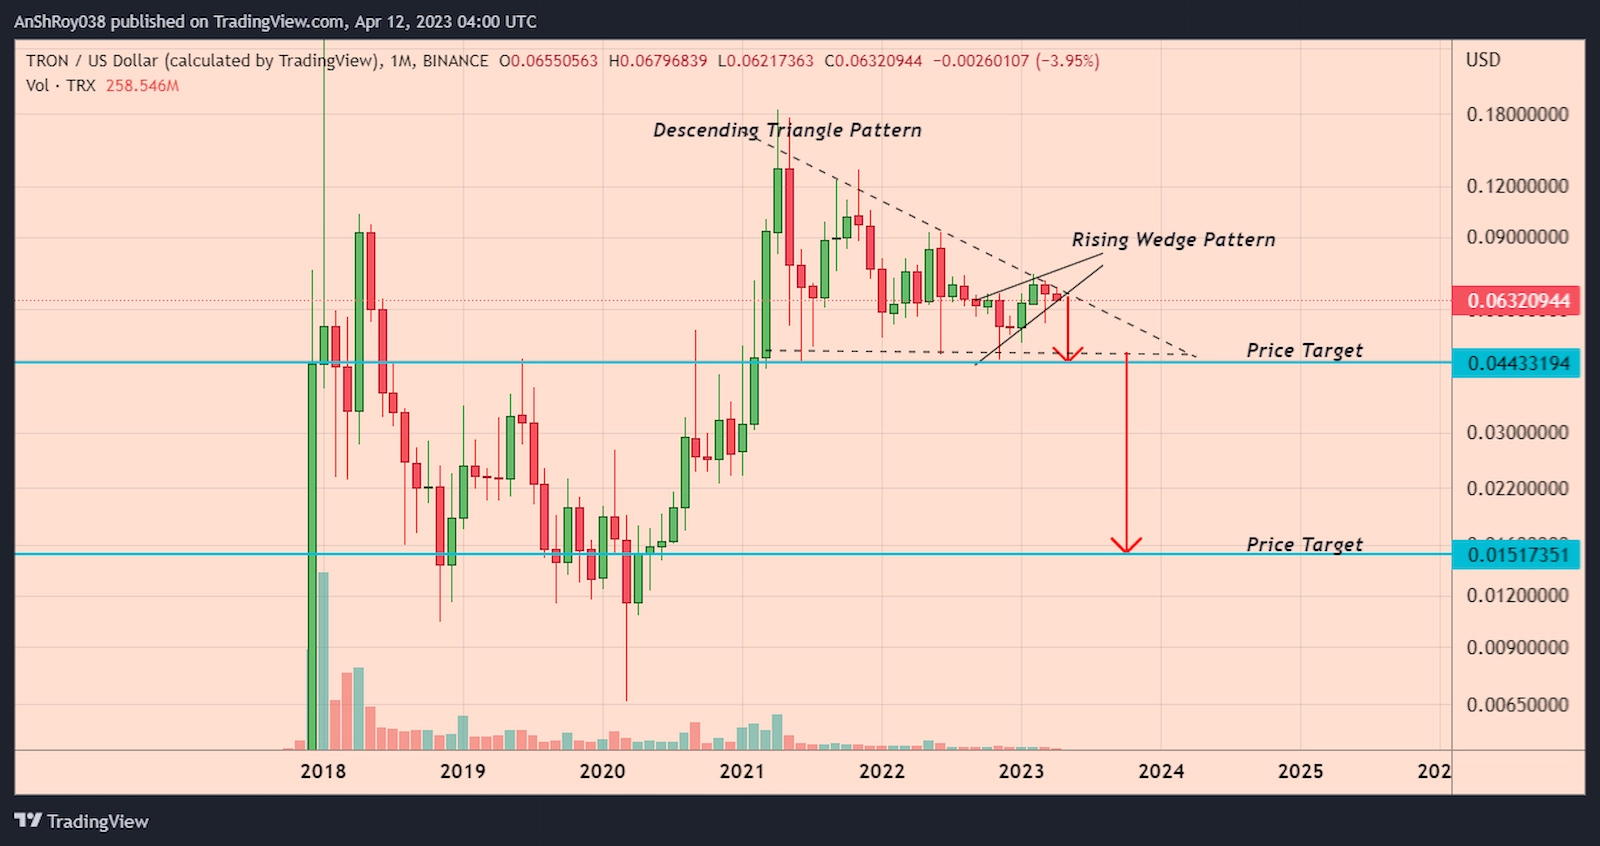
Moreover, zooming out on the chart shows TRX prices are moving inside another bearish pattern called the descending triangle. If TRX confirms the bearish wedge, the token’s price will start moving inside the descending triangle.
A descending trendline connecting swing highs and a horizontal trendline joining swing lows form the pattern. The height of the triangle determines the price target in a descending triangle setup.
Per the rules of technical analysis, the TRX price might drop nearly 76% from the Tron token’s current price level to reach $0.01517 before recovering.
TRX Price Chart
TRX price dropped nearly 7% to a daily low of $0.06217 on April 12. The downtrend followed a 1.62% drop in TRX price on April 11. A multi-week descending trendline resistance rebuffed the Tron token’s rally on April 11.
TRX’s price has now failed thrice to break above the trendline resistance. If the downtrend continues, TRX price might drop below the 200-day EMA (green wave) dynamic support to reach $0.0625.
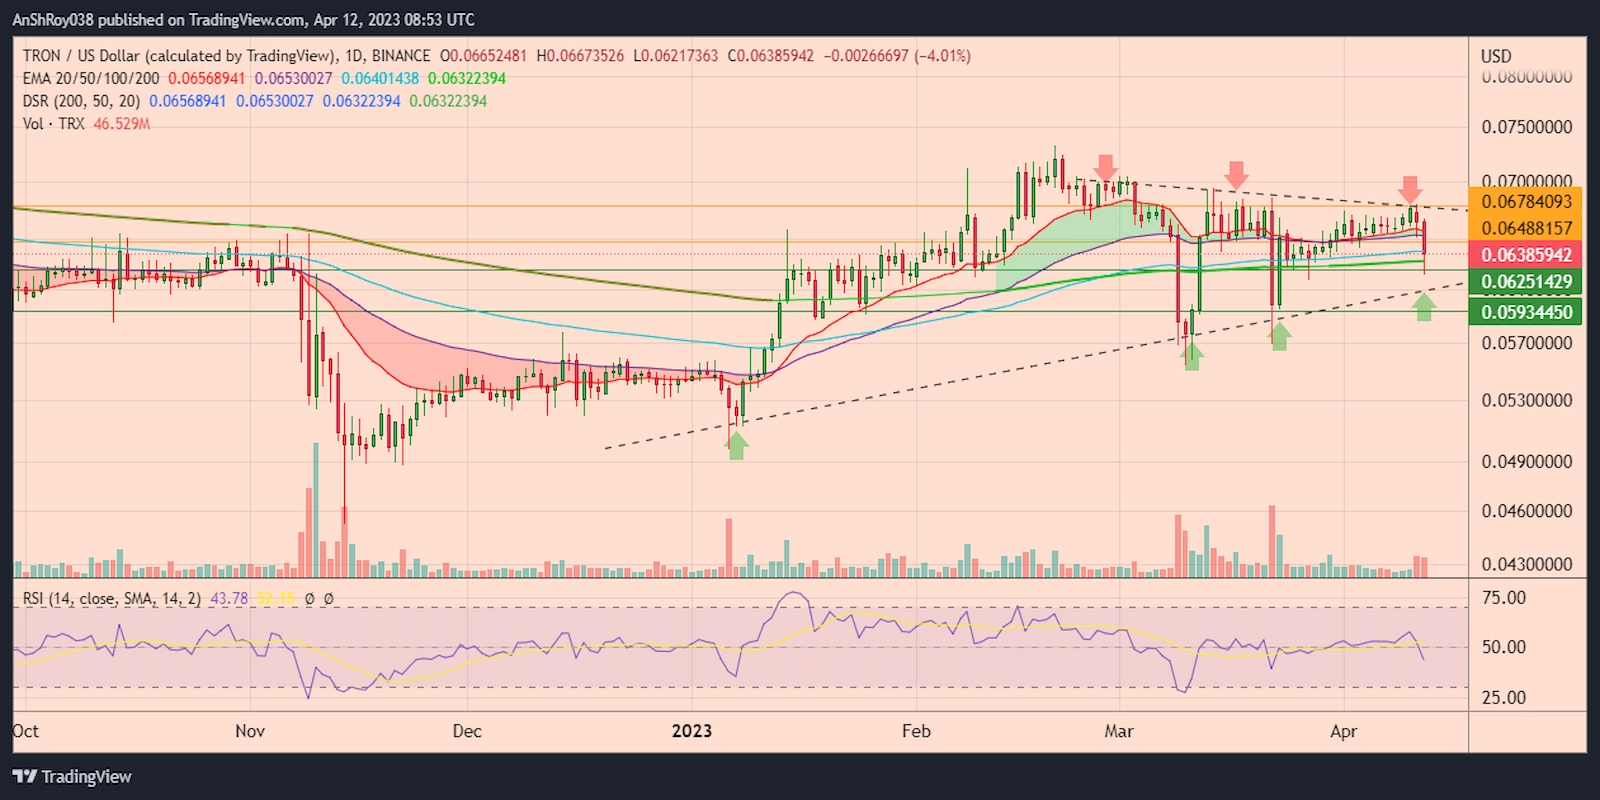
Moreover, breaching the immediate resistance could force the TRX token price to break below multi-month trendline support. The Tron token price has rebounded off the ascending trendline support three times in 2023.
However, breaching below the trendline support might force the TRX to test support near $0.0593 before recovering.
Conversely, an uptrend might see TRX’s price face resistance from its 50-day EMA (purple wave) near $0.0649. Moreover, breaking and consolidating above the immediate resistance would help the Tron token price challenge the descending trendline resistance near $0.0678 before corrections pare gains.
The relative strength index for the Tron token price remained neutral, clocking at 43.78 on the daily charts.

… [Trackback]
[…] Find More Info here on that Topic: coinchapter.com/tron-price-risks-30-drop-after-binance-uss-trx-delisting/ […]
… [Trackback]
[…] Find More on to that Topic: coinchapter.com/tron-price-risks-30-drop-after-binance-uss-trx-delisting/ […]
… [Trackback]
[…] Read More on that Topic: coinchapter.com/tron-price-risks-30-drop-after-binance-uss-trx-delisting/ […]
… [Trackback]
[…] Find More on to that Topic: coinchapter.com/tron-price-risks-30-drop-after-binance-uss-trx-delisting/ […]
… [Trackback]
[…] Here you can find 28078 additional Info to that Topic: coinchapter.com/tron-price-risks-30-drop-after-binance-uss-trx-delisting/ […]