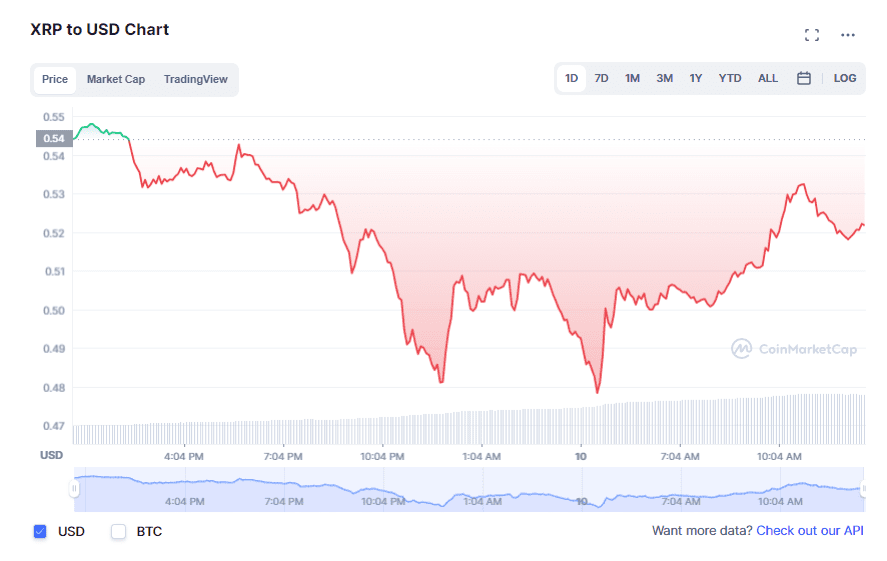
YEREVAN (CoinChapter.com) — XRP traded at $0.52 at the London session opening bell on May 10. The token pared 10% of its value after plunging by nearly 30% alongside Bitcoin (BTC) since May 6. As a result, the token traded 73% below its all-time high of nearly $2 on April 14, 2021.
However, while following Bitcoin’s lead, XRP flashed conflicting clues that could take the asset up in the short term but drop it below a significant support line in the long haul.
XRP hopes for an upside move
After a choppy performance in the previous month, XRP/USD price action reached a support trendline that has been instrumental since Aug. 2021. Moreover, the token saw an uptrend in trading volumes despite the sinking price action, which could create enough buying incentive to pick up the value.
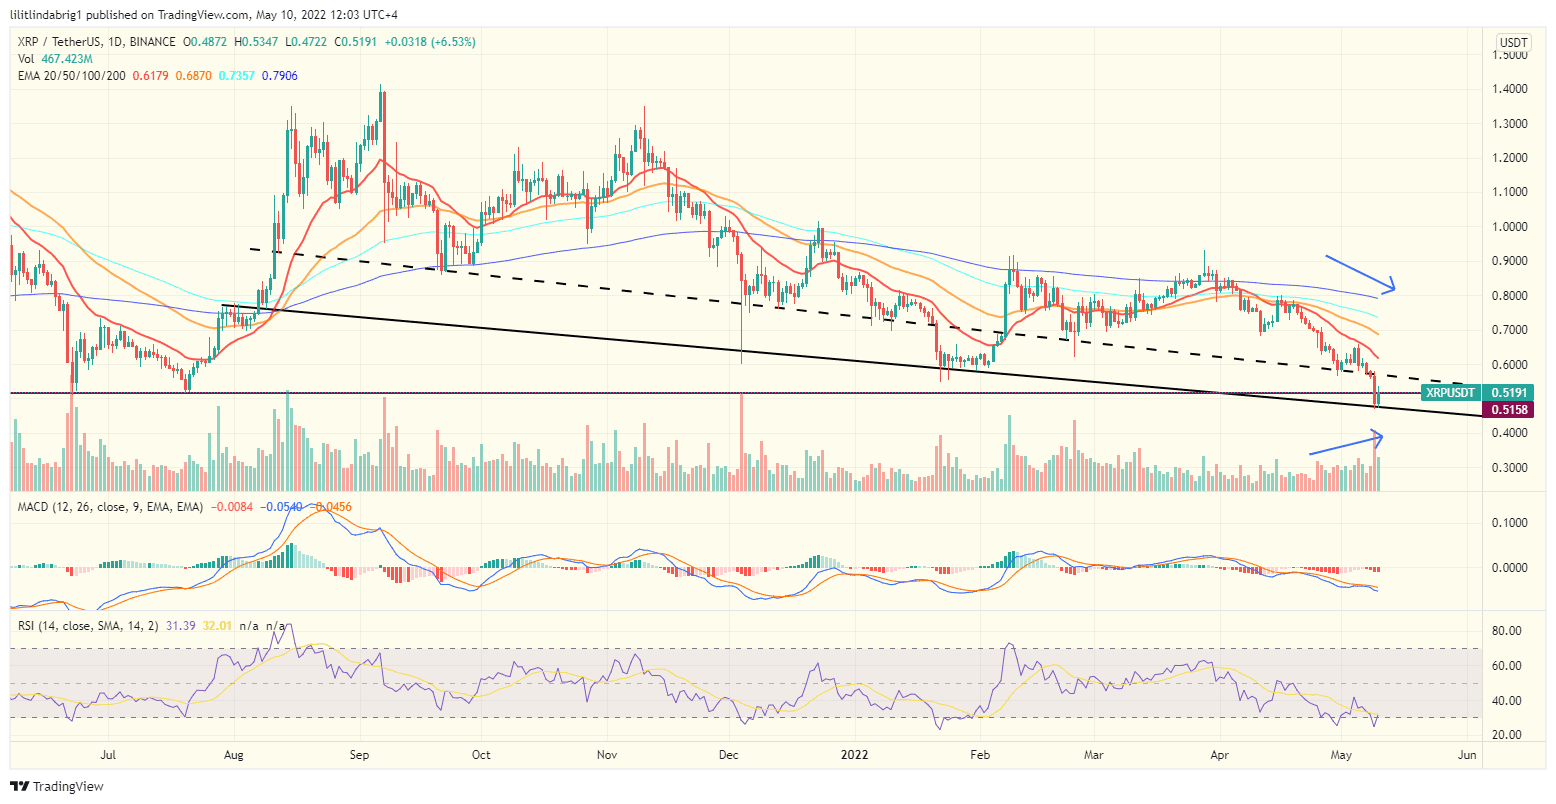
The relative strength index (RSI; purple graph) also benefitted from charting in the ‘oversold’ territory.
In short, the RSI reflects traders’ expectations of a given asset. When it charts lower than 30, investors could see the fallen price as an opportunity to ‘buy the dip,’ subsequently boosting the value. Thus, XRP bulls could take action and bolster the token’s price in the upcoming sessions.
Also read: Ripple addresses move large chunks of XRP as the token price drops 15% in a week. However, the weekly chart testified that a bearish setup might challenge the bullish efforts.
Weekly chart bearish
The digital asset’s weekly price action formed a bearish Falling Triangle, which could take the token below a crucial support bar at approximately $0.50-$0.55. In detail, the formation entails a resistance trendline with a negative slope and a flat lower trendline. Additionally, the mentioned support bar acted as the setup’s horizontal support.
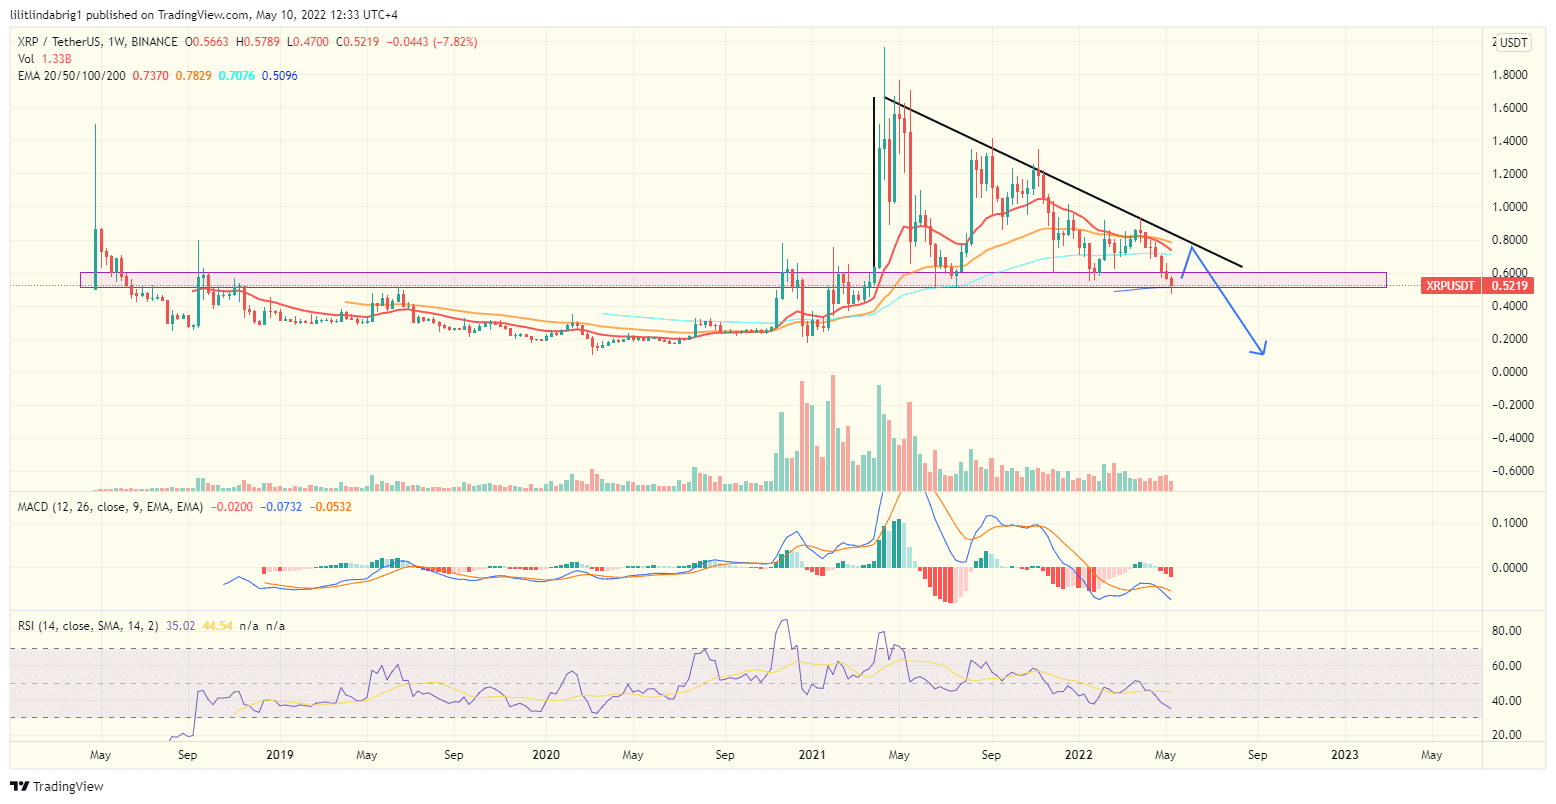
XRP could drop below the bar after exhausting the Triangle with several support/resistance retests if the formation pan out. Thus, the upside move hints from the daily chart do not contradict the Triangle. XRP bulls could successfully pump the price before a drop below the support occurs.
Also read: XRP trading volume sinks by $436 billion to a quarterly low as it fails to break above $0.8. Daily technicals suggest that XRP could rise above $0.55 in the upcoming sessions if the buying pressure holds. However, the weekly chart hinted at a bearish continuation and could take XRP below $0.50. Notably, the digital asset depends on Bitcoin’s volatility and the overall climate of the broader market.

… [Trackback]
[…] Here you can find 48711 additional Information on that Topic: coinchapter.com/xrp-price-now-70-below-record-high-more-pain-ahead/ […]
… [Trackback]
[…] Read More here on that Topic: coinchapter.com/xrp-price-now-70-below-record-high-more-pain-ahead/ […]