Key Takeaways:
- EVM compatible zk rollups went live on the Ethereum testnet on Feb 22.
- ETH has painted a bullish technical pattern on its weekly charts that forecast a $10,000+ price target.
NEW DELHI (CoinChapter.com) — Matter Labs’ ZkSync announced the deployment of its EVM compatible Rollup protocol, the first of its kind, on the Ethereum (ETH) testnet. The latest update helps to remove human operators from transaction validations.
Zero-knowledge (ZK) proofs allow external validators to verify encrypted transactions without handing over sensitive private information. They are useful in complex DeFi applications that handle users’ private data, such as names, addresses, credit card details, etc.
Hence, transaction processing doesn’t require all transaction data posted on Ethereum, helping reduce the block space and gas fees while enabling scaling. ZkSync’s zkEVM claims to be a permissionless, Turing-complete ZK Rollup that would help projects deploy dApps in a low-fee and scalable environment.
Also Read: Ethereum snubs bearish Morgan Stanley report as ETH holds strong above $2.5K.Matter Labs claims that user experience would be better on this network. Ethereum’s high gas fees have chased away prospective users, as developers choose lower-cost blockchains over the Ethereum network. Moreover, the announcement stated that the platform had added a new ecosystem hub for developers.
Although the zk rollup platform aims to scale without sacrificing security and privacy, one drawback of the zk rollup is mostly compatible with payment and transaction applications. In contrast, the Optimistic rollup approach supports a greater variety of applications.
However, developers seem to be excited about the new platform, with many taking to Twitter to share their desire to launch projects on zkSync 2.0.
Ethereum to $10,000? If A Technical Pattern Holds True
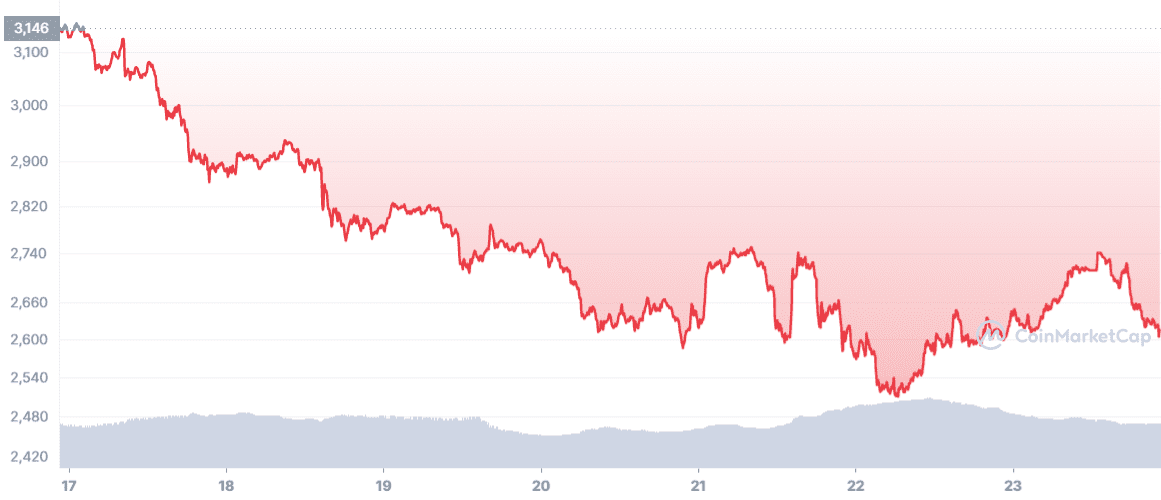
Meanwhile, Ethereum prices have fallen nearly 18% over the last seven days, going from a Feb 17’s high of $3,162 to reach Feb 23’s intraday low of $2,598. However, ETH defended the $2,500 price level, as bears moved in to buy the dips.
Moreover, ETH is forming an ascending triangle pattern on its weekly charts. An ascending trendline joining swing lows and a horizontal trendline joining swing highs form the bullish continuation pattern. As price moves inside the right triangle structure, dropping volume usually confirms the pattern.
For ETH, the prices have been accumulating since May 2021. However, the pattern’s upper trendline has high selling pressure, making it difficult for the Ethereum token to break above it.
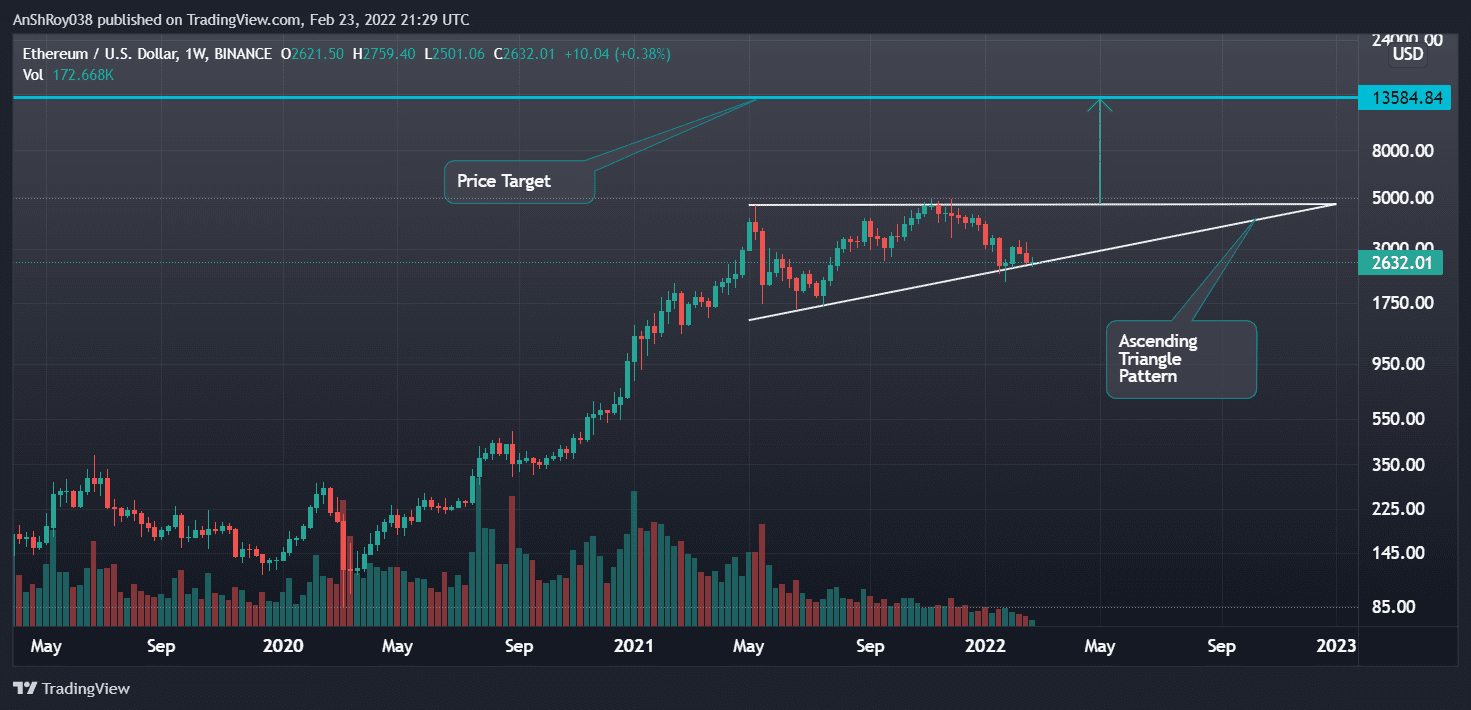
Ascending triangles often forecast a bullish rally, with a price target equal to the maximum distance between horizontal and ascending trendlines. As such, ETH prices could rise to as much as $13,584 per Ether, a gain of 416% from current price levels.
Also Read: Ethereum investment products break inflow dry spell after 9-weeks.However, that would require a near-perfect completion of the ascending triangle pattern, which is almost impossible in a practical scenario. As such, some analysts feel that ETH’s recovery rally might be a bull trap.
ETH Price Charts
The bull trap argument ignores the pattern, instead focussing on ETH’s descending trendline, which has acted as resistance since Nov 2021. In addition, the Ethereum token formed a death cross between its 100-day moving average (yellow wave) and 200-day MA (red wave).
In detail, a death cross forms when a token’s short-term moving average trendline moves below a relative long-term moving average. Traders believe the technical pattern signals negative sentiment and weakness.
The death cross often indicates the onset of bearish price action, resulting in significant selling pressure. If ETH succumbs, the resulting sell-off could push Ethereum to support near $2,560. Furthermore, if ETH breaks below immediate support, support near $2,400 would come into play.
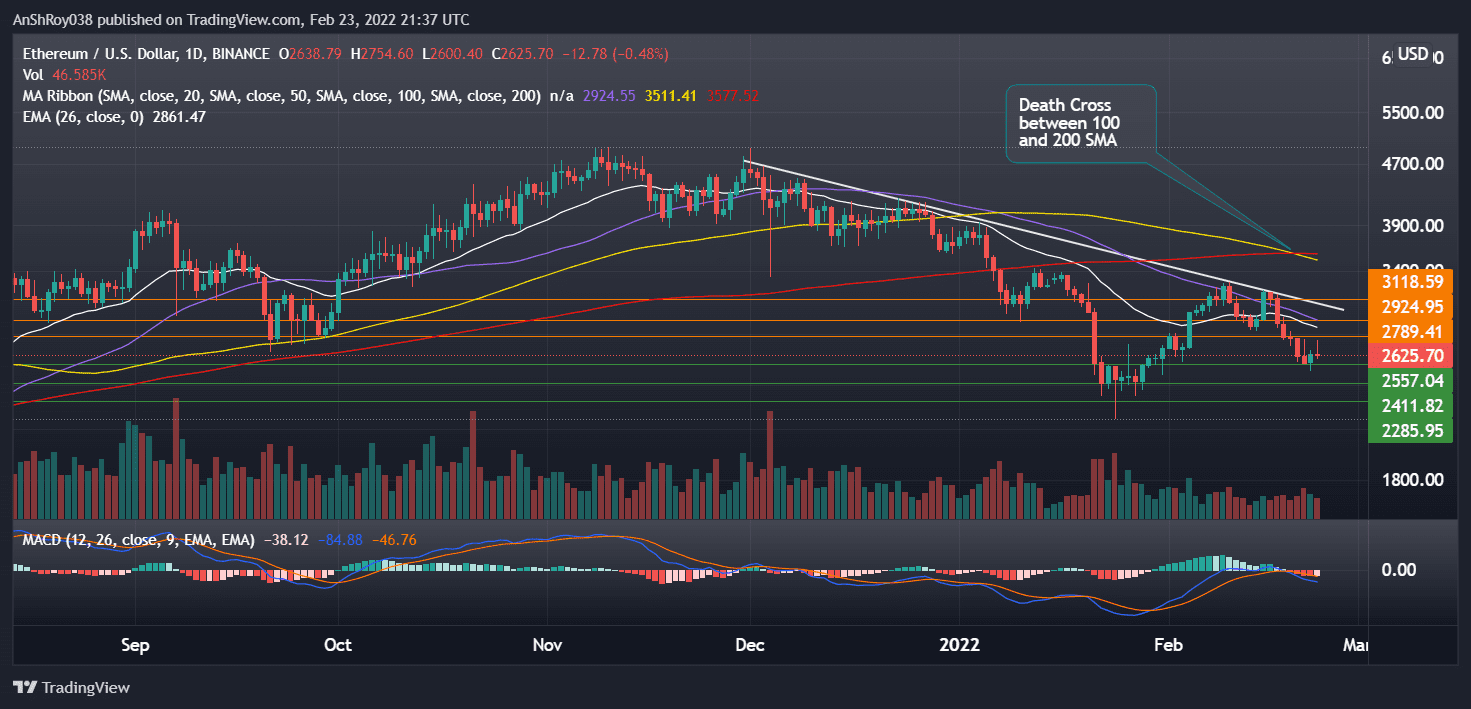
Moreover, a rejection from the descending resistance could see Ethereum fall to $2,290, a price level ETH last saw in early Jul last year.
Conversely, if Ethereum prices start an upside rally, the token would first try to flip immediate resistance at $2,790 to support. Afterward, ETH would challenge resistance near its 50-day MA line (violet wave) at $2,924.
ETH could then target the resistance near the descending trendline at $3,118. Meanwhile, trend-based momentum oscillator MACD continues to be bearish for ETH.
The indicator charted a bearish crossover for ETH on Feb 19. A bearish crossover occurs when the MACD line (difference between 12-day and 26-day EMA) moves below the MACD signal line (9-day EMA of MACD).
Moreover, bars on the MACD histogram are expanding, indicating increasing bearishness of ETH’s price momentum.
At the time of writing, ETH was trading at $2,593, down by 1.71% on the day.

… [Trackback]
[…] Here you can find 5446 more Info to that Topic: coinchapter.com/zk-rollup-live-on-ethereum-testnet-as-a-bullish-technical-pattern-predicts-10k-eth/ […]
… [Trackback]
[…] Find More Info here to that Topic: coinchapter.com/zk-rollup-live-on-ethereum-testnet-as-a-bullish-technical-pattern-predicts-10k-eth/ […]
… [Trackback]
[…] Here you will find 30549 additional Information on that Topic: coinchapter.com/zk-rollup-live-on-ethereum-testnet-as-a-bullish-technical-pattern-predicts-10k-eth/ […]
… [Trackback]
[…] Here you will find 10499 more Information on that Topic: coinchapter.com/zk-rollup-live-on-ethereum-testnet-as-a-bullish-technical-pattern-predicts-10k-eth/ […]