
Yerevan (CoinChapter.com) – XTZ, the native token of Tezos decentralized, open-source blockchain network, exhibited bullish signs on the daily charts against Bitcoin.
Golden Cross
XTZ has suffered losses since May 19, along with the rest of the market. However, Michael Van de Poppe, the Amsterdam-based crypto analyst, spotted a golden cross ahead on the daily chart. The golden cross appears when a short-term moving average (MA) crosses above a long-term moving average. The technical indicator suggests a change of bias for the token, from bearish to bullish.
On the XTZ vs. Bitcoin chart presented by the analyst, the 100-day MA (blue wave) finally approached the 200-day MA (red wave) close enough to cross over. Mr. Van de Poppe is certain the golden cross will bring more bullish momentum to XTZ, boosting the price in the bitcoin-quoted markets.
What is Tezos?
Tezos is a platform for deploying smart contracts. The structure of Tezos is similar to that of Ethereum or Cardano. The network was created by Artur Breitman, a quantitative analyst who previously worked for banking giants such as Goldman Sachs and Morgan Stanley. The white paper of Tezos was released in 2014. However, the XTZ took off in late 2017. The token’s all-time high value peaked at $12.1 in December of 2017.
Tezos platform uses an energy-efficient proof-of-stake algorithm to back the transactions. It is currently the 36th cryptocurrency, with a market cap of $3.03 billion.
Read more: Tezos Integrated Into Wolfram Blockchain Platform
XTZ against USD stats
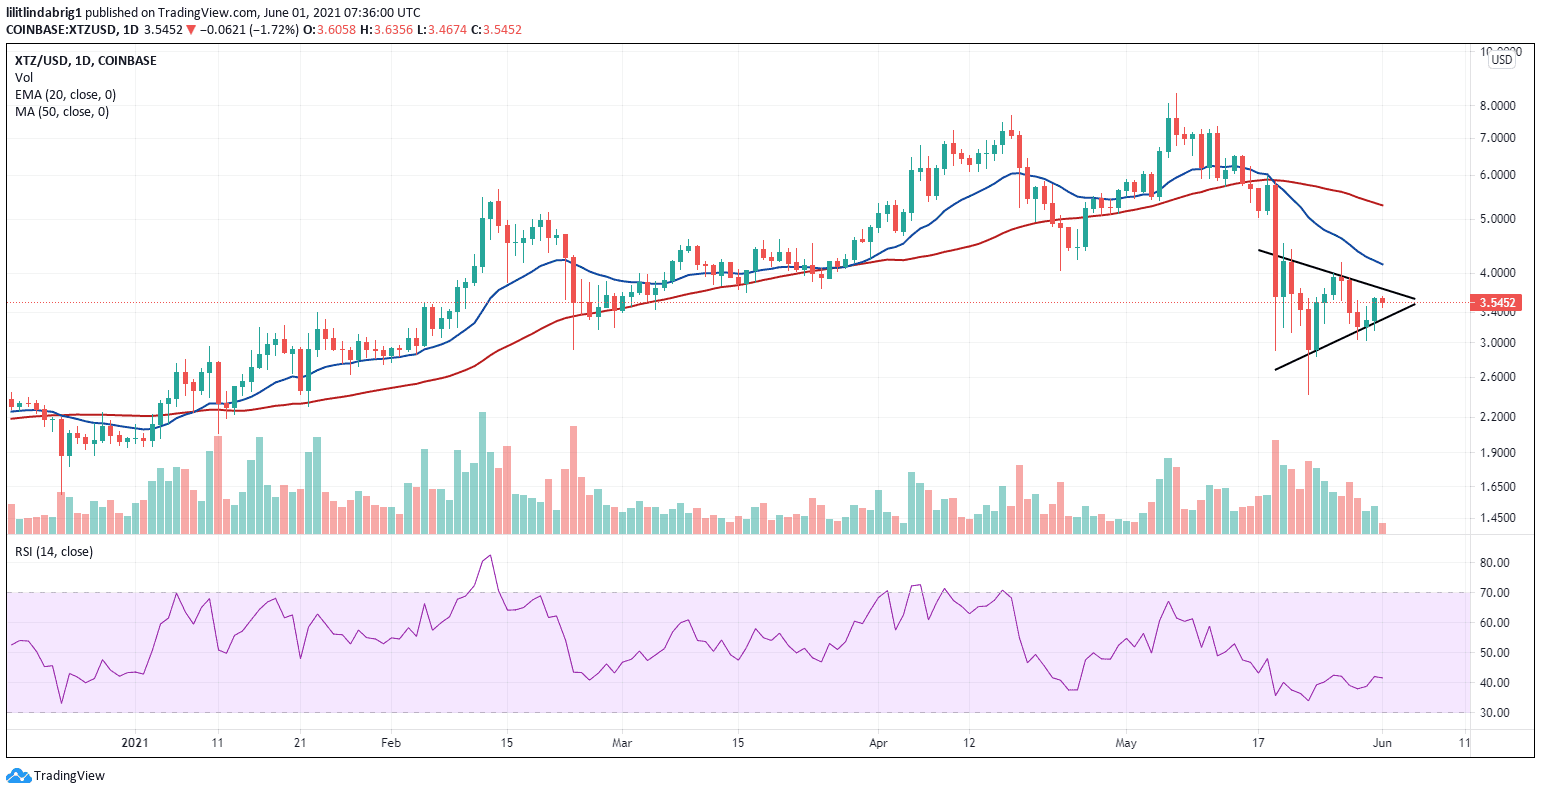
Tezos traded at $3.55 against the USD in the European session Tuesday.
However, XTZ’s trajectory on the chart against USD looks grimmer, as the token seemed to be forming a bearish symmetrical triangle. The symmetrical triangle consists of two lines with a similar slope. The support line prevents breakdowns, and the resistance line acts as a ceiling for sharp bullish attempts.
The formation is neutral, and the sessions preceding the pattern determine the continuation bias. Tezos was bearish before the triangle. Therefore, more losses are possible after the formation is complete. If this pattern prediction pans out, the XTZ price could go as low as $2.02.
Michael Van de Poppe saw a golden cross between the MA-100 and MA-200 on the trading chart against Bitcoin. The formation shows a long-term bullish potential. The XTZ daily chart against USD, however, has signs of bearish continuation.
At the moment of writing, Tezos can take either route, as both bearish and bullish outcomes are possible.
Read more: Another Tesla-Like Billion Dollar Investment is Flying into Bitcoin Market?

… [Trackback]
[…] Here you can find 63162 additional Info on that Topic: coinchapter.com/a-100-200-ma-golden-cross-appears-on-tezos-xtz-charts-what-does-it-mean/ […]
… [Trackback]
[…] Find More here on that Topic: coinchapter.com/a-100-200-ma-golden-cross-appears-on-tezos-xtz-charts-what-does-it-mean/ […]
… [Trackback]
[…] Find More Information here to that Topic: coinchapter.com/a-100-200-ma-golden-cross-appears-on-tezos-xtz-charts-what-does-it-mean/ […]
… [Trackback]
[…] Info to that Topic: coinchapter.com/a-100-200-ma-golden-cross-appears-on-tezos-xtz-charts-what-does-it-mean/ […]