
NEW DELHI (CoinChapter.com) — Axie Infinity (AXS) has dropped 28.50% Monday to reach $46.08, almost a week after topping out near $65.32.
AXS’s downtrend stemmed primarily after its parent chain, Ronin, lost $625 million in Ether (ETH) and USDC to a security exploit. Although Ronin promised to take steps to recover funds, Aleksander Leonard Larsen, CEO of Sky Mavis, said in an interview (on Apr 7) that it might take two years to recover the lost capital.
Also Read: Axie Infinity’s Ronin Network loses $625M to hackers. The fundamental selloff also triggered a technical pattern that raised the prospects of further correction in April. Dubbed ‘death cross,’ the pattern appeared as AXS’s 20-day exponential moving average (the red wave in the chart below) moved below its 50-day EMA (the yellow wave).

AXS’s price fell to $44.5, which traders have repeatedly tested as support so far in 2022. Suppose the coin drops below it, its likelihood of falling towards $40.70. Finally, AXS supports nearly $36, which supports Axie prices between July 23, 2021, and Aug 10, 2021.
Axie Infinity’s RSI Moving Towards Oversold Region
The Axie Infinity token’s Bollinger band and relative strength index are forecasting neutral signals for AXS. However, both the indicators are moving towards the oversold region.
In detail, Bollinger bands consist of a simple moving average (middle wave) and an upper and lower band. The two bands are usually two standard deviations from the middle band. Therefore, when an asset’s prices break below the lower band, it denotes an oversold condition.
Also Read: Axie Infinity (AXS) soars 52% ahead of Origin launch.AXS prices are moving towards the lower boundary of the Bollinger bands indicator, suggesting a foray into oversold regions soon.
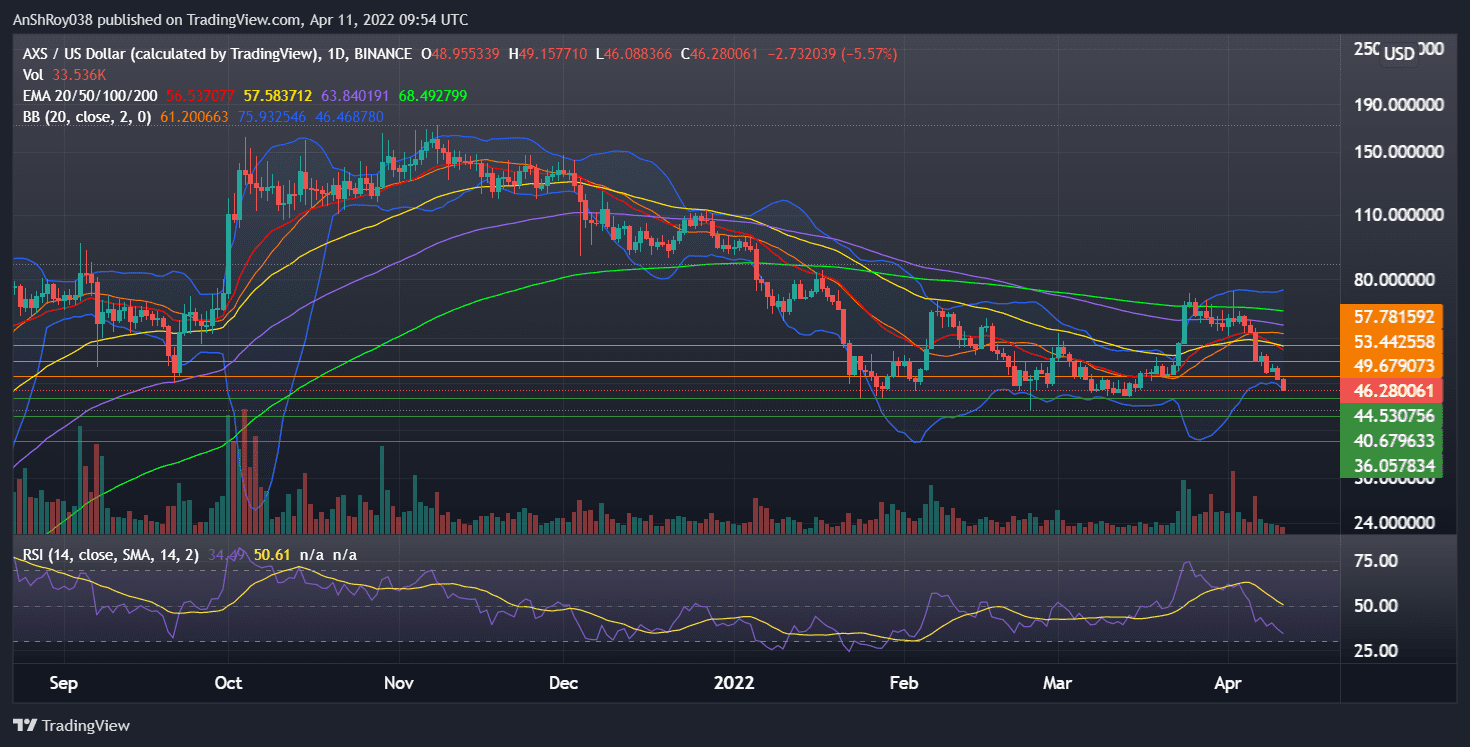
The relative strength index for AXS plummeted towards oversold levels as the token’s prices nosedived. The RSI is currently neutral, clocking 34.49 on the daily charts. In detail, the RSI measures the magnitude of recent price changes to analyze overbought or oversold conditions.
When the RSI goes below 30, the asset enters the oversold region. An oversold RSI indicates a bullish trend reversal is on the cards. When AXS becomes oversold, investors who rely on RSI would likely move in to buy the dip and trigger a rally.
If AXS starts an uptrend, the token would likely flip immediate resistance at $49.7 before moving to target resistance near $53.4. Finally, the 20-day EMA (red wave) and 50-day EMA (yellow wave) form a resistance confluence near $57.8, likely rebuffing AXS’s upside movement.
At the time of writing, AXS was trading at $46, down 6.2% on the day.

News on crypto regulations
… [Trackback]
[…] Info on that Topic: coinchapter.com/axie-infinity-axs-prices-continue-to-fall-in-the-fallout-of-ronin-hack/ […]
… [Trackback]
[…] There you can find 79540 more Information on that Topic: coinchapter.com/axie-infinity-axs-prices-continue-to-fall-in-the-fallout-of-ronin-hack/ […]
… [Trackback]
[…] Info on that Topic: coinchapter.com/axie-infinity-axs-prices-continue-to-fall-in-the-fallout-of-ronin-hack/ […]
… [Trackback]
[…] Info to that Topic: coinchapter.com/axie-infinity-axs-prices-continue-to-fall-in-the-fallout-of-ronin-hack/ […]
… [Trackback]
[…] Info to that Topic: coinchapter.com/axie-infinity-axs-prices-continue-to-fall-in-the-fallout-of-ronin-hack/ […]