

PATNA (CoinChapter.com) — The cryptocurrency markets seemed to be heading for a bleak weekend on Oct 21, with several crypto tokens registering consecutive losses in the current week.
The lack of bullish catalysts for the major cryptocurrencies, coupled with other macroeconomic and geopolitical cues, has left the crypto market firmly in the grips of the bears. Here are some crypto tokens that have had a particularly bad week.
1. Energy Web Token (EWT) Price Analysis
EWT price’s relief rally helped the crypto token break above its short, medium, and long-term EMA lines within a day. However, the trend reversed after EWT’s RSI, currently neutral at 50.69, became overbought on Oct 18.
Since then, the token has lost nearly 26% as it fell from Oct 19’s high of $5.4 to an intraday low of $4.06 on Oct 21. The bulls currently defend the 20-day EMA (red wave) and 200-day EMA (green wave), which EWT prices needled below on Friday.
If EWT prices fail to hold above the EMA, the cryptocurrency token would likely fall to test key support from its 100-day EMA (blue wave) near $3.8. EWT prices have tested its 100-day EMA support multiple times (green arrow) since Aug this year.
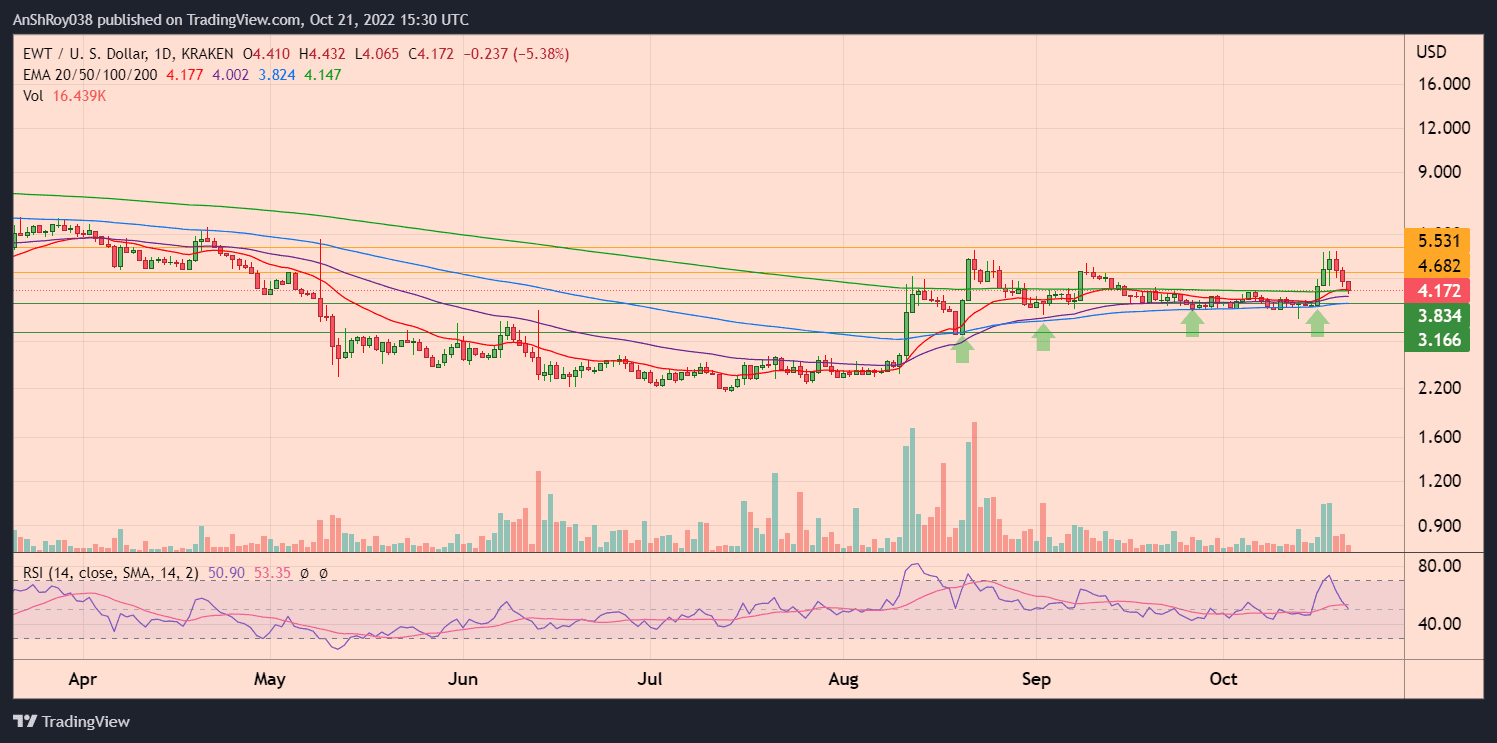
A break below key support might see the token fall to support near $3.16, another 25% from current levels.
Conversely, if EWT bulls successfully defend current support, the crypto token would likely rebound to target immediate resistance near $4.7. Moreover, a strong uptrend might help EWT prices jump nearly 33% to $5.53 before corrections pare gains.
2. Axie Infinity (AXS) Price Analysis
AXS prices 20-day EMA (red wave) and 50-day EMA (purple wave) have been acting as a dynamic resistance for the token since Aug 17 this year. The crypto token is down over 23% between Oct 18’s high ($11.3) and Oct 21’s low ($8.64) levels.
Though Friday’s daily candle’s long lower wick suggests bulls are trying to stage a comeback, but the downward sloping EMAs highlight AXS’ bearish pressure. Furthermore, the downtrend forced AXS prices to levels last seen in Jul 2021.
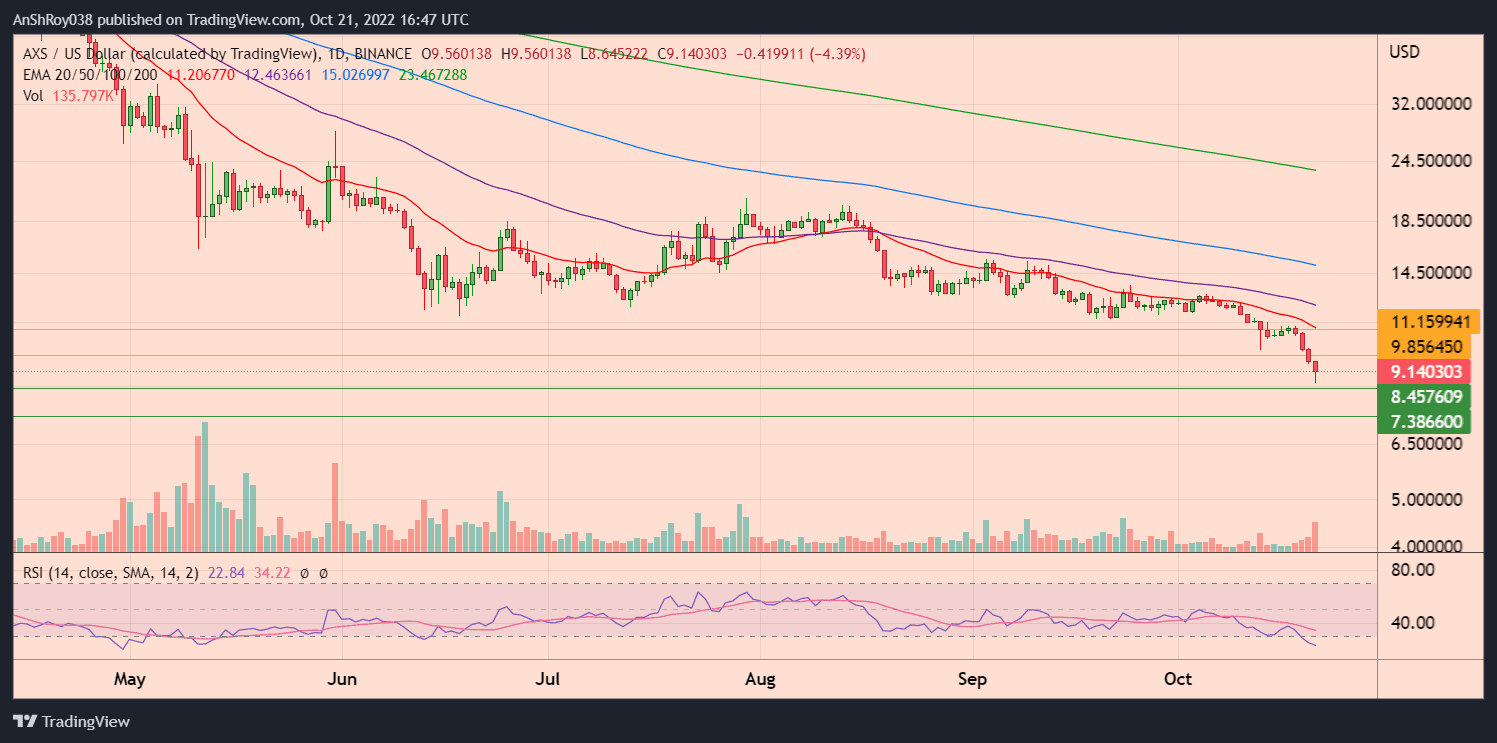
If the downtrend continues, AXS prices might fall to support near $8.46. Furthermore, a marketwide sell-off might see AXS prices test support near $7.4 before recovering.
Meanwhile, the Axie Infinity token’s RSI is in the oversold regions, with a value of 22.84 on the daily timeframe. An oversold RSI often attracts buyers to the market, since the indicator usually preludes a bullish trend reversal.
Also Read: SEC vs. Ripple Update: Defendants Oppose To Plaintiff’s Motion For Summary JudgmentHence, AXS bulls might try to raise the crypto token’s prices to challenge immediate resistance near $9.85. Moving above immediate resistance would likely see AXS prices rise to $11.2 before corrections pare gains.
3. Reef Finance Coin (REEF) Price Prediction
REEF prices followed the wider crypto market’s downtrend, as an overbought RSI resulted in a trend reversal for the crypto token on Oct 19. REEF prices dropped from Oct 19’s high of $0.0076 to reach an intraday low of $0.0063, shedding more than 17% of its gains.
The downtrend forced REEF prices to test the 200-day EMA (green wave) support, where the bulls seems to be struggling. A break below the 200-day EMA support would drop REEF prices to support from its 20-day EMA (red wave) near $0.00617.

Breaking below immediate support could result in the token testing support from the multi-week ascending trendline support near $0.0056 before recovering.
Conversely, if bulls manage to hold and close above the 200-day EMA support, REEF prices might rebound and target resistance near $0.00676. Furthermore, a reversal could attract more buyers, helping the crypto token rise to $0.00764 before retreating.
4. SushiSwap Crypto (SUSHI) Price Chart
SUSHI prices had been crabbing after gaining nearly 17% on Oct 14, before the token dropped over 8% on Oct 20. The crypto token forayed below the 100-day EMA (blue wave) and 20-day EMA (red wave) support on Oct 21, at one time nearly obliterating the gains of Oct 14.
However, bulls aggressively defended the EMA supports, pushing prices up. If bulls manage to break and close above 100-day EMA, SUSHI prices might rise to $1.47. In addition, breaking above immediate resistance could help SUSHI prices target resistance near $1.61 before retreating.

However, if bears break below the 200-day EMA support, SUSHI prices might fall to test support from a confluence of 50-day EMA (purple wave) and a multi week ascending trendline near $1.28. A marketwide downtrend could result in SUSHI price testing support near $1.12 before recovering.
5. Injective Coin (INJ) Price Prediction
INJ prices fell more than 23% in the current week, going from Oct 17’s high of $2.29 to reach an intraday low of $1.76 on Oct 21. However, the crypto token has been painting higher lows since Jul 2022. As such, it seems INJ bulls are bucking against the wider market trends.
Also Read: Turkish Central Bank Slashes Interest Rates Again Amid 83% InflationThe downtrend resulted in INJ prices falling below their 20-day EMA (red wave) and 100-day EMA (blue wave) before bulls moved to defend the 50-day EMA (purple wave support).

If the crypto token breaks and consolidates above its 20-day and 100-day EMA, INJ prices might start an uptrend and target resistance near $1.96. A break above immediate resistance could help INJ prices rise to $2.21 before retreating.
Conversely, if the crypto token’s price continues to fall, INJ might end up re-testing support from its 50-day EMA (purple wave) near $1.75. A marketwide sell-off could see INJ prices fall 14.2% to support near $1.57 before recovering.
6. Kusama Token (KSM) Price Analysis
Kusama prices have been in a downtrend since Oct 10, with the crypto token losing 22.6% between Oct 10’s high of $44.3 and Oct 21’s low of 34.31. The decline in brought KSM prices to levels last seen in Nov 2020.
Though bulls are trying to defend the lower price levels, the negative-sloped EMA trendlines highlight the bearish pressure on Kusama. If KSM prices continue to fall, the crypto token might end up testing support near $33.32.

Strong bearish pressure might push KSM prices down to test support near $29.9 before recovering.
Meanwhile, a silver lining for the bulls comes from the crypto token’s oversold RSI, clocking at 26.74 on the daily charts. In detail, an oversold RSI often predicts a bullish trend reversal for an asset, which might attract buyers to the market.
As a result, KSM prices might rise to challenge resistance near $36.4. A break above immediate resistance would help the crypto token target resistance from its 20-day EMA (red wave) near $39.7 before retreating.
Read here to know why Elon Musk buying Twitter might be a bad news for the social media giant’s employees.

… [Trackback]
[…] Here you can find 94384 more Information to that Topic: coinchapter.com/biggest-crypto-losers-today-ewt-axs-reef-finance-sushi-inj-ksm-token/ […]
… [Trackback]
[…] Find More on that Topic: coinchapter.com/biggest-crypto-losers-today-ewt-axs-reef-finance-sushi-inj-ksm-token/ […]
… [Trackback]
[…] Here you can find 22853 additional Info to that Topic: coinchapter.com/biggest-crypto-losers-today-ewt-axs-reef-finance-sushi-inj-ksm-token/ […]