
YEREVAN (CoinChapter.com) — Cardano (ADA) price had a rough quarter, along with other leading cryptos on the market.
ADA’s price dropped over 60% from April 1 to $0.45, its losses led by similar downside moves across other top-ranking crypto assets, including Bitcoin (BTC) and Ethereum (ETH). The Cardano token entered a consolidation phase in May, giving a choppy performance since.
Cardano price could dip 50%
ADA has been consolidating inside a horizontal channel since May 2022.
In doing so, the Cardano price has been fluctuating between two parallel, horizontal lines, which, as per technical rules, signals a trend continuation if the price breaks out of the channel.
In other words, traders can expect another leg down if the Channel formed after a drop. Moreover, the estimated continuation would be equal to the preceding decline. Thus, the Cardano price target would be $0.22, or over 50% lower than the current value.
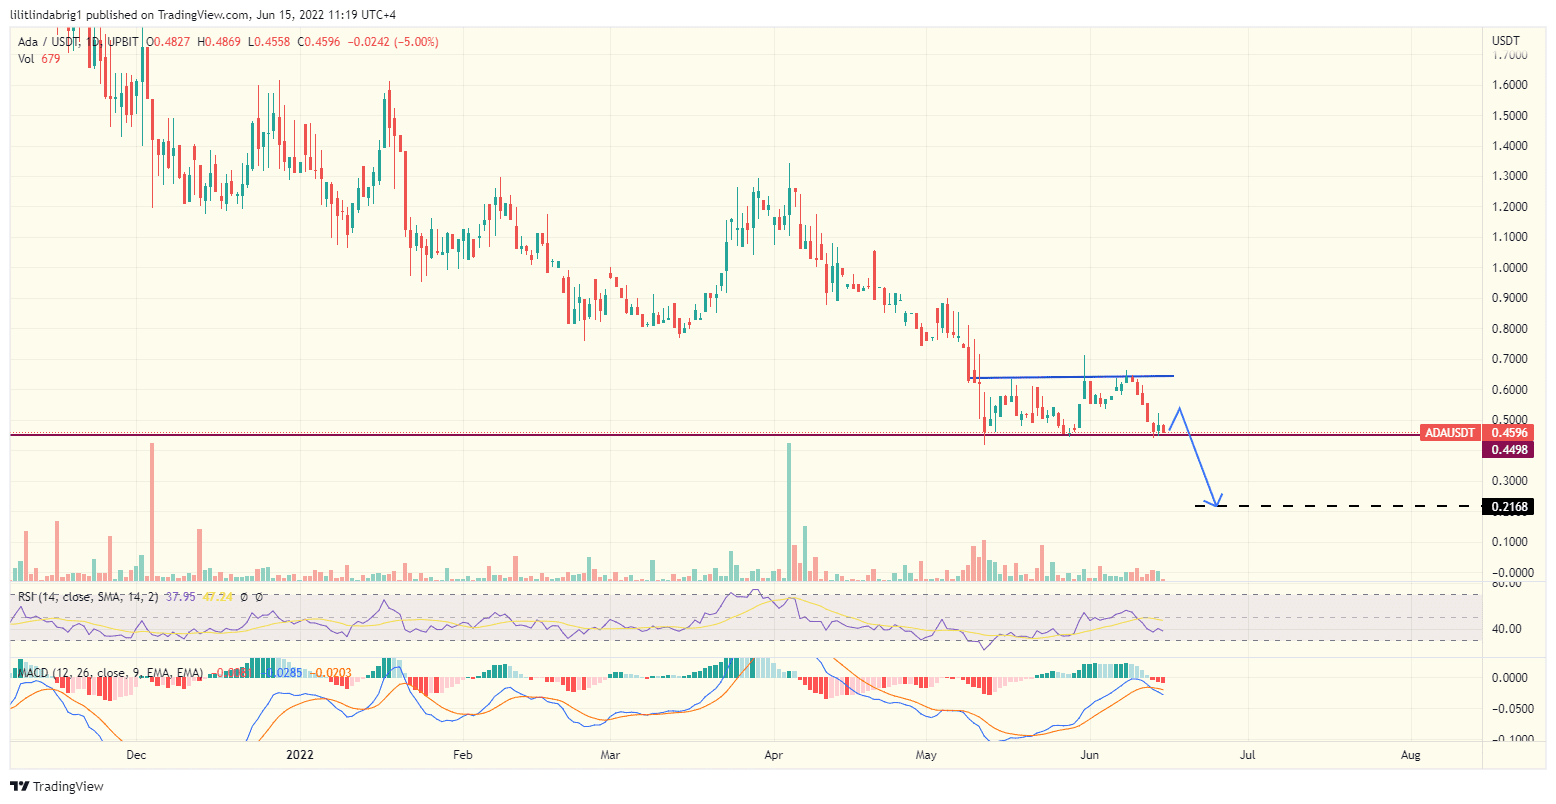
Also read: Cardano risks another 72.5% price crash as ADA breaks out of 'bear flag' pattern.The gradually declining trading volumes supported the assumption and show insufficient efforts for a bullish move. However, the weekly chart might have good news for Cardano price bulls.
RSI at a three-year low
The weekly chart hinted at a possible trend reversal for ADA, based on an oversold relative strength index (RSI). In detail, the RSI is a momentum indicator that marks profitable market entry and exit points. In short, it shows a token price deviation from a median value in a certain period.
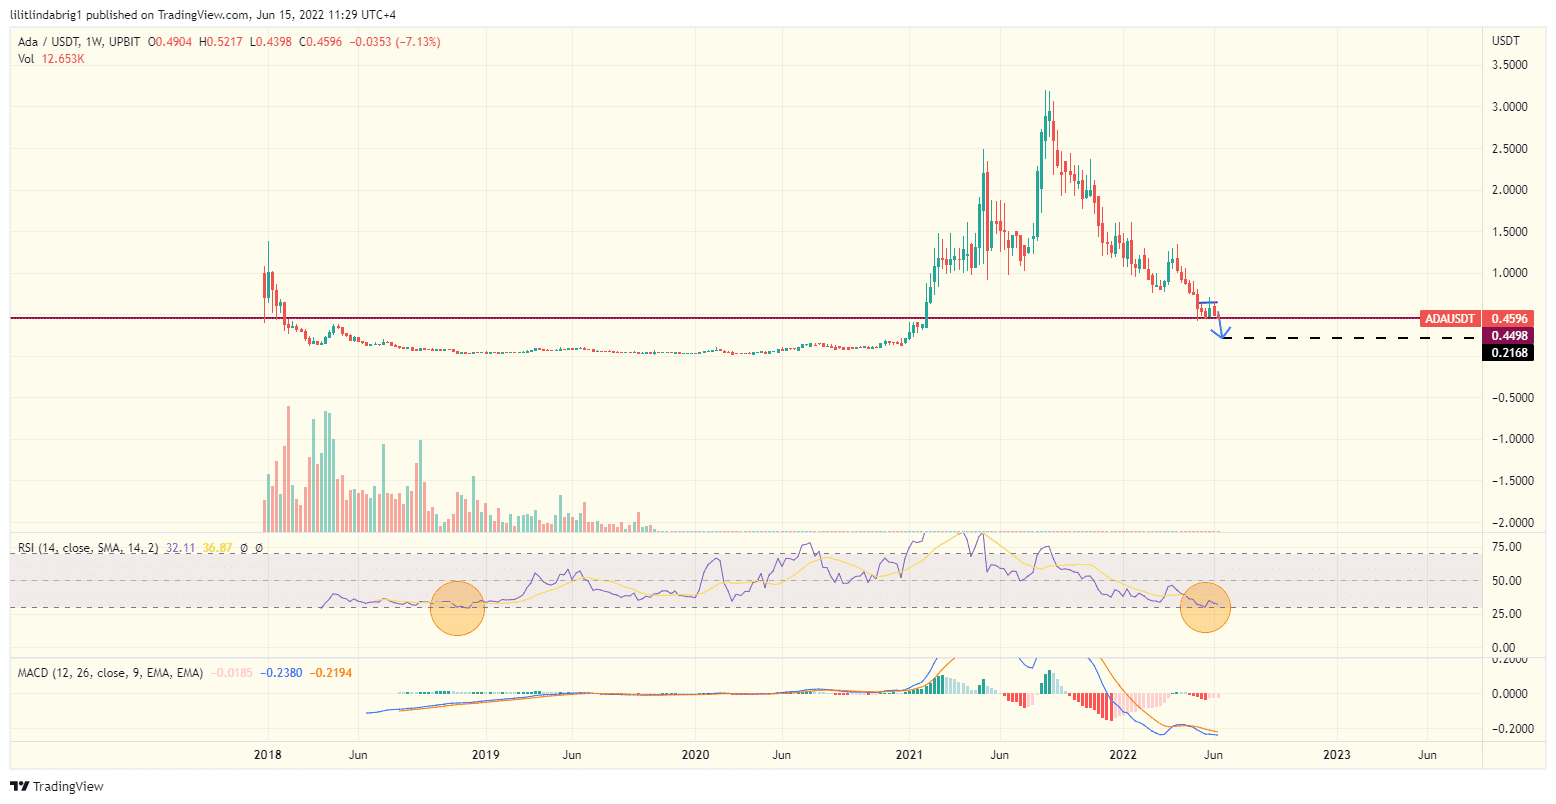
When the RSI graph (purple on the chart above) reaches higher than the 30-70 range, traders might consider the token overbought and take profits.
Conversely, an oversold RSI below 30 indicates a possibly profitable entry, meaning traders could double down, buy the underpriced asset and subsequently raise its value.
Also read: Cardano (ADA) soars over 50% in four days — a bull trap?Moreover, ADA’s RSI fell to a three-year low on the weekly chart, which could intensify bullish expectations. However, Cardano is dependent on a flurry of factors outside its technicals. For example, the general climate in the crypto market remains bearish.
Additionally, the broader market grapples with growing inflation, Federal Reserve’s aggressive rate hike plans, the ongoing war in Ukraine, and skyrocketing prices for fuel oil. Thus, expectations from individual digital assets remain rather modest, given headwinds from the fiat economy.

… [Trackback]
[…] There you will find 46134 additional Info to that Topic: coinchapter.com/cardano-price-ada-oversold/ […]
… [Trackback]
[…] Read More Information here to that Topic: coinchapter.com/cardano-price-ada-oversold/ […]
… [Trackback]
[…] Read More Information here to that Topic: coinchapter.com/cardano-price-ada-oversold/ […]
… [Trackback]
[…] Read More Info here on that Topic: coinchapter.com/cardano-price-ada-oversold/ […]
… [Trackback]
[…] Find More Info here on that Topic: coinchapter.com/cardano-price-ada-oversold/ […]