
Key Takeaways:
- An analyst stated that Chainlink would likely surpass Ethereum in market cap.
- LINK price currently consolidating after a recent surge.
- The Chainlink crypto token has formed a bearish pattern.
NEW DELHI (CoinChapter.com) — Chainlink’s (LINK) recent partnerships and developments might help the blockchain oracle platform surpass Ethereum (ETH) in market cap, said an analyst.
Going by the X username UnrealApe Memecoin, the analyst explained that the blockchain platform’s partnership with the Society for Worldwide Interbank Financial Telecommunications (SWIFT) might help Chainlink see greater adoption.
The analyst noted that Chainlink was forming a network of interoperability with real-world applications. With CCIP and SWIFT partnerships, it will become “a universal plug, connecting anything and everything to the blockchain.“

Furthermore, UnrealApe Memecoin highlighted that Chainlink also offers scalability, computation services, and cross-chain connectivity. These features would likely make it the go-to hub for developers.
Additionally, Chainlink has the potential to generate revenue from public and private ecosystems both.
A higher market cap than #Ethereum? The sky is the limit when you’re building bridges where others see gaps.
the analyst stated.Moreover, diverse service offerings at competitive prices also give Chainlink an advantage.
LINK Price Consolidates After Reaching Yearly Highs
The Chainlink crypto token started a bull run on Oct. 20 that saw its price spike over 63% to reach a daily high near $11.9 on Oct. 30. LINK price’s recent rally also propelled the crypto token to its highest level since May 2022.
However, bearish pressure against the Chainlink token is high, evident from the long upper wicks on its recent daily candles.
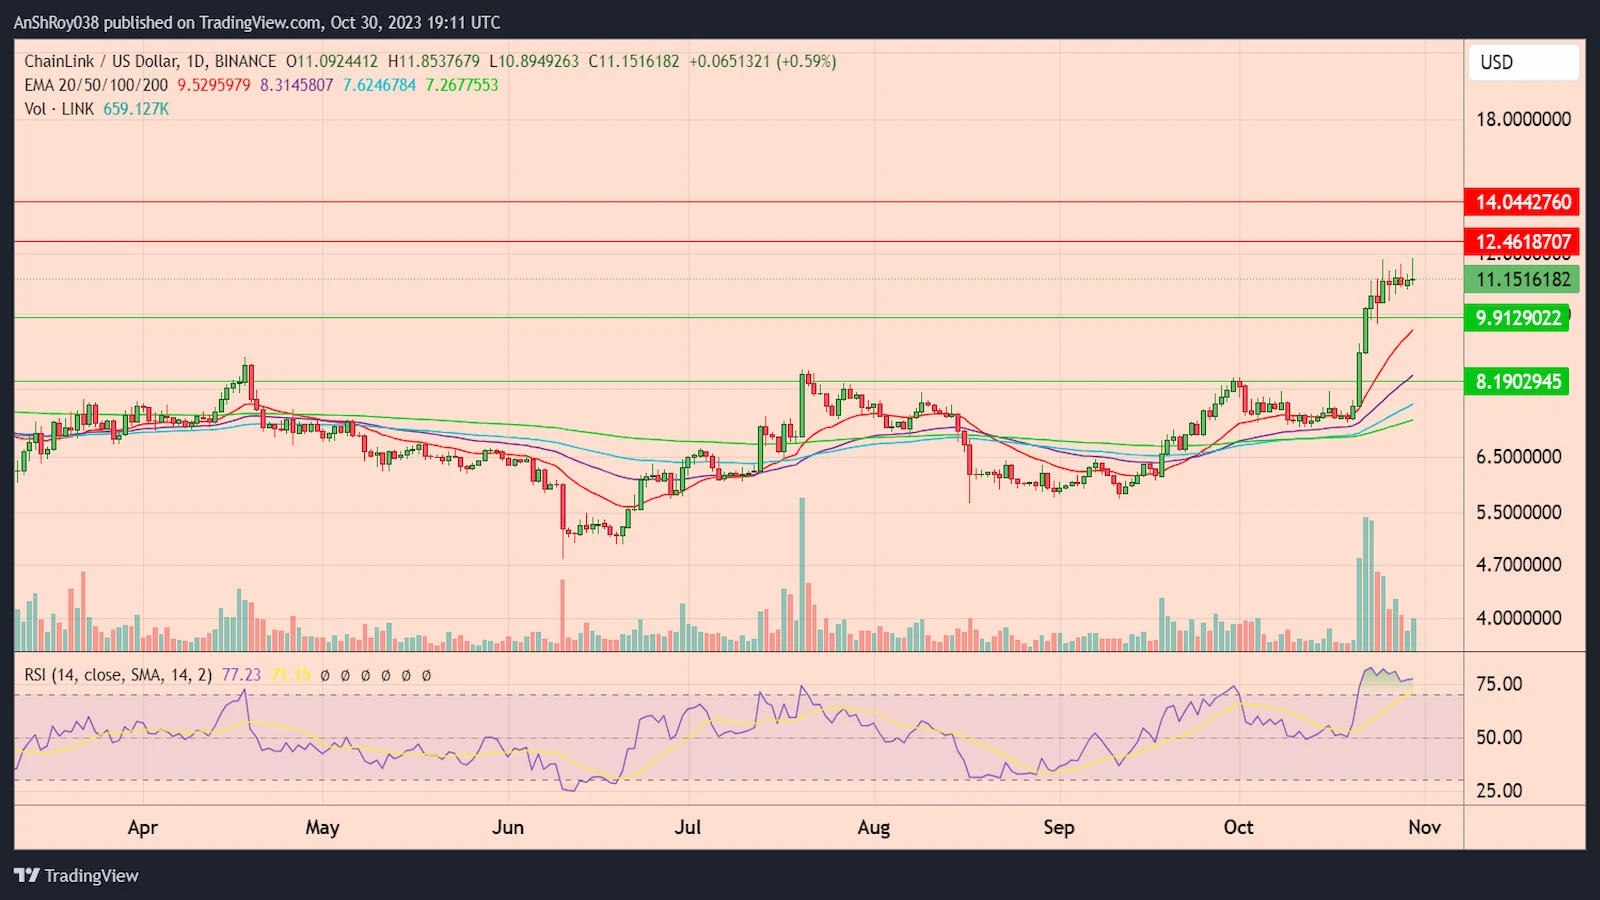
Moreover, the overbought RSI levels, with a score of 77.23 on the daily timeframe, might add to the bearish cues against LINK. Overbought RSI levels often precede a correction or consolidation phase for an asset, and it’s the latter happening for the LINK price.
However, if LINK price buckles under the selling pressure, bulls would have to defend the support near $10. A breakdown below the immediate support could force the LINK price to test the 50-day EMA (the purple wave) support near $8.2.
Conversely, if the Chainlink crypto token restarts its price rally, bulls would target the resistance near $12.5. A breakout above the immediate resistance might help the LINK price reach the resistance near $14 before corrections pare gains.
Chainlink Token Moving Inside Bearish Pattern
LINK price has formed a bearish technical pattern called the ‘Descending Triangle.’
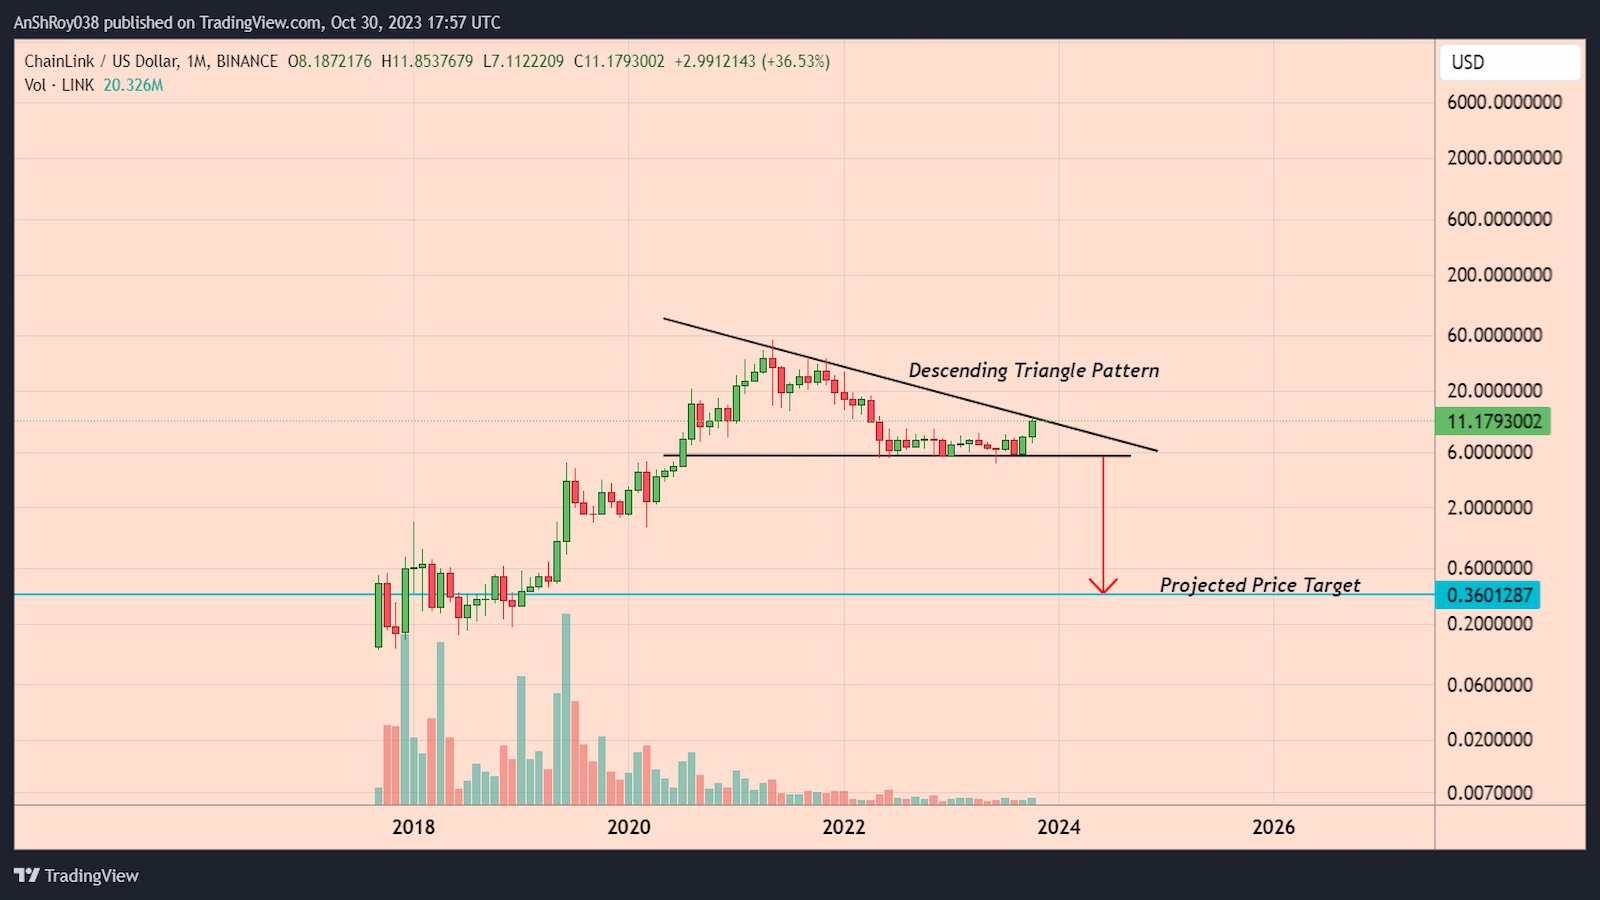
A descending trendline connecting swing highs and a horizontal trendline joining swing lows form the pattern. The height of the triangle’s thickest section determines the price target in a descending triangle setup.
The pattern gives LINK prices a theoretical breakdown target nearly 97% below its current price to reach $0.36.

… [Trackback]
[…] Info on that Topic: coinchapter.com/chainlink-market-cap-will-surpass-ethereum-analyst/ […]
… [Trackback]
[…] Info to that Topic: coinchapter.com/chainlink-market-cap-will-surpass-ethereum-analyst/ […]
… [Trackback]
[…] Information on that Topic: coinchapter.com/chainlink-market-cap-will-surpass-ethereum-analyst/ […]
… [Trackback]
[…] Find More Information here to that Topic: coinchapter.com/chainlink-market-cap-will-surpass-ethereum-analyst/ […]
… [Trackback]
[…] Read More here on that Topic: coinchapter.com/chainlink-market-cap-will-surpass-ethereum-analyst/ […]
… [Trackback]
[…] Info to that Topic: coinchapter.com/chainlink-market-cap-will-surpass-ethereum-analyst/ […]
… [Trackback]
[…] Information on that Topic: coinchapter.com/chainlink-market-cap-will-surpass-ethereum-analyst/ […]
… [Trackback]
[…] Read More Information here on that Topic: coinchapter.com/chainlink-market-cap-will-surpass-ethereum-analyst/ […]