Key Takeaways:
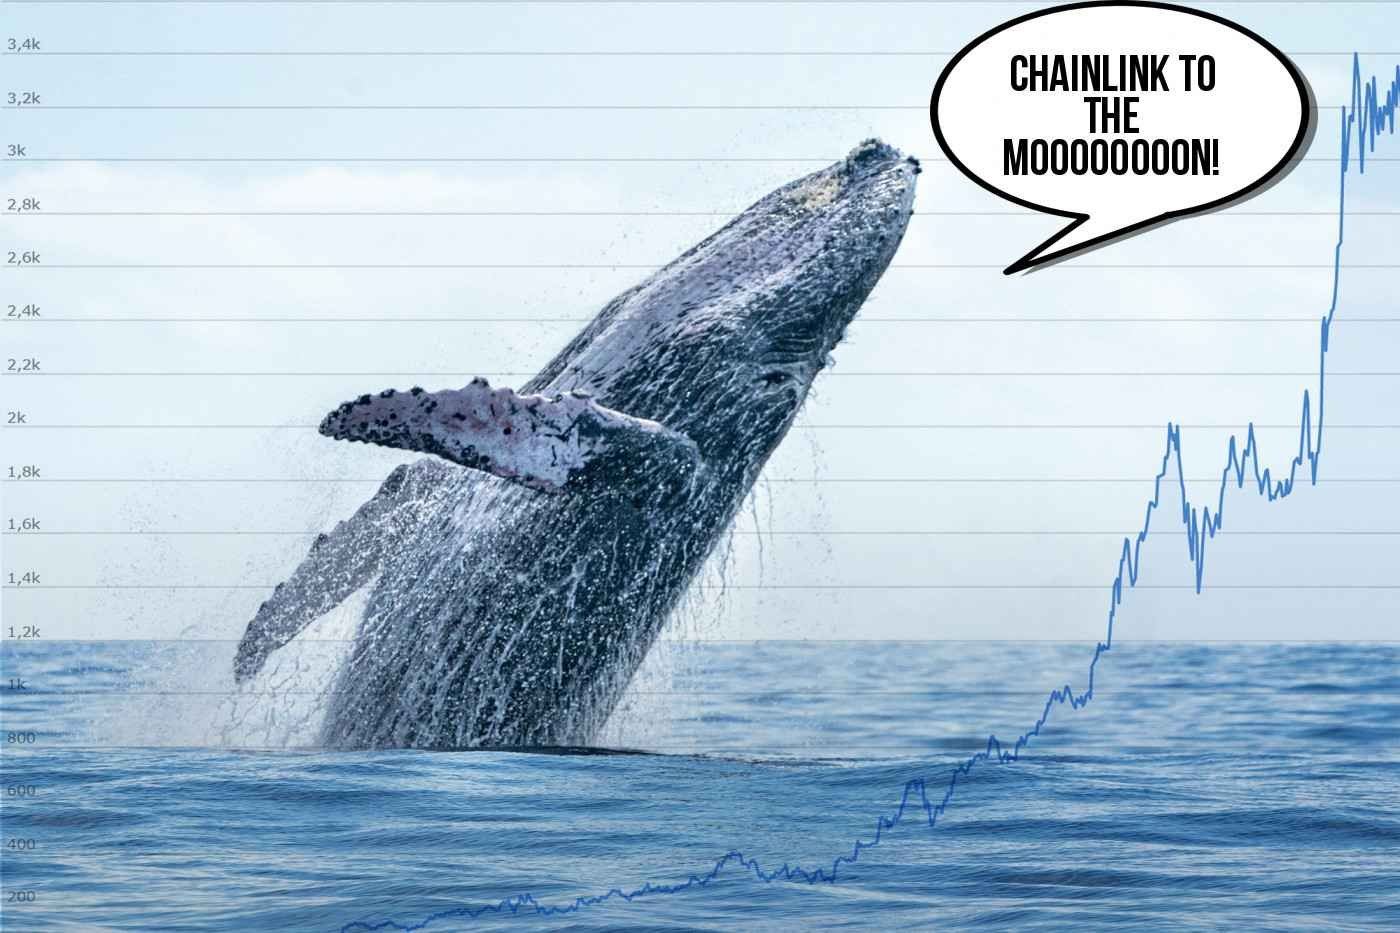
- ChainLink whales have been on a spree, buying over $38 million in tokens.
- LINK price has been rallying since Oct. 13.
- The token has formed a bearish technical pattern.
NEW DELHI (CoinChapter.com) — Chainlink (LINK) has received increased interest from whale investors, according to on-chain data provider Santiment.
The firm shared in an X post that investors with 100,000 to 1 million LINK tokens, or whales, have been aggressively accumulating over the past seven days. Whale transactions are significant since their huge volume can often dictate market movement for an asset.
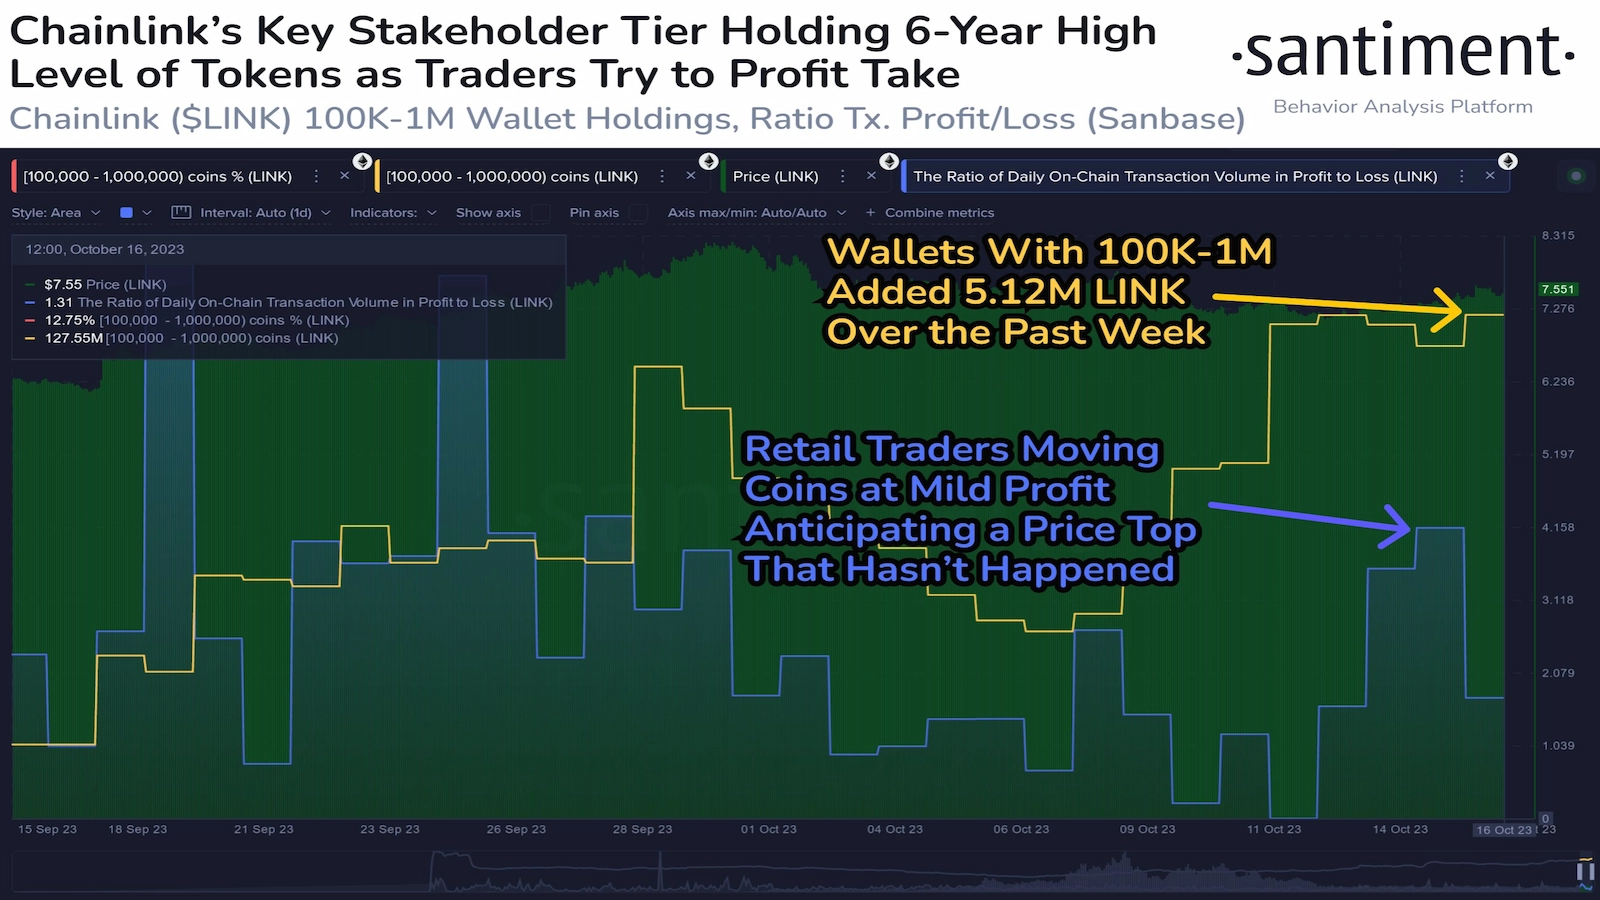
The blockchain data provider highlighted that the whales added 5.12 million LINK tokens (worth $38.5 million at the time) in seven days, suggesting that large investors have a positive outlook for the Chainlink token’s future price action.
Additionally, Santiment noted that though retail investors are booking profits, the whale transaction volume rendered the bearish pressure from profit booking moot.
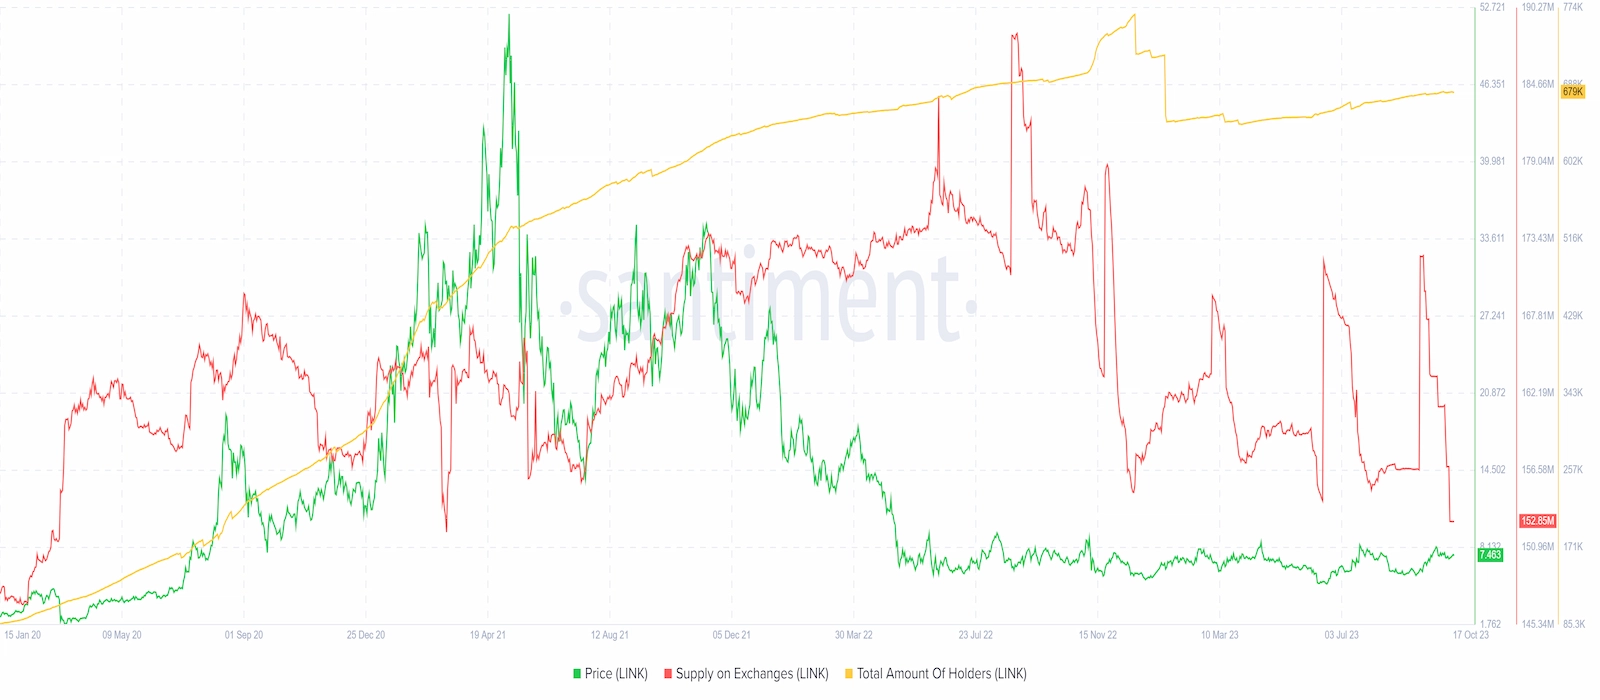
Furthermore, LINK’s supply on exchanges has plummeted to its lowest since March 2021. A decline in a token’s supply on exchanges usually indicates a hodling sentiment among investors.
Moreover, when investors start hodling, it decreases the token’s supply, thereby acting as a bullish cue if demand increases. In addition, the number of LINK holders continues to increase, suggesting that market participants might be bullish on the token’s price action.
Chainlink’s involvement with the Society for Worldwide Interbank Financial Telecommunications (SWIFT) blockchain interoperability experiment might help add bullish cues for its token.
The partnership would likely increase the oracle network’s adoption, which may help its token rally in Q4 2023. However, bearish risks remain for the Chainlink token, including a bearish technical pattern.
LINK Price Rally Succumbs To Bearish Pressure
Despite the bullish cues and a generally positive market outlook, it seems bears are in control of the Chainlink token’s price action. Long upper wicks on recent daily price candles highlight the bearish pressure against LINK prices.
The bearish pressure also forced LINK price to end its bull run that began on Oct. 13, with the token dropping 1.6% on Oct. 17 to reach a daily low near $7.43.
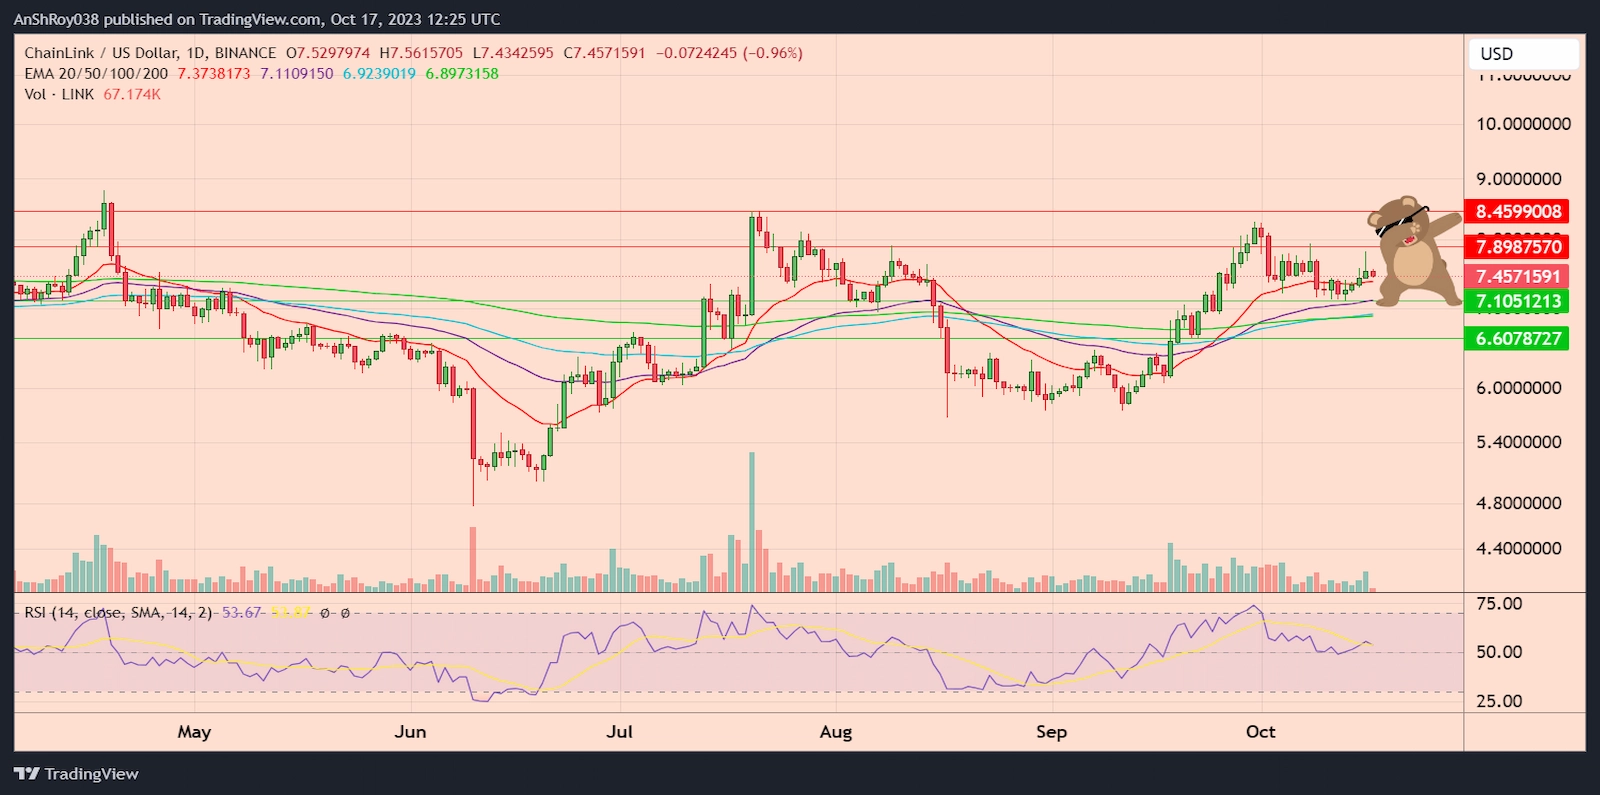
If the bears continue selling, the LINK price could drop to the 50-day EMA (purple wave) support near $7.1. Moreover, breaching the immediate resistance might result in LINK price testing the support near $6.61.
Conversely, if bulls arrest the token’s drop above the 20-day EMA (red wave) dynamic resistance, LINK price could rally to the resistance near $7.9 before targeting the resistance near $8.5.
The RSI for LINK remained neutral, with a score of 53.67 on the daily charts.
ChainLink Token Price Moving Inside Bearish Pattern
Meanwhile, the LINK price has formed a bearish technical pattern called the ‘Bear Flag.’
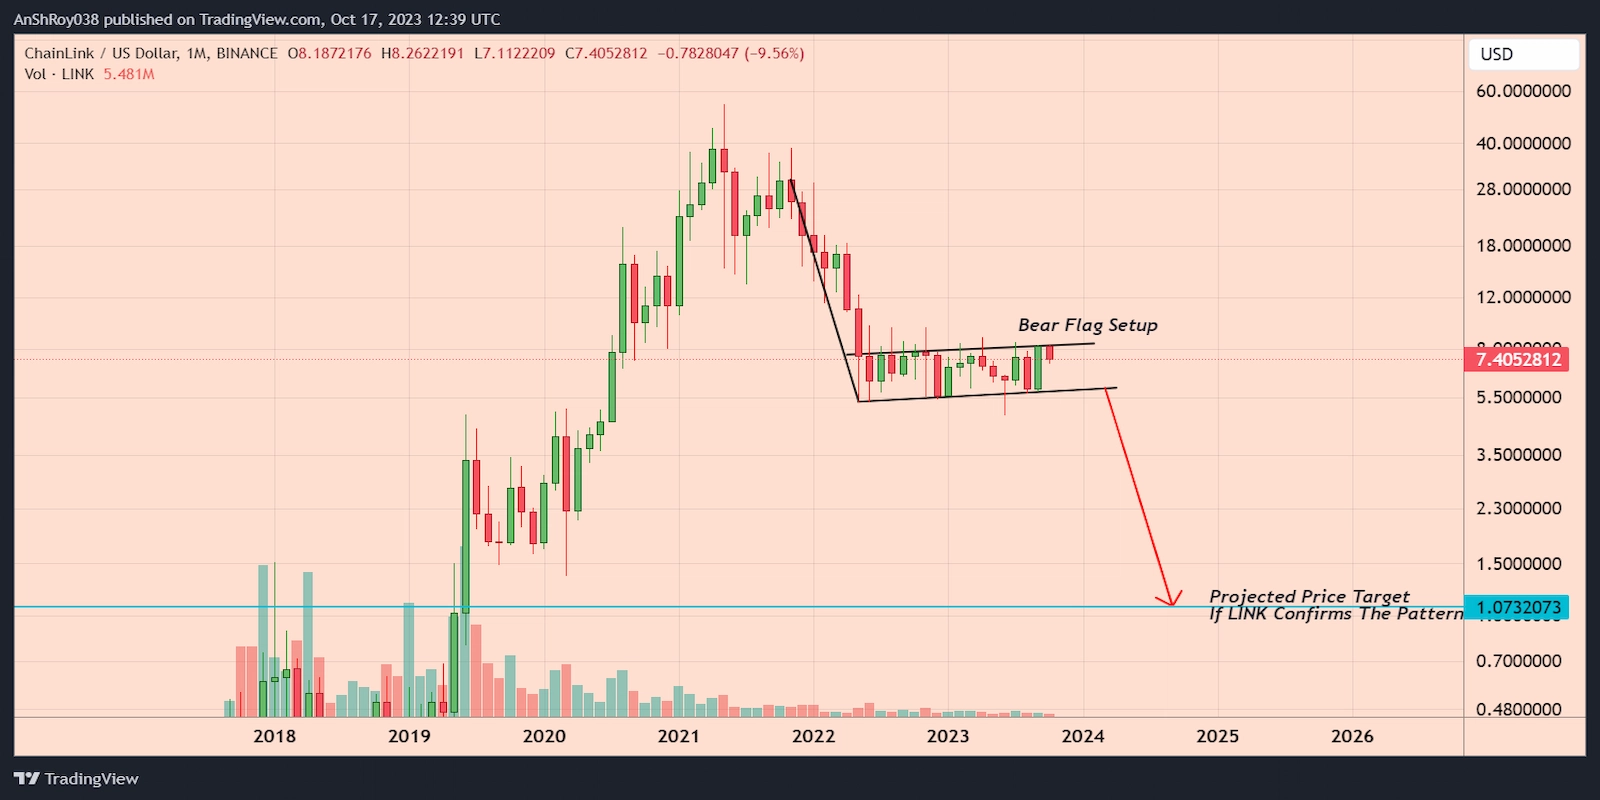
In detail, the pattern forms when a cryptocurrency’s price charts a sharp countertrend (the flag) after a short-lived trend. Flag patterns usually indicate a reversal of the countertrend. In addition, in a bearish pattern, volume might not always decline during consolidation.
Since an uptrend marks the consolidation period after a sharp downtrend, investors move in due to FUD from the price fall. Hence, higher-than-average volumes often accompany the consolidation period.
Traders calculate the bear flag pattern’s price target by subtracting the flagpole’s length from the breakout price level. Hence, if the flag pattern pans out, LINK price could theoretically drop over 85% to the projected price target near $1.1.

… [Trackback]
[…] Find More on that Topic: coinchapter.com/chainlink-whales-goes-shopping-buy-38-5m-link-in-a-week/ […]
… [Trackback]
[…] There you can find 66168 more Info to that Topic: coinchapter.com/chainlink-whales-goes-shopping-buy-38-5m-link-in-a-week/ […]