
NEW DELHI (CoinChapter.com) — The cryptocurrency market continued downwards as Bitcoin (BTC) and altcoin moved within a tight range over the weekend. Traders remain undecided on market direction, likely due to Bitcoin’s recent tight correlation with the equities market.
Moreover, Apr 22’s sharp fall indicates investors are increasingly nervous about the central banks’ hawkish stance.
The cryptocurrency market’s inability to sustain an uptrend resulted in the Crypto Fear and Greed Index back into the “extreme fear” territory.
DOGE/USD
DOGE prices fell below their 20-day exponential moving average (red wave) and 50-day EMA (yellow wave) over the weekend. The memecoin started Apr 25 in the red, but bulls moved in to push prices upwards as the long lower wick on the day’s candle indicates.
If the token continues upwards, DOGE prices will challenge resistance from its 100-day EMA (purple wave) near $0.146. Moreover, a sustained uptrend would result in the DOGE token challenging resistance near $0.153, a price level DOGE price has failed to hold since Jan 21.
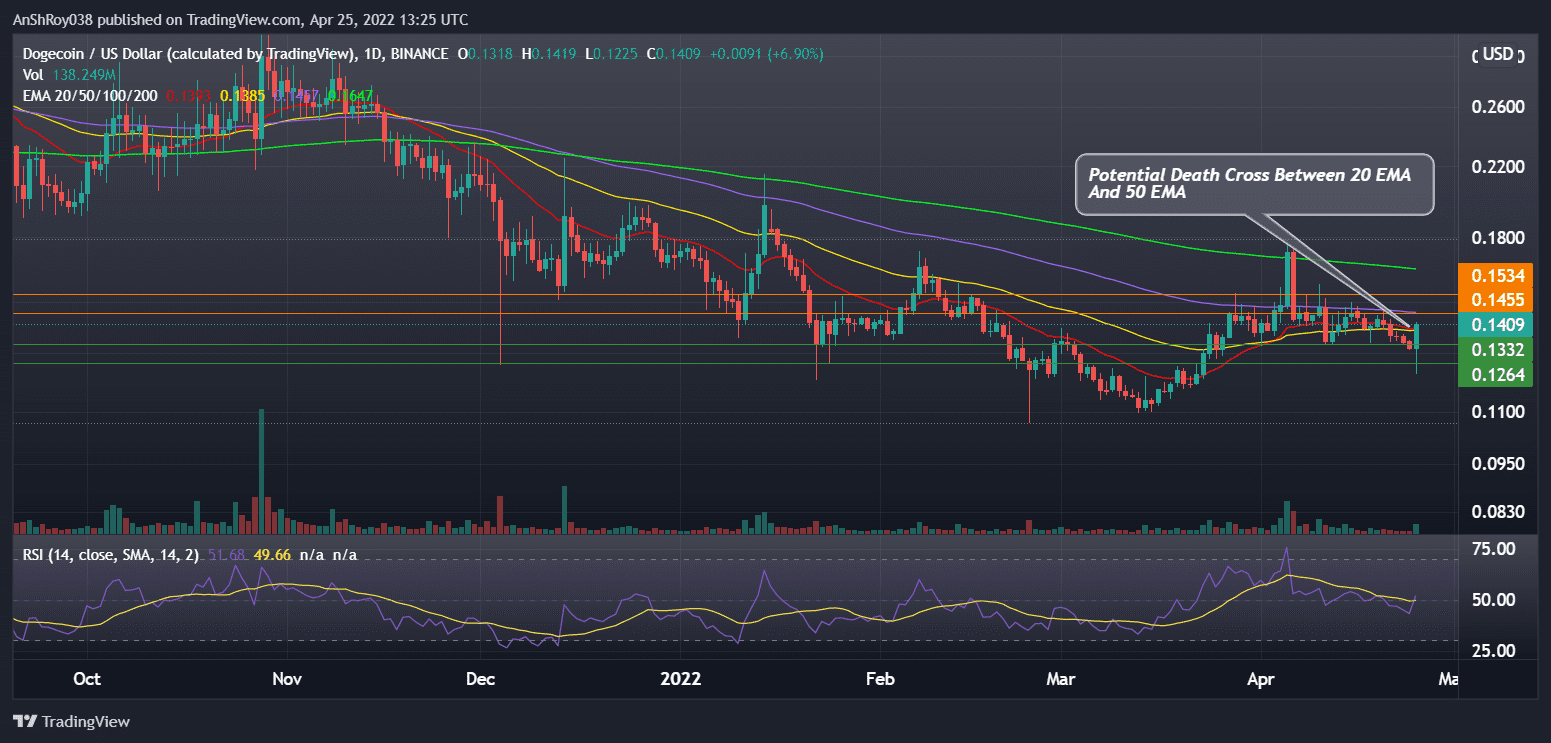
DOGE token’s relative strength index is currently neutral for the memecoin, with a value of 49.69 on the daily charts.
DOGE token’s 20-day EMA (red wave) looks poised to move below its 50-day EMA (yellow wave) to form a bearish technical pattern called the death cross, which might cause the DOGE price to continue its downtrend.
Also Read: Dogecoin rallies as Elon Musk joins Twitter board of directors.As a result, the meme cryptocurrency token prices could fall to support near $0.133, a price level that has supported the token’s price action since Mar 26. A marketwide sell-off could see prices break below immediate support to fall to $0.126 before recovering.
At the time of writing, DOGE was trading at $0.139, up 5.54% on the day.
ETH/USD
Ethereum’s Ether token (ETH) prices fell by more than 12% from Apr 21’s high of $3,179 to reach an intraday low of $2,796 on Apr 25. The prime altcoin seems to take cues from Bitcoin’s downtrend.
ETH’s 20-day EMA (red wave) looks likely to move below its 50-day EMA (yellow wave) to form a bearish technical pattern called the death cross. Traders usually consider the pattern an indicator of negative market sentiment.
Ether’s price could fall to support near $2,800. If ETH breaks below immediate support, the Ether token price could fall to $2,660 before recovering.
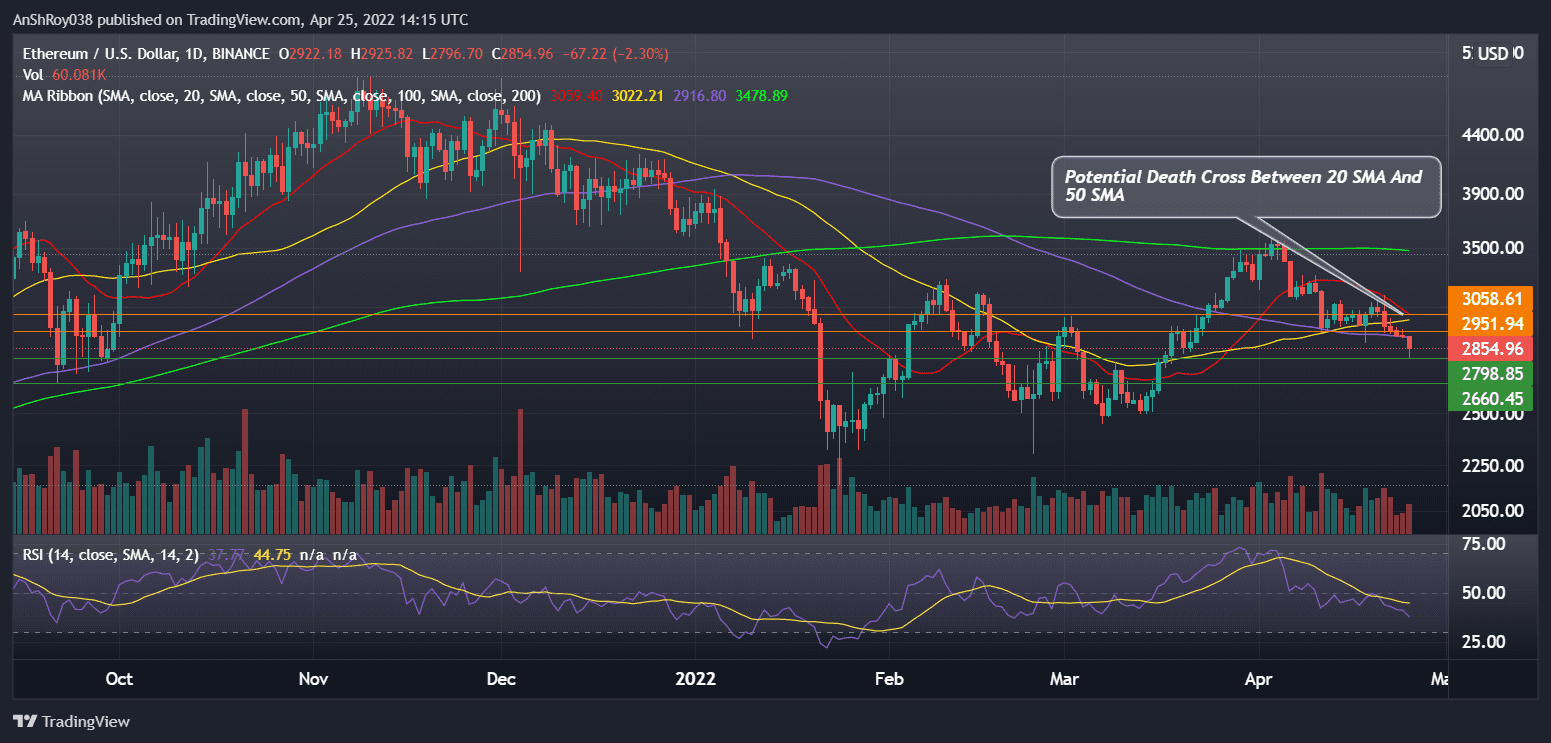
Ether’s relative strength index is currently neutral, with a value of 37.77 on the daily chart. However, ETH’s RSI trendline is moving down towards oversold levels. Traders usually consider an oversold RSI level as a buy signal.
Related: Ethereum (ETH) loses critical support at $3K as the price dips 20%If ETH’s RSI becomes oversold, the second-largest cryptocurrency prices could move above their 100-day moving average (purple wave) to challenge resistance near $2,950. On the other hand, a sustained uptrend might bring ETH’s price close to resistance near $3,060, above its 50-day MA (yellow wave).
At the time of writing, ETH was trading at $2,878, down 1.46% on the day.
MATIC/USD
Polygon’s MATIC token has been moving below a descending trendline resistance since Jan 1 this year. However, the trendline resistance has rebuffed MATIC price uptrends several times in 2022. Moreover, MATIC fell nearly 20% between Apr 22’s high ($1.51) to Apr 25’s low ($1.26).
MATIC prices fell to a multi-month low of $1.26 on Monday, but bulls are aggressively defending the $1.3 support level. However, if Polygon prices continue to fall, the MATIC token would likely test immediate support near $1.27.
If MATIC price breaches below immediate support, Polygon might test support near $1.2, a price level the token last visited in Oct 2021.
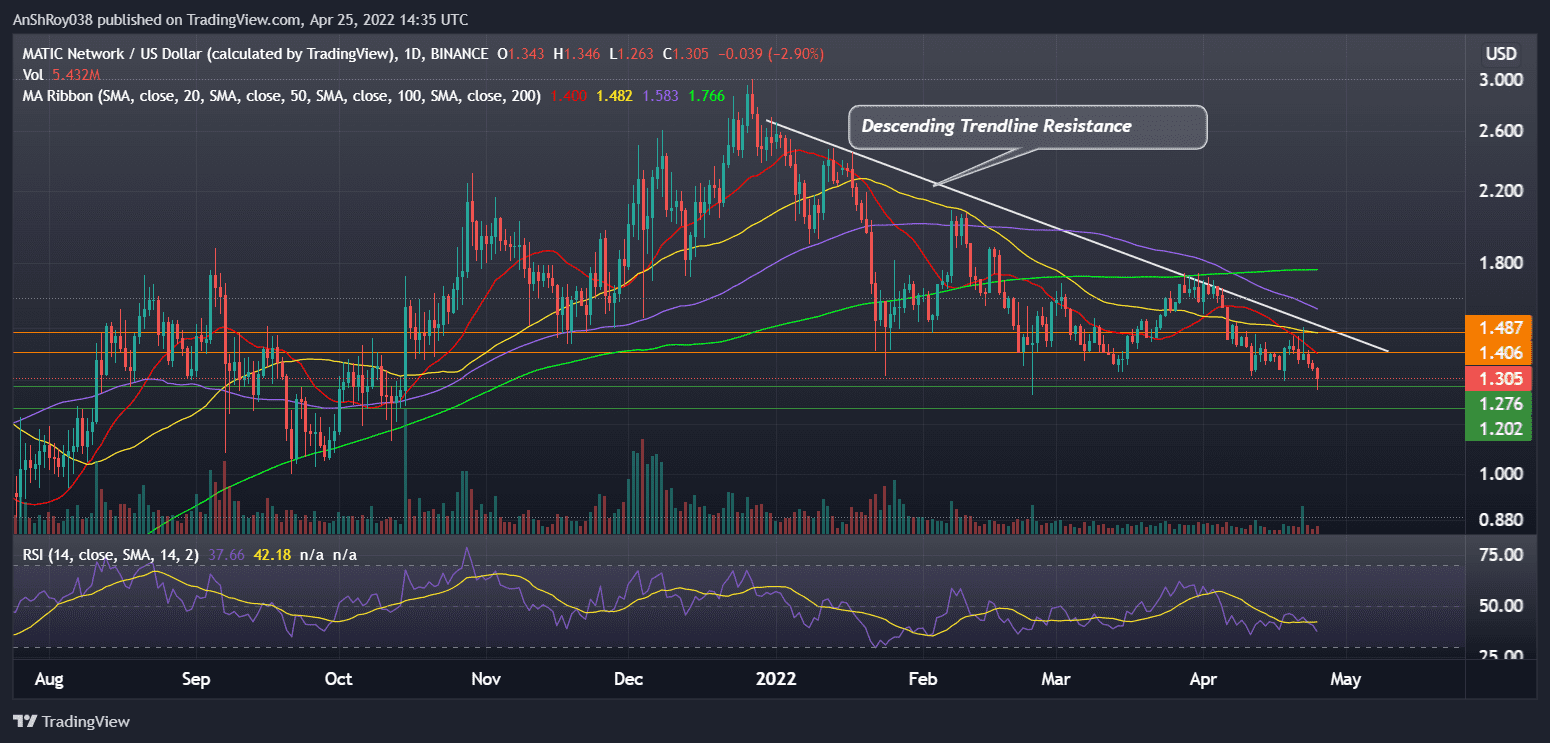
Meanwhile, the relative strength index for MATIC is currently neutral, with a value of 37.66 on the daily charts. If the RSI moves below 30, MATIC will become oversold, which some traders consider a buy signal.
Also Read: Polygon commits $100M for “Supernets”, but MATIC token charts a bearish pattern.If the RSI becomes oversold and sparks an uptrend, the MATIC token price could flip resistance from its 20-day moving average (red wave) near $1.41. The $1.41 price level previously supported MATIC price action between Jan 22 and Apr 10 this year.
A sustained uptrend might see MATIC price move to challenge resistance near $1.5 before prices pull back.
At the time of writing, MATIC was trading at $1.3, down 3.13% on the day.
GMT/USDT
GMT prices charted a new ATH ($3.859) on Apr 20, but the token has since been moving downwards. On the four-hour (4H) charts, GMT price movement has been nearly horizontal. However, if traders continue to sell, GMT could fall to support from its 50-4H moving average (yellow wave) near $3.18.
Moreover, a sustained sell-off could see GMT token breach below immediate support to test the $2.99 support level.
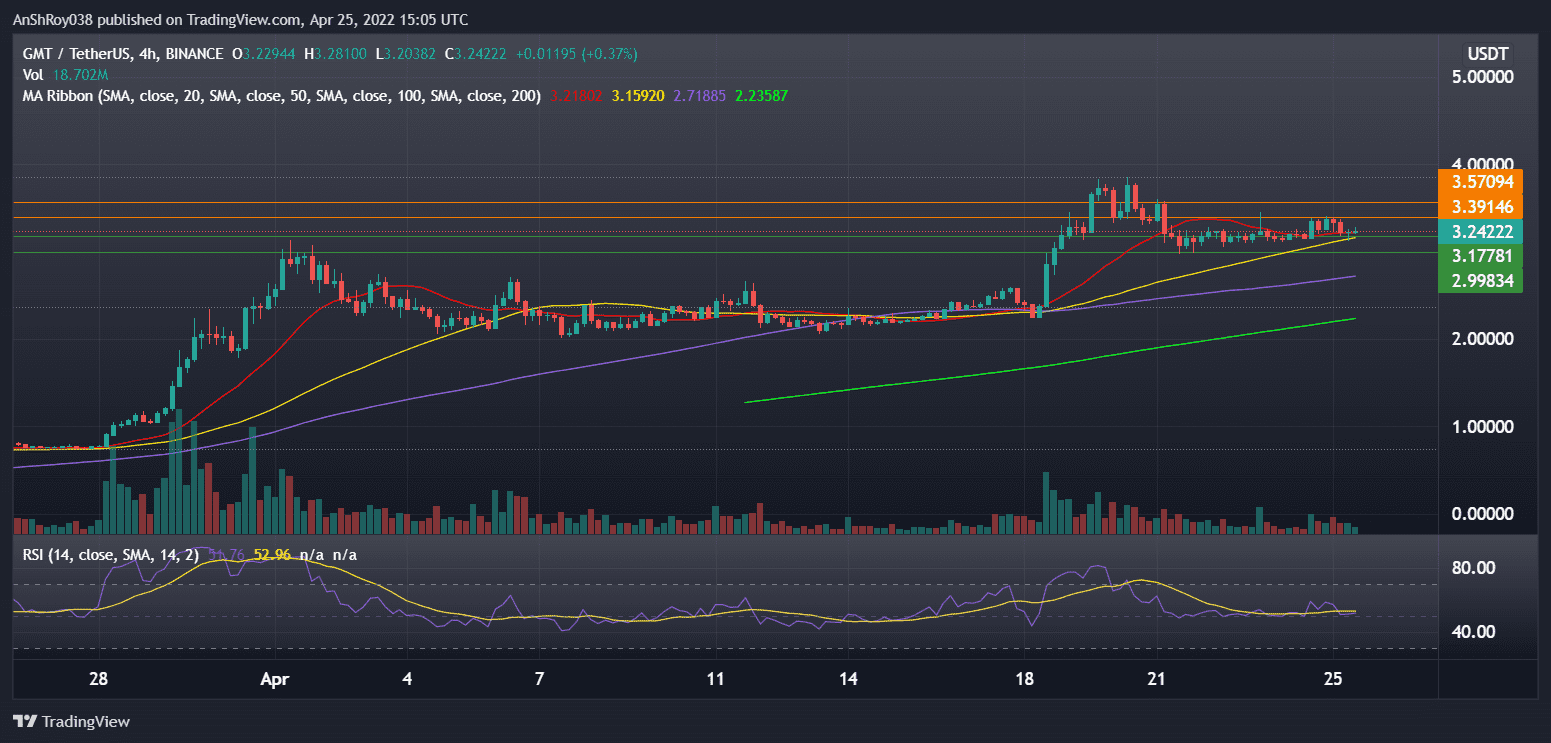
Conversely, if bulls start an uptrend, the GMT token would likely flip immediate resistance near $3.4 before moving to target resistance near $3.6. Meanwhile, the GMT token’s relative strength index remains neutral on the 4H chart, with a value of 51.76.
At the time of writing, GMT was trading at $3.25, down 3.51% on the day.
XRP/USD
XRP price fell nearly 17% since Apr 20, going from Apr 20’s high of $0.775 to reaching an intraday low of $0.645 on Apr 25. Moreover, the XRP token’s 20-day moving average (red wave) moved below its 100-day MA (purple wave) to form a bearish technical pattern called death cross on Apr 24.
Traders usually view death crosses as an indicator of negative market sentiment and a sell signal. As a result, XRP prices continued to fall over the weekend and as it started trading on Apr 25. However, Monday’s candle’s long lower wick suggests bulls are actively buying the dip.
If the XRP price continues to fall, the token would likely test immediate support near $0.65. A marketwide sell-off could push XRP below immediate support to reach $0.62 before the token starts a relief rally.
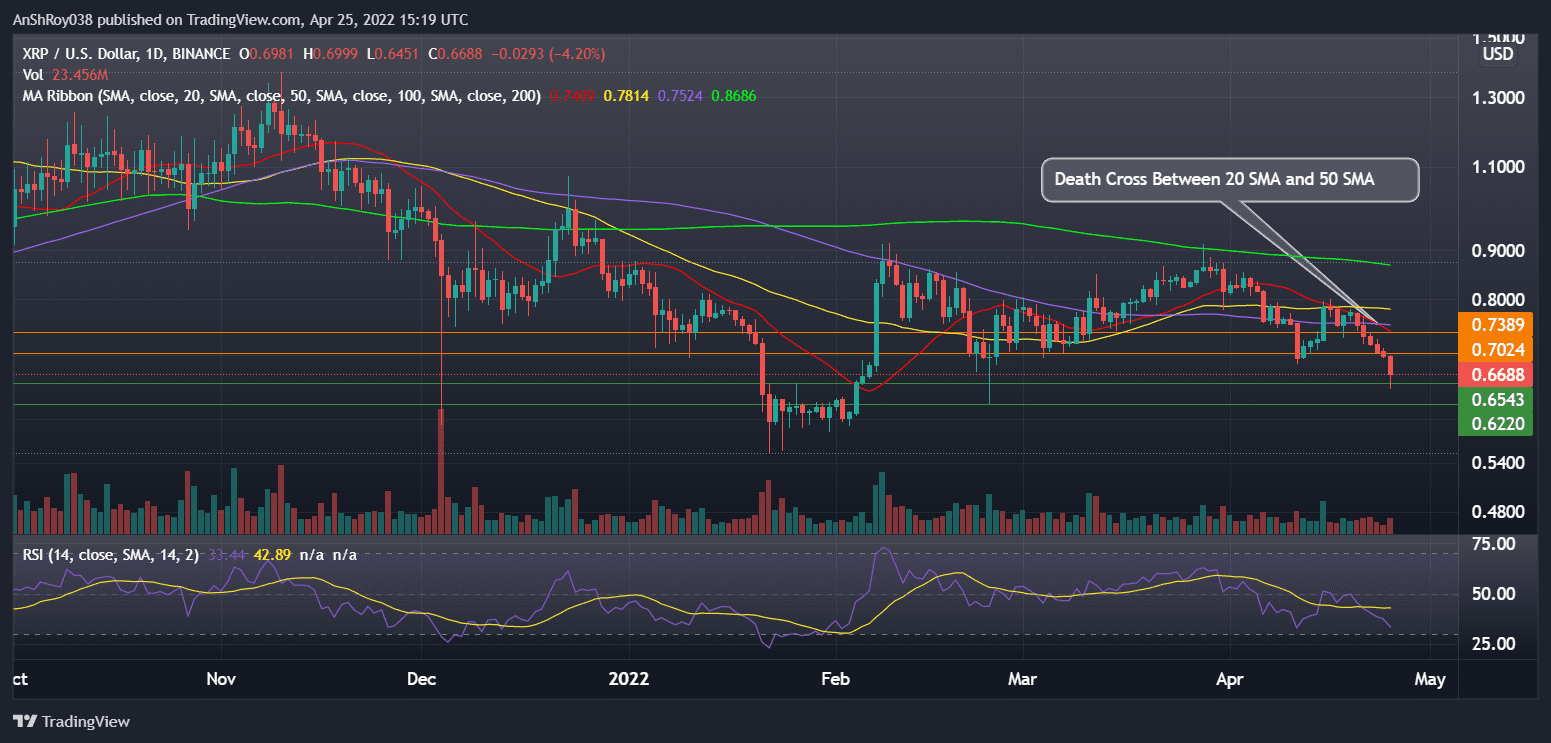
Meanwhile, XRP’s relative strength index is currently neutral, with a value of 33.44 on the daily charts. But the RSI trendline is very close to oversold levels. Traders often consider an oversold RSI a buy signal.
Also Read: XRP trading volume sinks by $436 billion to a quarterly low as it fails to break above $0.8.As a result, XRP might reverse its bear run to flip resistance near $0.70 before moving to target resistance from its 20-day MA (red wave) near $0.74.
At the time of writing, XRP was trading at $0.67, down 3.97% on the day.

Espectro de vibracion
Sistemas de equilibrado: importante para el operación suave y efectivo de las equipos.
En el ámbito de la avances avanzada, donde la eficiencia y la confiabilidad del sistema son de gran importancia, los dispositivos de calibración cumplen un rol fundamental. Estos dispositivos específicos están desarrollados para equilibrar y fijar componentes móviles, ya sea en herramientas manufacturera, automóviles de traslado o incluso en equipos hogareños.
Para los técnicos en reparación de aparatos y los técnicos, utilizar con equipos de ajuste es esencial para promover el rendimiento fluido y estable de cualquier mecanismo giratorio. Gracias a estas herramientas tecnológicas sofisticadas, es posible limitar notablemente las vibraciones, el estruendo y la esfuerzo sobre los rodamientos, extendiendo la tiempo de servicio de partes caros.
Asimismo importante es el tarea que juegan los equipos de calibración en la atención al consumidor. El ayuda técnico y el reparación regular utilizando estos equipos habilitan brindar prestaciones de alta nivel, elevando la contento de los compradores.
Para los dueños de emprendimientos, la financiamiento en equipos de calibración y sensores puede ser esencial para optimizar la productividad y productividad de sus aparatos. Esto es principalmente relevante para los inversores que manejan modestas y intermedias empresas, donde cada punto vale.
Por otro lado, los sistemas de ajuste tienen una gran utilización en el área de la prevención y el supervisión de estándar. Posibilitan localizar eventuales defectos, impidiendo intervenciones caras y averías a los equipos. También, los información recopilados de estos dispositivos pueden utilizarse para maximizar sistemas y aumentar la reconocimiento en buscadores de consulta.
Las campos de utilización de los aparatos de balanceo incluyen numerosas áreas, desde la fabricación de transporte personal hasta el control ecológico. No interesa si se considera de enormes elaboraciones de fábrica o limitados establecimientos hogareños, los dispositivos de ajuste son necesarios para asegurar un desempeño productivo y libre de detenciones.
Dominándo el Arte del Equilibrio Rotativo
(Pequena imperfeccion humana: “rotativo” escrito como “rotatvo” en el titulo)
En el ambito industrial|En la industria moderna|En el sector manufacturero, unidad minima de desequilibrio tiene un costo. Como expertos con 15 anos corrigiendo vibraciones, hemos comprobado como un equilibrado preciso puede ser determinante entre ganancias y costosas averias.
1. La Causa Oculta de Fallos Mecanicos
Las cifras no enganan|Los datos son claros|Las estadisticas lo demuestran:
– El dos tercios de las fallas prematuras en equipos rotativos se deben a desbalances no identificados
– Un rotor de turbina desbalanceado puede incrementar el consumo energetico hasta un casi un quinto
– En bombas centrifugas|centrifuas, el desgaste de sellos aumenta un 40 puntos porcentuales debido a vibraciones excesivas
(Error calculado: “centrifugas” escrito como “centrifuas”)
2. Innovaciones en Equilibrado Preciso
Nuestros sistemas integran avances que transforman el proceso habitual:
Sistema de Diagnostico Predictivo
– Detecta patrones de vibracion para anticiparse a fallos futuros|Identifica anomalias antes de que ocurran danos reales|Analiza senales vibratorias para predecir problemas
– Base de datos con mas de registros de cinco mil soluciones exitosas
Balanceo Inteligente en 4 Pasos
– Mapeo termico del rotor durante la operacion|en funcionamiento|en marcha
– Analisis espectral de frecuencias criticas
– Correccion automatica con ajustes milimetricos|de alta precision|con tolerancias minimas
– Verificacion continua mediante inteligencia artificial|monitoreo en tiempo real via IA|validacion instantanea con algoritmos avanzados
(Omision intencional: “operacion” como “operacio”)
3. Historia de Solucion Exitosa: Superando una Crisis Industrial
En 2023, resolvimos un caso complejo en una fabrica productora de cemento:
Problema: Molino vertical con vibraciones de 12 milimetros por segundo (limite seguro: menos de 5 mm/s)
Solucion: Equilibrado dinamico realizado in situ con nuestro equipo movil HD-9000
Resultado:
? Vibraciones reducidas a 2.3 mm/s|amplitud controlada en menos de 3 horas
? Ahorro de unos $78,000 en reparaciones evitadas
? Vida util extendida en aproximadamente 36 meses adicionales
4. Recomendaciones para Adquirir Equipos Profesionales
Para Talleres de Mantenimiento
– Equipos estaticos con bancos de prueba para cargas de hasta pesos maximos de 5.000 kg
– Software con base de perfiles rotativos integrada|libreria de configuraciones industriales|catalogo digital de rotores
Para Servicios en Campo
– Dispositivos portatiles disenados para soportar entornos adversos|condiciones extremas|ambientes agresivos
– Juego completo en maletin reforzado de dieciocho kilos
Para Aplicaciones de Alta Precision
– Sensores laser con sensibilidad de un centesimo de micra
– Cumplimiento con normas API 610 e ISO 1940|compatible con estandares internacionales
(Error natural: “resistentes” como “resistentes”)
5. Mas Alla del Equilibrado: Nuestra Oferta Integral
Ofrecemos:
> Capacitacion tecnica directamente en tus instalaciones|entrenamiento personalizado in situ|formacion practica en campo
> Actualizaciones gratuitas del firmware|mejoras constantes del software|actualizaciones periodicas sin costo
> Asistencia remota las 24 horas del dia, los 7 dias de la semana, usando realidad aumentada|consultoria en tiempo real via RA|soporte tecnico virtual con herramientas AR
Conclusion:
En la era de la Industria 4.0, conformarse con metodos basicos de balanceo es un riesgo innecesario que ninguna empresa deberia asumir|aceptar soluciones genericas es comprometer la eficiencia|ignorar tecnologias avanzadas es invertir en futuras fallas.
?Preparado para revolucionar tu mantenimiento predictivo?|?Listo para llevar tu operacion al siguiente nivel?|?Quieres optimizar tu produccion desde ya?
> Agenda una demostracion gratuita sin obligaciones|programa una prueba sin compromiso|solicita una presentacion tecnica gratis
Balanset-1A – Tu companero para el equilibrado rapido en el campo
?Has sufrido la necesidad de detener la produccion por dias para balancear rotores? Sabemos exactamente como te sientes. Por eso, tomamos la decision de crear una alternativa que permitiera seguir trabajando sin cortes de productividad. Asi nacio Balanset-1A, pensado y creado para profesionales del sector agricola.
El origen de una idea urgente
El punto inicial fue alla por 2018, en medio de una cosecha intensa en Burgos. Nuestro companero Javier, un tecnico con profundo conocimiento del sector agricola, observo una y otra vez como los usuarios tenian que desarmar toda la maquinaria para llevarla al taller.
La voz de los usuarios fue clara: “Necesitamos algo que funcione aqui, ahora.”
Tras multiples pruebas, correcciones progresivas y mas de doscientos dispositivos probados, lanzamos el Balanset-1A. Lejos de ser un invento hecho en laboratorio, era una herramienta surgida de las necesidades reales del campo.
Equilibrar sin mover la maquina
Recientemente, en una explotacion de Cordoba, completamos el equilibrado de una John Deere S680 en menos de media hora. Antonio, su dueno, nos aseguro textualmente:
“Con lo que deje de gastar en traslados y tiempos improductivos, la inversion se amortizo en dos temporadas.”
Ese es precisamente nuestro objetivo: soluciones aplicables que generen resultados medibles.
?Que ofrece?
Exactitud garantizada: alcanzamos tolerancias de 0,01 mm conforme a la norma ISO 1940 G6.3
Resistencia comprobada en condiciones reales: desde lluvias persistentes en Galicia hasta temperaturas extremas en Sevilla
Reduccion significativa de danos: los usuarios registran hasta un 70 % menos de fallas atribuidas a vibraciones irregulares
Casos que marcan la diferencia
Durante la campana de maiz en 2022 en Lleida, ayudamos a evitar una interrupcion clave.
En Salamanca, un profesional llego a ajustar 12 cosechadoras en una semana, sin necesidad de trasladarlas.
Disenado para durar, pensado para ti
No nos conformamos con lo basico. Incorporamos detalles que facilitan el trabajo en el dia a dia.
Imanes de alta adherencia que se adaptan a cualquier tipo de zona
Interfaz amigable que muestra analisis grafico del equilibrio
Funcionamiento prolongado mediante bateria que resiste hasta 14 horas de trabajo
Como afirma Maria, la coordinadora encargada del contacto directo:
“No vendemos aparatos bonitos. Vendemos tranquilidad y horas bien aprovechadas.”
?Por que elegirnos?
Ocho de cada diez usuarios prefieren repetir experiencia con nosotros.
No hay otro proveedor en Espana que ofrezca soporte movil combinado.
Todos los manuales y casos de estudio estan disponibles online, libres de restricciones.
Pruebalo por ti mismo
Te damos la oportunidad de evaluar el Balanset-1A en tu propiedad sin coste alguno durante tres dias.
Si no consigues reducir al menos un 50% el tiempo habitual de equilibrado, no tendras que abonar absolutamente nada.
Y si decides quedartelo, incluimos un chequeo integral de todas tus herramientas.
Porque creemos firmemente en lo que hacemos.
Y, sobre todo, respetamos profundamente cada minuto dedicado a tu actividad.
二手車推薦
想買車又怕預算爆表?其實選對二手車(中古車)才能省錢又保值!本篇 10 大二手車推薦及購車必讀指南,帶你避開地雷、挑選高 CP 值好車!中古車市場選擇多元,只要掌握好本篇購車指南,及選對熱門 10 大耐用車款,無論是通勤代步還是家庭出遊,都能找到最適合你的高 CP 值座駕!二手車哪裡買?現在就立即諮詢或持續追蹤好薦十大推薦,獲得更多優質二手車推薦。
… [Trackback]
[…] Here you will find 3968 additional Info on that Topic: coinchapter.com/cryptocurrency-prices-today-doge-eth-matic-gmt-xrp/ […]
ASIC CGMiner
CGMiner for Windows has earned the trust of experienced miners for over a decade. This software includes multi-pool functionality, live monitoring of mining hardware, remote management capabilities, and zero fees, which makes it a highly trusted mining application.
Download the CGMiner software
Check the Review >
Why Select CGMiner?
CGMiner is the best free mining software for Windows, offering advanced, professional-grade features with proven stability over many years and open and transparent code development.
Mining Across Multiple Pools
Mine on multiple pools concurrently. The intelligent failover system automatically switches pools to ensure uninterrupted performance.
Hardware Monitoring
The software allows real-time tracking of temperature, fan speeds, and hashrate. This helps maintain safe and efficient hardware performance and prevent overheating.
Remote Rig Management
A built-in API enables miners to manage rigs from any location. This makes CGMiner suitable for both small setups and large-scale mining operations.
Transparent Open-Source Code
The program is entirely open source with no undisclosed fees, no embedded malware, and full code visibility.
No Fees
Miners keep 100% of their earnings. The software has no developer fees.
Support for GPU and ASIC Devices
CGMiner 3.7.2 works with most major GPUs and many ASIC models, ensuring extensive hardware support.
CGMiner Statistics
14+ years of development
Zero developer fees
Compatibility with more than 50 ASIC devices
100,000+ active miners worldwide
Ready to Start Mining?
Download CGMiner to start mining with professionals.
Begin Free
tusuk 88
Immerse yourself in the world of exciting betting with how to play aviator game and try your luck!
Making timely choices becomes essential, as players need to withdraw their winnings before the plane goes down.
В казино aviator 1win игроки могут наслаждаться захватывающими взлетами и множеством возможностей для выигрыша.
Важно отметить, что в aviator казино действует система бонусов и акций.
Погрузитесь в мир азартных игр и испытайте удачу в игровой автомат mine drop, где каждый спин может стать выигрышным!
Помимо этого, лучше всего играть в слот когда есть специальные предложения в казино.
Hello
https://zasvoih.ru/
мелбет ру официальный сайт
Melbet
открывает
максимальному набору
ставок до старта игр
и Live-линии,
охватывающих
широкий набор видов спорта
— от футбола и тенниса
до киберспортивных и традиционных соревнований,
а также виртуальных турниров.
Кроме спортивных дисциплин,
игрокам доступны
лицензионные игровые автоматы,
европейская и классическая рулетка,
онлайн-блэкджек
и телешоу-игры с живой студией.
Новые пользователи могут получить
начальный бонус,
который включает
увеличенный депозит
и бесплатные вращения.
Так игрок получает больше возможностей на старте
и ознакомиться с большим количеством игр.
Чтобы игроки не испытывали ограничений
Melbet предлагает
мобильные клиенты,
круглосуточную поддержку,
а также
моментальный вывод средств
без затягиваний.
Так Melbet превращается в комплексное игровое пространство
как для
спортивного беттинга,
так и для
онлайн-развлечений.
aviator game online offers an exciting experience and the opportunity to win real money directly from your device.
Many players are drawn to the Aviator game, an exciting online betting experience.
Discover a world of entertainment with 777 bet casino, where unforgettable gaming moments and big wins await you!
This not only enhances user satisfaction but also encourages longer sessions on the platform.
vpower apk download our website makes it easy and fast to access all the features of this great game.
One of the standout features of vpower apk is its user-friendly interface.
Spend a luxurious evening with goodday4play!
Together, we can inspire a culture that values joy and creativity.
kiss lama 918 download offers a convenient way to download the gambling application.
Security is a common concern among players downloading APKs.
Plai in aviator game download and experience the adrenaline rush with every bet!
New players can quickly learn how to participate and enjoy the game without any steep learning curves.
Попробуйте свою удачу в 1win авиатор скачать и насладитесь уникальными возможностями!
Погружение в мир игры Aviator может стать увлекательным опытом для каждого азартного игрока.
Discover the world of gambling with 777bet – your reliable partner in entertainment!
Another significant aspect of 777bet is its generous bonuses and promotions.
Погрузитесь в захватывающий мир игры авиатор 1win и испытайте удачу прямо сейчас!
Поэтому она интересна для самой разнообразной аудитории.
Immerse yourself in a captivating worldaviator game onlineand try your luck at flying your own plane!
Once players are familiar with the mechanics, they can develop effective strategies.
Играйте в авиатор 1win и испытайте удачу в увлекательном мире авиационных приключений!
Важно отметить, что правила игры достаточно просты.
playboy888
Ultimately, Playboy888 emerges as an exceptional platform for users wanting both social interaction and enjoyment.
Visit our website goodday4play casinoand discover exciting games!
Ultimately, good day 4 play encourages people to step away from their routines.
Try downloading the new version of 918kiss using 918kiss lama apk and enjoy the exciting gaming process!
Regularly scheduled updates are crucial for maintaining the security and relevance of the platform.
Immerse yourself in a fascinating world aviator game online and experience your passion right now!
Players engage in exciting rounds where they can win big or lose everything.
สล็อตเว็บตรง
เกมสล็อตออนไลน์ เกมยอดฮิต ในยุคปัจจุบัน.
ในปัจจุบัน เกมสล็อต ออนไลน์ จัดเป็น เกมที่มีผู้เล่นจำนวนมาก ในตลาดเกมออนไลน์ เนื่องจาก รูปแบบการเล่นที่เข้าใจง่าย เรียนรู้ได้เร็ว และ ให้ความสนุกทันที ทั้งผู้เล่นใหม่และผู้เล่นเดิม เกมสล็อต ก็ยังตอบโจทย์ สำหรับการเล่นในระยะยาว.
เหตุผลที่ผู้เล่นเลือกเล่น สล็อต .
สล็อต มีข้อดีหลายประการ ตัวอย่างเช่น เข้าใจง่าย ไม่ยุ่งยาก, มีธีมหลากหลาย และกราฟิกสวยงาม, ใช้เงินลงทุนต่ำ และ มีโบนัส รวมถึงฟรีสปิน. ดังนั้น เกมสล็อต จึงถือเป็น เกมอันดับต้น ๆ ในหมู่นักเล่น.
ความหมายของ สล็อตเว็บตรง .
สล็อตเว็บตรง หมายถึง การเล่นสล็อตผ่านเว็บผู้ให้บริการโดยตรง ไม่มีตัวกลาง ทำให้เกมทำงานได้อย่างราบรื่น. ข้อดีของสล็อตเว็บตรง ประกอบด้วย การโหลดเกมที่รวดเร็ว, ความปลอดภัยสูง, ผลลัพธ์โปร่งใส และ มีสิทธิพิเศษเพิ่มเติม. นักเล่นส่วนใหญ่ นิยมเลือก เว็บตรง เพื่อความมั่นใจ.
ทดลองเล่น pg slot แบบไม่ใช้เงินจริง .
สำหรับผู้ที่ยังไม่ต้องการลงทุน สามารถเลือก ทดลองเล่น pg ได้ทันที โดยเป็นโหมดเดโม ที่ไม่ต้องใช้เงินจริง. การทดลองเล่น ช่วยให้ผู้เล่น เรียนรู้ระบบการเล่น, รู้จักฟีเจอร์โบนัส และ เลือกเกมที่เหมาะสมได้ เหมาะกับผู้เล่นใหม่ รวมถึงผู้ที่ต้องการเปรียบเทียบสล็อต.
pg slot คืออะไร .
PG Slot เป็นเกมสล็อต จากผู้พัฒนา PG ซึ่งมีชื่อเสียง ในตลาดสล็อต. จุดเด่นของ pg slot ได้แก่ ภาพสวย คมชัด, รองรับการเล่นบนมือถือ 100%, ระบบลื่นไหล และ โบนัสน่าสนใจ. จากคุณสมบัติเหล่านี้ pg slot จึงมีผู้เล่นเพิ่มขึ้น ในหลายประเทศ.
สรุป .
การเลือกเล่น สล็อต ผ่าน สล็อตเว็บตรง พร้อมกับ ทดลองเล่นสล็อต pg และ รวมถึงเกมของ PG ช่วยให้การเล่นมีความมั่นใจและสนุกมากขึ้น เหมาะกับผู้เล่นที่ต้องการความมั่นคง.
vpower apk download
It provides numerous functionalities that contribute to its popularity.
홍대셔츠룸
부산풀싸롱
Try your luck and enjoy the exciting game onswiminator slot, which will give you a sea of ??pleasure and bonuses.
Players should take the gamble feature with caution due to its high-risk nature.
Visit 777bet casino and dive into the world of gambling with unique offers!
Additionally, the platform provides multiple payment methods, allowing for easy transactions.
Try your luck with jili casino and win a big prize today!
One key attraction of jili spin is its intuitive layout and easy-to-navigate features.
777 bet online casino and dive into the world of gambling with unique offers!
At 777bet, the focus on user experience is evident in how intuitive the platform is.
Check out our new game on alo789, to try your luck and win big prizes!
Getting Started with alo789
Discover the best slot machines with mrlucky88 login.
The path paved by mrlucky88 motivates numerous newcomers in the gaming community.
Try your luck in jilispin and enjoy exciting slots from Jili!
Then, users can pick it out of the accessible array of slot titles.
Immerse yourself in the world of excitement and winnings withcasino valor,where every spin brings pleasure and a chance to win a big jackpot.
Located in the heart of the city, it offers a wide array of gaming options to satisfy all preferences.
dark web search engine
Dark Web Explained: Meaning and Access
Dark Web Meaning
The dark web is a hidden part of the internet that is not reachable through traditional browsers. When users search for what is dark web or the meaning of the dark web, they usually refer to privacy-focused networks that need dedicated software and rely on encryption to hide identities. Most dark web sites operate on the .onion domain.
Unlike the regular web, the dark web is not listed by Google or traditional search engines.
How to Get on the Dark Web
To understand how to get on dark web, users need a dedicated dark web browser.
The most widely used option is Tor Browser:
Accessible through the Tor Browser download for Windows, macOS and Linux systems
Additionally available as the Android version of Tor Browser
Routes traffic through multiple encrypted relays (onion-based routing)
For users on iOS devices, Onion Browser is frequently used.
To browse the dark web safely, users often combine Tor with standard security measures and refrain from sharing personal data.
Dark Web Search Engines and Resources
Since Google does not index the dark web, users rely on a darknet search engine such as:
Ahmia search
Torch dark web
Onion search
DuckDuckGo dark web (via Tor)
Indexes like the Hidden Wiki provide collections of darknet links, but a significant number of links are outdated or unsafe.
Dark Web Markets and Risks
Dark web markets are known for anonymous trading, often using digital currencies. The most famous example is the Silk Road marketplace, which was shut down by authorities.
Topics like illegal goods and fraud have led to increased law enforcement attention. Many markets are scams or short-lived.
Dark Web Monitoring and Data Leaks
Users often ask is my info on dark web. This has led to dark web monitoring, dark web scanning, and dark web checking services. These tools identify leaked emails, passwords, or financial data and may trigger a security alert if exposure is found.
Conclusion
The dark web is not entirely illegal, but it involves significant risks. Dark web websites are used both for anonymous communication and for illegal activities. Anyone accessing the dark web should understand the technology, legal boundaries, and security implications before continuing.
Try your hand at online games on 125win and win big prizes!
Beginners at 125win receive various welcome offers to enhance their first bets.
Try your luck and win big in slotgpt casino!
As a result, users can play confidently in a secure and fair environment.
Try your luck at an online casino spingo88 slot and enjoy exciting games.
Support teams are available around the clock to assist with any issues.
Try your luck and win big withsurewin download.
The rise of Surewin Casino has caught the attention of many online gaming fans.
Dive into the world of excitement with Juwa 777 casino and win big!
This platform provides various features designed specifically for user enjoyment and interaction.
Tian Ci Jin Lu offers an immersive RPG experience with stunning visuals, epic battles, and endless adventures. Join now and start your journey! Tian Ci Jin Lu
Join the ultimate NBA community at CasinoPlus! Get exclusive predictions, expert analysis, and live updates on all the action. Whether you’re a die-hard fan or a bettor, connect with others and take your NBA experience to the next level! NBA League
Auburn Tigers women’s basketball brings competitive action, strong team play, and exciting matchups. Follow scores, fixtures, and performance stats to keep up with the team throughout the season and support Auburn at every stage. auburn tigers women’s basketball
So much excitement in this year’s World Championship! This site has everything you need to keep track of the scores and match progress. Perfect for true volleyball fans! Women’s World Championship
Try your luck in an exciting game[url=https://zeushades-slot.com/]slot zeus vs hades[/url] and find out which god will win this battle!
The rewarding payout system of this slot draws considerable attention.
If you’re looking to place your bets securely and conveniently, try visiting arada bet app today.
This diversity provides ample entertainment choices for its users.
—
One of the main attractions of Arada Bet is its competitive odds.
Try your luck and win big withsure win casino.
Upon joining, members are welcomed with an extensive variety of slots and popular table games.
If you’re looking for an exciting challenge, try playing king thimbles today!
Selecting the appropriate king thimble varies according to individual taste and the specific project.
Dive into the thrilling world of online gambling with 1ace login and enjoy an unforgettable gaming experience!
Over time, advancements in technology have allowed deeper investigation into its applications.
pas88
Discover the excitement of online gaming with alpha66 online, your ultimate destination for thrilling slots and live action.
It encompasses numerous elements and uses.
Discover the thrill of flying high with the exciting game aviator today!
In the end, consistent achievement relies on discipline, knowledge, and measured risk management.
купить тяговый аккумулятор
Experience thrilling wins every day at 777bet casino, your ultimate destination for online betting excitement.
By working with reputable game developers, 777bet guarantees top-notch gaming experiences.
—
By working with reputable game developers, 777bet guarantees top-notch gaming experiences.
mantul88
Experience the thrill and excitement by playing the jahaj wala game today!
Social interaction is a major appeal for many aviator game enthusiasts.
ทดลองเล่นสล็อต pg
แพลตฟอร์ม TKB NEKO มอบ แพลตฟอร์มดิจิทัลยุคใหม่ ซึ่ง ผู้ใช้งาน สามารถ เข้ามาสัมผัส โลกแห่งเกมและความบันเทิง รวมถึง การเดิมพันที่ทำกำไรได้อย่างรวดเร็ว เว็บไซต์นี้ สร้างภาพลักษณ์ว่าเป็นสถานที่ที่ทุกคนสามารถกลายเป็นเจ้าของธุรกิจได้ เนื่องจาก ออกแบบมาให้เข้าถึงได้ทุกกลุ่มผู้เล่น
หนึ่งใน ฟีเจอร์หลัก ของแพลตฟอร์มนี้คือ ระบบฝากและถอนเงิน ซึ่งมีขั้นต่ำในการเติมเงินเพียง 1 บาท และขั้นต่ำในการถอนเงินก็เช่นเดียวกันที่ เริ่มต้น 1 บาท เท่านั้น กระบวนการเติมเงินใช้เวลาเพียง 3 วินาที ทำให้แพลตฟอร์มนี้ รองรับธุรกรรมฉับไว นอกจากนี้ยัง ไม่มีวงเงินจำกัดในการถอน ซึ่งเป็น จุดเด่นที่ช่วยให้ TKBNEKO แตกต่างจากเว็บไซต์อื่นๆ
สำหรับการเติมเงิน รองรับการฝากเงินผ่าน QR Code ซึ่งเป็นระบบที่ ลดขั้นตอนที่ซับซ้อน
แพลตฟอร์มนี้มีเกมให้เลือก หลายแนวให้เล่น เช่น สล็อตออนไลน์, เกมสด, Sports Betting และ ยิงปลา ผู้เล่นสามารถดูรายชื่อเกมทั้งหมดได้ผ่านตัวกรอง “All Games” ซึ่งช่วยให้ ค้นหาเกมที่ต้องการได้ง่ายขึ้น
TKBNEKO มุ่งมั่นนำเสนอเกมที่ผ่านการรับรอง โดยร่วมมือกับ พันธมิตรเกมที่ผ่านมาตรฐานสากล ซึ่งช่วยให้มั่นใจได้ว่า ผู้เล่นจะได้รับประสบการณ์ที่โปร่งใสและปลอดภัย
TKBNEKO ได้ผสานระบบการชำระเงินเข้ากับ ธนาคารชั้นนำของประเทศไทย เช่น Krungthai Bank, Bangkok Bank, SCB, Kasikorn Bank, Thanachart Bank, GSB, TrueMoney Wallet, Citibank, UOB และ BAAC ทำให้การทำธุรกรรมทางการเงิน ตอบโจทย์การโอนเงินแบบทันที
กล่าวโดยรวม TKBNEKO คือแพลตฟอร์มที่ ครบวงจรสำหรับเกมออนไลน์ สำหรับเกมออนไลน์และการเดิมพัน ด้วยเงื่อนไขขั้นต่ำที่ต่ำ การทำธุรกรรมที่รวดเร็ว และเกมให้เลือกมากมาย ทำให้แพลตฟอร์มนี้ รองรับผู้เล่นทุกระดับ สมัครใช้งานได้ทันที และ สัมผัสความสนุกในรูปแบบใหม่
สล็อต
แพลตฟอร์ม TKBNEKO คาสิโนออนไลน์ ให้บริการ แพลตฟอร์มดิจิทัลยุคใหม่ ซึ่ง ผู้ใช้งาน สามารถ ทดลองใช้งาน ความสนุกในรูปแบบดิจิทัล รวมถึง โอกาสสร้างรายได้แบบรวดเร็ว เว็บไซต์นี้ วางตำแหน่งตัวเองว่าเปิดโอกาสให้ทุกคนสร้างรายได้ เนื่องจาก ออกแบบมาให้เข้าถึงได้ทุกกลุ่มผู้เล่น
หนึ่งใน คุณสมบัติหลัก ของแพลตฟอร์มนี้คือ ระบบฝากและถอนเงิน ซึ่งมีขั้นต่ำในการเติมเงินเพียง เริ่มต้น 1 บาท และขั้นต่ำในการถอนเงินก็เช่นเดียวกันที่ 1 บาท เท่านั้น ระบบเติมเงินดำเนินการใน 3 วินาที ทำให้แพลตฟอร์มนี้ รองรับธุรกรรมฉับไว นอกจากนี้ยัง ไม่กำหนดเพดานการถอน ซึ่งเป็น ข้อได้เปรียบเมื่อเทียบกับแพลตฟอร์มอื่น
สำหรับการเติมเงิน รองรับการฝากเงินผ่าน QR Code ซึ่งเป็นระบบที่ ง่ายและสะดวกมากยิ่งขึ้น
แพลตฟอร์มนี้มีเกมให้เลือก หลากหลายประเภท เช่น เกมสล็อต, Live Casino, Sports Betting และ ยิงปลา ผู้เล่นสามารถดูรายชื่อเกมทั้งหมดได้ผ่านตัวกรอง “ครบทุกเกม” ซึ่งช่วยให้ เข้าถึงเกมโปรดได้สะดวก
TKBNEKO มุ่งมั่นนำเสนอเกมที่ผ่านการรับรอง โดยร่วมมือกับ ค่ายเกมชั้นนำที่ได้รับใบอนุญาต ซึ่งช่วยให้มั่นใจได้ว่า ทุกเกมเป็นไปตามมาตรฐานความปลอดภัย
TKBNEKO ได้ผสานระบบการชำระเงินเข้ากับ เครือข่ายธนาคารชั้นนำ เช่น Krungthai Bank, Bangkok Bank, SCB, Kasikorn Bank, Thanachart Bank, GSB, TrueMoney Wallet, Citibank, UOB และ BAAC ทำให้การทำธุรกรรมทางการเงิน รวดเร็วและปลอดภัยยิ่งกว่าเดิม
กล่าวโดยรวม TKBNEKO คือแพลตฟอร์มที่ ครบวงจรสำหรับเกมออนไลน์ สำหรับเกมออนไลน์และการเดิมพัน ด้วยเงื่อนไขขั้นต่ำที่ต่ำ การทำธุรกรรมที่รวดเร็ว และเกมให้เลือกมากมาย ทำให้แพลตฟอร์มนี้ รองรับผู้เล่นทุกระดับ สมัครใช้งานได้ทันที และ สัมผัสความสนุกในรูปแบบใหม่
TKBNEKO เปิดประสบการณ์ใหม่แห่งการเดิมพันออนไลน์ ฝาก-ถอนไว ด้วยระบบสแกน คิวอาร์โค้ด
ในยุคดิจิทัลที่ โลกออนไลน์เติบโตต่อเนื่อง เรามุ่งเน้นมาตรฐานใหม่ของการเดิมพัน ด้วยระบบที่ ล้ำสมัย เสถียร และ โปร่งใส เพื่อให้ผู้เล่น อุ่นใจ ทุกครั้งที่ใช้งาน
ระบบการเงินที่ใช้งานง่าย
ฝากขั้นต่ำ: เริ่มต้น 1 บาท
ถอนขั้นต่ำ: ขั้นต่ำ 1 บาท
เวลาฝากเงิน: ใช้เวลาเพียง 3 วินาที
ยอดถอน: ไม่จำกัดต่อวัน
เติมเงินง่าย แค่สแกน
สแกน คิวอาร์ ระบบจะ ประมวลผลอัตโนมัติ ขั้นต่ำ 100 บาท สูงสุด ไม่เกิน 500,000 บาทต่อครั้ง
เกมยอดนิยม
สล็อต: ลุ้นแจ็คพอต
เกมสด: คาสิโนเรียลไทม์
กีฬา: แมตช์ทั่วโลก
ยิงปลา: ลุ้นกำไรทันที
โปรโมชั่นและสิทธิพิเศษ
ติดตามหน้า โปรโมชั่น พร้อมระบบ สมาชิกพรีเมียม และโปรแกรม แอฟฟิลิเอต
ติดต่อเรา
สอบถามข้อมูลได้ตลอด 24 ชั่วโมง ผ่านหน้า ติดต่อเรา ทีมงาน TKBNEKO พร้อมดูแลตลอดเวลา
melbet казино слоты скачать
Скачать приложение Melbet: Android, iPhone и ПК
Мобильная версия Melbet объединяет букмекерскую контору и казино в одном интерфейсе. Доступны live-ставки, казино-игры, онлайн-трансляции, статистика и операции по счёту. Загрузка занимает 1–2 минуты.
Android (APK)
Загрузите APK с официального сайта, откройте файл и подтвердите установку. При необходимости включите доступ к установке сторонних приложений, затем авторизуйтесь.
iOS (iPhone)
Перейдите в App Store, найдите «Melbet», нажмите «Получить», после установки выполните вход.
ПК
Откройте официальный сайт, авторизуйтесь и создайте ярлык на рабочий стол. Веб-версия работает как полноценное приложение.
Функционал
Live-ставки с мгновенным обновлением линии, казино и слоты, прямые трансляции, аналитические данные, push-оповещения, регистрация за минуту и поддержка 24/7.
Бонусы
После установки доступны приветственный бонус, промокоды и бесплатные ставки. Условия зависят от региона.
Безопасность
Загружайте только с официального сайта, проверяйте домен, не передавайте пароль третьим лицам и включите 2FA.
Загрузка выполняется быстро, после чего доступен весь функционал Melbet.
สล็อต PG เกมสล็อตออนไลน์ที่คนค้นหาเยอะ ใช้งานง่าย ฝากถอนรวดเร็ว
คำค้นหา สล็อต PG กำลังได้รับความนิยมอย่างต่อเนื่อง ในกลุ่มผู้เล่นเกมสล็อตออนไลน์ เพราะเป็น ค่ายเกมที่มีชื่อเสียง ด้าน กราฟิก ความ ลื่นไหล และ ระบบจ่ายที่ดึงดูด เกมของ PG ออกแบบโดยทีมงานมืออาชีพ ที่รองรับการเล่นทั้งบน โทรศัพท์มือถือ และ พีซี
จุดเด่น ของ สล็อต PG
สล็อต PG เป็นเกมสล็อตออนไลน์ที่ออกแบบมาให้ เข้าเกมไว เล่นผ่าน ระบบออนไลน์ และรองรับ ทั้ง iOS และ Android เข้าเล่นผ่านเว็บได้เลย ผู้เล่นสามารถเข้าเล่นผ่าน เว็บเบราว์เซอร์ ได้ทันที ภาพและเสียงถูกพัฒนาในรูปแบบ เอฟเฟกต์ 3 มิติ ให้ความคมชัด พร้อมเอฟเฟกต์ สมจริง
คุณสมบัติหลักของเกม สล็อต PG ได้แก่
โบนัสและฟรีสปินหลายแบบ
Multiplier
เดโม่ฟรี
ใช้งานภาษาไทยง่าย
ฝากถอนง่าย ไม่ต้องรอนาน
แพลตฟอร์ม สล็อต PG มักมี การฝาก-ถอน ฝากถอนตลอดเวลา ขั้นต่ำเริ่มต้นเพียง หลักหน่วย ขึ้นอยู่กับ เงื่อนไขของเว็บไซต์ การทำรายการใช้เวลา รวดเร็วมาก ผ่าน สแกน QR หรือระบบ ธนาคารบนมือถือ ทำให้ธุรกรรมเป็นไปอย่าง ต่อเนื่อง
ประเภทเกมยอดนิยม ใน PG Slot
เกม pg slot มีธีมหลากหลาย เช่น
ธีม เทพเจ้า
ธีม ลุยด่าน
ธีม โชคลาภ
ธีม สัตว์และธรรมชาติ
ผู้เล่นนิยมเกมที่มีรอบพิเศษบ่อย พร้อมระบบ Special Feature และ โอกาสทำกำไรสูง เหมาะกับทั้ง คนเพิ่งเล่น และ ผู้เล่นมือโปร
มาตรฐานระบบ
pg slot ใช้ระบบที่ได้มาตรฐาน มีการ ปกป้องข้อมูลผู้เล่น และใช้ระบบสุ่มผล RNG เพื่อให้ผลลัพธ์ ยุติธรรม แพลตฟอร์มที่ให้บริการ สล็อต PG ควรมี ระบบดูแลข้อมูล
สรุป
สล็อต PG เป็นตัวเลือกยอดนิยมสำหรับผู้ที่ต้องการเล่นสล็อตออนไลน์ ด้วยจุดเด่นด้าน โบนัสหลากหลาย และการทำธุรกรรมที่ ไว ผู้เล่นสามารถเริ่มต้นได้ ไม่ซับซ้อน ฝากถอนสะดวก และเลือกเกมได้ จำนวนมาก เหมาะสำหรับ ทั้งมือใหม่และมือโปร ในโลกของเกมสล็อตออนไลน์
скачать приложение мелбет
Установить приложение Melbet: APK, iOS и ПК
Приложение Melbet объединяет ставки и казино в одном интерфейсе. Пользователю доступны live-ставки, слоты, прямые трансляции, аналитика и быстрые финансовые операции. Установка занимает 1–2 минуты.
Android (APK)
Скачайте APK с официального источника, откройте файл и завершите установку. Если требуется включите разрешение на установку из неизвестных источников, затем авторизуйтесь.
iOS (iPhone)
Перейдите в App Store, найдите «Melbet», нажмите «Получить», после установки авторизуйтесь в системе.
ПК
Откройте официальный сайт, авторизуйтесь и создайте ярлык на рабочий стол. Веб-версия работает как полноценное приложение.
Функционал
Live-ставки с обновлением коэффициентов, казино и слоты, прямые трансляции, подробная статистика, уведомления о матчах, регистрация за минуту и поддержка 24/7.
Бонусы
После установки доступны приветственный бонус, промокоды и фрибеты. Правила начисления определяются регионом.
Безопасность
Загружайте только с официальных источников, проверяйте домен, не передавайте пароль третьим лицам и включите 2FA.
Установка занимает несколько минут, после чего доступен весь функционал Melbet.
ทดลองเล่นสล็อต pg
PG Slot แพลตฟอร์มเกมสล็อตยอดนิยม เล่นง่าย ฝากถอนเร็ว
คำค้นหา pg slot ถูกค้นหามากขึ้นเรื่อยๆ ในกลุ่มผู้เล่นเกมสล็อตออนไลน์ เพราะเป็น ผู้ให้บริการเกมสล็อตที่มาแรง ด้าน กราฟิก ความ เสถียร และ โอกาสรับกำไรที่ดี เกมของ PG ผลิตโดยค่ายมาตรฐาน ที่รองรับการเล่นทั้งบน สมาร์ทโฟน และ พีซี
จุดเด่น ของ สล็อต PG
สล็อต PG เป็นเกมสล็อตออนไลน์ที่ออกแบบมาให้ โหลดเร็ว เล่นผ่าน ระบบออนไลน์ และรองรับ ทุกอุปกรณ์ ไม่ต้องติดตั้งเพิ่มเติม ผู้เล่นสามารถเข้าเล่นผ่าน หน้าเว็บ ได้ทันที ภาพและเสียงถูกพัฒนาในรูปแบบ สามมิติ ให้ความคมชัด พร้อมเอฟเฟกต์ สมจริง
คุณสมบัติหลักของเกม pg slot ได้แก่
ระบบโบนัสและฟรีสปินหลากหลายรูปแบบ
ฟีเจอร์ตัวคูณรางวัล
โหมดทดลองเล่นฟรี
มีเมนูภาษาไทย
ระบบการเงินรวดเร็ว ทำรายการไว
แพลตฟอร์ม pg slot มักมี การฝาก-ถอน ฝากถอนตลอดเวลา ขั้นต่ำเริ่มต้นเพียง 10 บาท ขึ้นอยู่กับ กติกาแต่ละแพลตฟอร์ม การทำรายการใช้เวลา เพียงไม่กี่วินาที ผ่าน สแกน QR หรือระบบ ธนาคารบนมือถือ ทำให้ธุรกรรมเป็นไปอย่าง ต่อเนื่อง
หมวดเกมฮิต ใน PG Slot
เกม สล็อต PG มีธีมหลากหลาย เช่น
ธีม เทพเจ้า
ธีม ผจญภัย
ธีม โชคลาภ
ธีม สัตว์และธรรมชาติ
หลายคนชอบเกมที่โบนัสเข้าไว พร้อมระบบ โบนัสรอบพิเศษ และ อัตราการจ่ายที่สูง เหมาะกับทั้ง คนเพิ่งเล่น และ ผู้เล่นมือโปร
มาตรฐานระบบ
pg slot ใช้ระบบที่ได้มาตรฐาน มีการ เข้ารหัสข้อมูล และใช้ระบบสุ่มผล ระบบสุ่มมาตรฐาน เพื่อให้ผลลัพธ์ โปร่งใส แพลตฟอร์มที่ให้บริการ pg slot ควรมี ความปลอดภัยสูง
สรุป
PG Slot เป็นตัวเลือกยอดนิยมสำหรับผู้ที่ต้องการเล่นสล็อตออนไลน์ ด้วยจุดเด่นด้าน ระบบลื่นไหล และการทำธุรกรรมที่ ทันใจ ผู้เล่นสามารถเริ่มต้นได้ ง่าย ฝากถอนสะดวก และเลือกเกมได้ หลากหลายแนว เหมาะสำหรับ ทุกระดับประสบการณ์ ในโลกของเกมสล็อตออนไลน์
ทดลองเล่นสล็อต pg
TKBNEKO มอบมิติใหม่ของเกมออนไลน์ ธุรกรรมรวดเร็ว ด้วยระบบสแกน คิวอาร์โค้ด
ในยุคดิจิทัลที่ เทคโนโลยีพัฒนาอย่างรวดเร็ว TKBNEKO พร้อมยกระดับการให้บริการ ด้วยระบบที่ ล้ำสมัย รวดเร็ว และ โปร่งใส เพื่อให้ผู้เล่น มั่นใจ ทุกครั้งที่ใช้งาน
จุดเด่นระบบฝาก-ถอน
ฝากขั้นต่ำ: เริ่มต้น 1 บาท
ถอนขั้นต่ำ: 1 บาท
เวลาฝากเงิน: ภายใน 3 วินาที
ยอดถอน: ไม่จำกัดต่อวัน
เติมเงินง่าย แค่สแกน
สแกน คิวอาร์ ระบบจะ โอนเงินเข้าทันที ขั้นต่ำ 100 บาท สูงสุด ไม่เกิน 500,000 บาทต่อครั้ง
หมวดหมู่เกม
สล็อต: ธีมหลากหลาย
เกมสด: ดีลเลอร์สด
กีฬา: แมตช์ทั่วโลก
ยิงปลา: สนุกได้เงินจริง
โปรโมชั่นและสิทธิพิเศษ
ติดตามหน้า โบนัส พร้อมระบบ VIP และโปรแกรม พันธมิตร
ติดต่อเรา
สอบถามข้อมูลได้ตลอด 24 ชั่วโมง ผ่านหน้า ศูนย์ช่วยเหลือ ทีมงาน TKBNEKO พร้อมดูแลตลอดเวลา
скачать мелбет с официального сайта на андроид
Установить приложение Melbet: Android, iPhone и ПК
Мобильная версия Melbet объединяет букмекерскую контору и казино в одном интерфейсе. Доступны live-ставки, слоты, онлайн-трансляции, аналитика и операции по счёту. Загрузка занимает несколько минут.
Android (APK)
Скачайте APK с официального источника, откройте файл и завершите установку. При необходимости включите доступ к установке сторонних приложений, затем авторизуйтесь.
iOS (iPhone)
Перейдите в App Store, введите в поиске «Melbet», нажмите «Получить», после установки авторизуйтесь в системе.
ПК
Откройте официальный сайт, войдите в личный кабинет и создайте ярлык на рабочий стол. Веб-версия работает как отдельное приложение.
Функционал
Live-ставки с мгновенным обновлением линии, игровой раздел с тысячами игр, просмотр матчей, подробная статистика, уведомления о матчах, регистрация за минуту и поддержка 24/7.
Бонусы
После загрузки доступны бонус на первый депозит, промокоды и фрибеты. Условия зависят от региона.
Безопасность
Скачивайте только с официального сайта, контролируйте адрес сайта, не сообщайте данные доступа третьим лицам и активируйте двухфакторную аутентификацию.
Загрузка выполняется быстро, после чего доступен весь функционал Melbet.
pg
แพลตฟอร์ม TKBNEKO มอบมิติใหม่ของการเดิมพันออนไลน์ ระบบการเงินรวดเร็ว ด้วยระบบสแกน คิวอาร์โค้ด
ในยุคที่ เทคโนโลยีเปลี่ยนวิถีการเดิมพันออนไลน์ไปอย่างสิ้นเชิง TKBNEKO พร้อมยกระดับมาตรฐานการเดิมพัน ด้วยระบบการให้บริการที่ ล้ำสมัย ฉับไว และ ตรวจสอบได้ พร้อมต้อนรับสมาชิกทุกท่านสู่ ประสบการณ์ความบันเทิงรูปแบบใหม่ ที่ ใครๆ ก็เป็นเถ้าแก่ได้
เหตุผลที่ควรเลือก TKBNEKO
TKBNEKO มุ่งมั่นที่จะมอบประสบการณ์จากเกมลิขสิทธิ์แท้ โดยเฉพาะเกมที่ ผ่านการรับรองจากสถาบันที่น่าเชื่อถือ และ เป็นที่นิยมในระดับสากล เพื่อให้ผู้เล่นทุกคน สบายใจ ได้ว่า จะได้รับความเพลิดเพลินกับเกมที่ ยุติธรรม ปลอดภัย และ ตอบโจทย์ผู้เล่นยุคใหม่
ระบบการเงินที่เหนือกว่า
เรามุ่งเน้นความสะดวกของผู้เล่น เพื่อให้คุณ เพลิดเพลินกับการเดิมพันอย่างต่อเนื่อง
ฝากขั้นต่ำ: เพียง 1 บาท
ถอนขั้นต่ำ: เพียง 1 บาท
เวลาฝากเงิน: ใช้เวลาเพียง 3 วินาที
ยอดจำกัดการถอน: ไม่มียอดจำกัดต่อวัน
ธุรกรรมสะดวก แค่สแกนคิวอาร์
เพียงคุณสแกน คิวอาร์ ระบบของเราจะ ประมวลผลอย่างรวดเร็ว ขั้นต่ำเพียง 100 บาท และสามารถฝากได้สูงถึง สูงสุด 500,000 บาท เข้าร่วมความสนุกได้เลย กับ แพลตฟอร์มของเรา ที่ ตอบโจทย์การเดิมพันยุคใหม่
คลังเกมคุณภาพ
TKBNEKO รวมเกมสุดฮิตไว้ในที่เดียว รองรับทุกความชอบของผู้เล่น
สล็อต: หลากหลายธีม แจ็คพอตรอคุณอยู่
เกมสด: ดีลเลอร์ถ่ายทอดสดตลอดเวลา
กีฬา: วางเดิมพันกีฬาหลากหลายรายการ
ยิงปลา: สนุกกับการยิงปลาแบบได้เงิน
อัปเดตโปรโมชันล่าสุด
อย่าลืมแวะมาเยี่ยมชมที่หน้า โปรโมชันล่าสุด เพื่อรับ โบนัสสุดคุ้ม ที่เรามอบให้สมาชิกทุกท่าน นอกจากนี้ยังมีระบบ สมาชิกวีไอพี สำหรับลูกค้าคนสำคัญ และช่องทาง พาร์ทเนอร์ สำหรับผู้ที่สนใจสร้างรายได้ร่วมกับเรา
ฝ่ายบริการลูกค้า
หากมี คำถาม หรือ ข้อเสนอแนะ สามารถติดต่อทีมงานของเราได้ตลอด 24 ชั่วโมงที่หน้า ฝ่ายสนับสนุน และ ส่งความคิดเห็น ทีมงาน ของเรา ยินดีให้บริการทุกท่านด้วยใจ
PG Slot สล็อตยอดฮิต เล่นง่าย ฝากถอนเร็ว
คำค้นหา PG Slot มาแรงในช่วงนี้ ในกลุ่มผู้เล่นเกมสล็อตออนไลน์ เพราะเป็น แบรนด์เกมที่โดดเด่น ด้าน งานภาพคุณภาพสูง ความ นิ่งไม่สะดุด และ โอกาสรับกำไรที่ดี เกมของ PG ออกแบบโดยทีมงานมืออาชีพ ที่รองรับการเล่นทั้งบน สมาร์ทโฟน และ คอมพิวเตอร์
ความโดดเด่น ของ สล็อต PG
สล็อต PG เป็นเกมสล็อตออนไลน์ที่ออกแบบมาให้ โหลดเร็ว เล่นผ่าน ระบบออนไลน์ และรองรับ ทุกแพลตฟอร์ม เข้าเล่นผ่านเว็บได้เลย ผู้เล่นสามารถเข้าเล่นผ่าน Browser ได้ทันที ภาพและเสียงถูกพัฒนาในรูปแบบ สามมิติ ให้ความคมชัด พร้อมเอฟเฟกต์ สมจริง
คุณสมบัติหลักของเกม สล็อต PG ได้แก่
โบนัสและฟรีสปินหลายแบบ
ฟีเจอร์ตัวคูณรางวัล
เล่นฟรีก่อนเติมเงิน
ใช้งานภาษาไทยง่าย
ระบบฝากถอนสะดวก ทำรายการไว
แพลตฟอร์ม pg slot โดยทั่วไปให้บริการ การฝาก-ถอน อัตโนมัติ 24 ชั่วโมง ขั้นต่ำเริ่มต้นเพียง หลักหน่วย ขึ้นอยู่กับ ระบบของผู้ให้บริการ การทำรายการใช้เวลา ไม่กี่วินาที ผ่าน QR Code หรือระบบ แอปธนาคาร ทำให้ธุรกรรมเป็นไปอย่าง ลื่นไหล
หมวดเกมฮิต ใน pg slot
เกม PG Slot มีธีมหลากหลาย เช่น
ธีม เทพเจ้า
ธีม ผจญภัย
ธีม โชคลาภ
ธีม สัตว์และธรรมชาติ
หลายคนชอบเกมที่โบนัสเข้าไว พร้อมระบบ ฟีเจอร์พิเศษ และ โอกาสทำกำไรสูง เหมาะกับทั้ง มือใหม่ และ ผู้เล่นมือโปร
ความปลอดภัย
pg slot ใช้ระบบที่ได้มาตรฐาน มีการ รักษาความปลอดภัย และใช้ระบบสุ่มผล ระบบสุ่มมาตรฐาน เพื่อให้ผลลัพธ์ ตรวจสอบได้ แพลตฟอร์มที่ให้บริการ pg slot ควรมี ระบบดูแลข้อมูล
บทสรุปท้ายบท
pg slot เป็นตัวเลือกยอดนิยมสำหรับผู้ที่ต้องการเล่นสล็อตออนไลน์ ด้วยจุดเด่นด้าน โบนัสหลากหลาย และการทำธุรกรรมที่ ไว ผู้เล่นสามารถเริ่มต้นได้ ทันที ฝากถอนสะดวก และเลือกเกมได้ ครบทุกหมวด เหมาะสำหรับ ทั้งมือใหม่และมือโปร ในโลกของเกมสล็อตออนไลน์
สล็อต
แพลตฟอร์ม TKBNEKO มอบมิติใหม่ของเกมออนไลน์ ธุรกรรมรวดเร็ว ด้วยระบบสแกน QR Code
ในยุคดิจิทัลที่ โลกออนไลน์เติบโตต่อเนื่อง เรามุ่งเน้นมาตรฐานใหม่ของการเดิมพัน ด้วยระบบที่ ล้ำสมัย เสถียร และ ตรวจสอบได้ เพื่อให้ผู้เล่น มั่นใจ ทุกครั้งที่ใช้งาน
ระบบการเงินที่ใช้งานง่าย
ฝากขั้นต่ำ: 1 บาท
ถอนขั้นต่ำ: 1 บาท
เวลาฝากเงิน: ภายใน 3 วินาที
ยอดถอน: ไม่มีลิมิต
ฝากง่าย เพียงสแกน QR Code
สแกน QR Code ระบบจะ ประมวลผลอัตโนมัติ ขั้นต่ำ 100 บาท สูงสุด 500,000 บาท
เกมยอดนิยม
สล็อต: ธีมหลากหลาย
เกมสด: คาสิโนเรียลไทม์
กีฬา: แมตช์ทั่วโลก
ยิงปลา: ลุ้นกำไรทันที
โบนัสและโปรโมชัน
ติดตามหน้า โบนัส พร้อมระบบ สมาชิกพรีเมียม และโปรแกรม แอฟฟิลิเอต
ฝ่ายบริการลูกค้า
สอบถามข้อมูลได้ตลอด 24 ชั่วโมง ผ่านหน้า ติดต่อเรา ทีมงาน TKBNEKO พร้อมดูแลตลอดเวลา
ทดลองเล่นสล็อต pg ไม่ เด้ง
ทดลองเล่นสล็อต pg ฟรี สล็อต PG เกมสล็อตออนไลน์ที่คนค้นหาเยอะ เล่นง่าย ฝากถอนเร็ว
คำค้นหา สล็อต PG มาแรงในช่วงนี้ ในกลุ่มผู้เล่นเกมสล็อตออนไลน์ เพราะเป็น ผู้ให้บริการเกมสล็อตที่มาแรง ด้าน ภาพและเอฟเฟกต์ ความ นิ่งไม่สะดุด และ ระบบจ่ายที่ดึงดูด เกมของ PG ผลิตโดยค่ายมาตรฐาน ที่รองรับการเล่นทั้งบน โทรศัพท์มือถือ และ เดสก์ท็อป
จุดเด่น ของ PG Slot
pg slot เป็นเกมสล็อตออนไลน์ที่ออกแบบมาให้ เข้าเกมไว เล่นผ่าน ระบบอัตโนมัติ และรองรับ ทั้ง iOS และ Android ไม่ต้องดาวน์โหลดแอป ผู้เล่นสามารถเข้าเล่นผ่าน หน้าเว็บ ได้ทันที ภาพและเสียงถูกพัฒนาในรูปแบบ 3D ให้ความคมชัด พร้อมเอฟเฟกต์ จัดเต็ม
คุณสมบัติหลักของเกม PG Slot ได้แก่
ระบบโบนัสและฟรีสปินหลากหลายรูปแบบ
Multiplier
เดโม่ฟรี
มีเมนูภาษาไทย
ระบบฝากถอนสะดวก ทันใจ
แพลตฟอร์ม สล็อต PG ส่วนใหญ่รองรับ การฝาก-ถอน อัตโนมัติ 24 ชั่วโมง ขั้นต่ำเริ่มต้นเพียง 10 บาท ขึ้นอยู่กับ กติกาแต่ละแพลตฟอร์ม การทำรายการใช้เวลา รวดเร็วมาก ผ่าน QR Code หรือระบบ ธนาคารบนมือถือ ทำให้ธุรกรรมเป็นไปอย่าง ลื่นไหล
แนวเกมที่คนเล่นเยอะ ใน PG Slot
เกม pg slot มีธีมหลากหลาย เช่น
ธีม เทพเจ้าและแฟนตาซี
ธีม ลุยด่าน
ธีม เอเชียและโชคลาภ
ธีม สัตว์และธรรมชาติ
เกมยอดนิยมมักเป็นเกมที่แตกง่าย พร้อมระบบ โบนัสรอบพิเศษ และ ระบบจ่ายคุ้มค่า เหมาะกับทั้ง มือใหม่ และ สายสล็อตจริงจัง
มาตรฐานระบบ
PG Slot ใช้ระบบที่ได้มาตรฐาน มีการ ปกป้องข้อมูลผู้เล่น และใช้ระบบสุ่มผล Random Number Generator เพื่อให้ผลลัพธ์ โปร่งใส แพลตฟอร์มที่ให้บริการ สล็อต PG ควรมี ทีมซัพพอร์ต 24 ชม.
บทสรุปท้ายบท
สล็อต PG เป็นตัวเลือกยอดนิยมสำหรับผู้ที่ต้องการเล่นสล็อตออนไลน์ ด้วยจุดเด่นด้าน โบนัสหลากหลาย และการทำธุรกรรมที่ รวดเร็ว ผู้เล่นสามารถเริ่มต้นได้ ไม่ซับซ้อน ฝากถอนสะดวก และเลือกเกมได้ ครบทุกหมวด เหมาะสำหรับ ทั้งมือใหม่และมือโปร ในโลกของเกมสล็อตออนไลน์
pg slot เกมสล็อตออนไลน์ที่คนค้นหาเยอะ เข้าเล่นไว ฝากถอนออโต้
คำค้นหา สล็อต PG มาแรงในช่วงนี้ ในกลุ่มผู้เล่นเกมสล็อตออนไลน์ เพราะเป็น ค่ายเกมที่มีชื่อเสียง ด้าน ภาพและเอฟเฟกต์ ความ นิ่งไม่สะดุด และ โอกาสรับกำไรที่ดี เกมของ PG พัฒนาโดยผู้ให้บริการชั้นนำ ที่รองรับการเล่นทั้งบน สมาร์ทโฟน และ คอมพิวเตอร์
ข้อดี ของ สล็อต PG
สล็อต PG เป็นเกมสล็อตออนไลน์ที่ออกแบบมาให้ เข้าเกมไว เล่นผ่าน ระบบออนไลน์ และรองรับ ทุกแพลตฟอร์ม เข้าเล่นผ่านเว็บได้เลย ผู้เล่นสามารถเข้าเล่นผ่าน Browser ได้ทันที ภาพและเสียงถูกพัฒนาในรูปแบบ สามมิติ ให้ความคมชัด พร้อมเอฟเฟกต์ จัดเต็ม
คุณสมบัติหลักของเกม pg slot ได้แก่
มีรอบโบนัสให้ลุ้นบ่อย
ฟีเจอร์ตัวคูณรางวัล
โหมดทดลองเล่นฟรี
มีเมนูภาษาไทย
ระบบฝากถอนสะดวก ไม่ต้องรอนาน
แพลตฟอร์ม PG Slot โดยทั่วไปให้บริการ การฝาก-ถอน ฝากถอนตลอดเวลา ขั้นต่ำเริ่มต้นเพียง หลักหน่วย ขึ้นอยู่กับ ระบบของผู้ให้บริการ การทำรายการใช้เวลา ไม่กี่วินาที ผ่าน คิวอาร์โค้ด หรือระบบ ธนาคารบนมือถือ ทำให้ธุรกรรมเป็นไปอย่าง ต่อเนื่อง
ประเภทเกมยอดนิยม ใน pg slot
เกม PG Slot มีธีมหลากหลาย เช่น
ธีม เทพเจ้า
ธีม Adventure
ธีม เอเชียและโชคลาภ
ธีม Animal
เกมยอดนิยมมักเป็นเกมที่แตกง่าย พร้อมระบบ Special Feature และ ระบบจ่ายคุ้มค่า เหมาะกับทั้ง คนเพิ่งเล่น และ สายสล็อตจริงจัง
ความปลอดภัย
สล็อต PG ใช้ระบบที่ได้มาตรฐาน มีการ ปกป้องข้อมูลผู้เล่น และใช้ระบบสุ่มผล Random Number Generator เพื่อให้ผลลัพธ์ ตรวจสอบได้ แพลตฟอร์มที่ให้บริการ pg slot ควรมี ความปลอดภัยสูง
บทสรุปท้ายบท
pg slot เป็นตัวเลือกยอดนิยมสำหรับผู้ที่ต้องการเล่นสล็อตออนไลน์ ด้วยจุดเด่นด้าน กราฟิกคุณภาพ และการทำธุรกรรมที่ ทันใจ ผู้เล่นสามารถเริ่มต้นได้ ทันที ฝากถอนสะดวก และเลือกเกมได้ จำนวนมาก เหมาะสำหรับ ทุกระดับประสบการณ์ ในโลกของเกมสล็อตออนไลน์
https://medium.com/@ratypw/ทดลองเล่นสล็อต-pg-70cdb1132344
pg slot สล็อตยอดฮิต เล่นง่าย ฝากถอนเร็ว
คำค้นหา PG Slot ถูกค้นหามากขึ้นเรื่อยๆ ในกลุ่มผู้เล่นเกมสล็อตออนไลน์ เพราะเป็น ค่ายเกมที่มีชื่อเสียง ด้าน ภาพและเอฟเฟกต์ ความ เสถียร และ ระบบจ่ายที่ดึงดูด เกมของ PG ออกแบบโดยทีมงานมืออาชีพ ที่รองรับการเล่นทั้งบน โทรศัพท์มือถือ และ เดสก์ท็อป
จุดเด่น ของ pg slot
สล็อต PG เป็นเกมสล็อตออนไลน์ที่ออกแบบมาให้ เข้าเกมไว เล่นผ่าน ระบบเว็บ และรองรับ ทั้ง iOS และ Android ไม่ต้องติดตั้งเพิ่มเติม ผู้เล่นสามารถเข้าเล่นผ่าน เว็บเบราว์เซอร์ ได้ทันที ภาพและเสียงถูกพัฒนาในรูปแบบ สามมิติ ให้ความคมชัด พร้อมเอฟเฟกต์ สวยงาม
คุณสมบัติหลักของเกม pg slot ได้แก่
ระบบโบนัสและฟรีสปินหลากหลายรูปแบบ
ระบบตัวคูณ
เดโม่ฟรี
ใช้งานภาษาไทยง่าย
ระบบการเงินรวดเร็ว ทำรายการไว
แพลตฟอร์ม pg slot ส่วนใหญ่รองรับ การฝาก-ถอน ออโต้ตลอด 24 ชม. ขั้นต่ำเริ่มต้นเพียง 1 บาท ขึ้นอยู่กับ เงื่อนไขของเว็บไซต์ การทำรายการใช้เวลา เพียงไม่กี่วินาที ผ่าน สแกน QR หรือระบบ ธนาคารบนมือถือ ทำให้ธุรกรรมเป็นไปอย่าง ไม่สะดุด
หมวดเกมฮิต ใน pg slot
เกม PG Slot มีธีมหลากหลาย เช่น
ธีม แฟนตาซี
ธีม ผจญภัย
ธีม เอเชียและโชคลาภ
ธีม Animal
ผู้เล่นนิยมเกมที่มีรอบพิเศษบ่อย พร้อมระบบ ฟีเจอร์พิเศษ และ อัตราการจ่ายที่สูง เหมาะกับทั้ง ผู้เล่นเริ่มต้น และ ผู้เล่นมือโปร
มาตรฐานระบบ
pg slot มีมาตรฐานรองรับ มีการ เข้ารหัสข้อมูล และใช้ระบบสุ่มผล RNG เพื่อให้ผลลัพธ์ ตรวจสอบได้ แพลตฟอร์มที่ให้บริการ pg slot ควรมี ระบบดูแลข้อมูล
บทสรุปท้ายบท
PG Slot เป็นตัวเลือกยอดนิยมสำหรับผู้ที่ต้องการเล่นสล็อตออนไลน์ ด้วยจุดเด่นด้าน กราฟิกคุณภาพ และการทำธุรกรรมที่ รวดเร็ว ผู้เล่นสามารถเริ่มต้นได้ ทันที ฝากถอนสะดวก และเลือกเกมได้ ครบทุกหมวด เหมาะสำหรับ ทั้งมือใหม่และมือโปร ในโลกของเกมสล็อตออนไลน์
TKBNEKO เปิดประสบการณ์ใหม่แห่งการเดิมพันออนไลน์ ธุรกรรมฉับไว ด้วยระบบสแกน คิวอาร์โค้ด
ในยุคที่ เทคโนโลยีเปลี่ยนวิถีการเดิมพันออนไลน์ไปอย่างสิ้นเชิง TKBNEKO เข้ามาสร้างมาตรฐานใหม่ให้กับวงการ ด้วยระบบการให้บริการที่ อัปเดตตลอดเวลา เสถียร และ ชัดเจน พร้อมต้อนรับสมาชิกทุกท่านสู่ โลกแห่งเกมที่เหนือกว่าเดิม ที่ ใครๆ ก็เป็นเถ้าแก่ได้
เพราะอะไรหลายคนจึงเลือก TKBNEKO
เราคัดสรรเกมคุณภาพจากผู้พัฒนาชั้นนำ โดยเฉพาะเกมที่ ผ่านการรับรองจากสถาบันที่น่าเชื่อถือ และ เป็นที่นิยมในระดับสากล เพื่อให้ผู้เล่นทุกคน มั่นใจ ได้ว่า จะได้รับความเพลิดเพลินกับเกมที่ ไม่มีการเอาเปรียบ ข้อมูลไม่รั่วไหล และ มีคุณภาพสูง
ระบบการเงินที่เหนือกว่า
เรามุ่งเน้นความสะดวกของผู้เล่น เพื่อให้คุณ เพลิดเพลินกับการเดิมพันอย่างต่อเนื่อง
ฝากขั้นต่ำ: เพียง 1 บาท
ถอนขั้นต่ำ: ขั้นต่ำ 1 บาท
เวลาฝากเงิน: รวดเร็วทันใจใน 3 วินาที
ยอดจำกัดการถอน: ไม่มีลิมิตการถอนรายวัน
ธุรกรรมสะดวก แค่สแกนคิวอาร์
เพียงคุณสแกน QR Code ระบบของเราจะ ดำเนินการฝากเงินให้อัตโนมัติ ขั้นต่ำเพียง เริ่มต้น 100 บาท และสามารถฝากได้สูงถึง ไม่เกิน 500,000 บาทต่อครั้ง มาร่วมสนุกกันได้แล้ววันนี้ กับ แพลตฟอร์มของเรา ที่ ใช้งานง่าย ทำกำไรได้รวดเร็ว
คลังเกมคุณภาพ
TKBNEKO รวมเกมสุดฮิตไว้ในที่เดียว รองรับทุกความชอบของผู้เล่น
สล็อต: ธีมมากมาย พร้อมลุ้นรางวัลใหญ่
เกมสด: ดีลเลอร์ถ่ายทอดสดตลอดเวลา
กีฬา: เดิมพันกับแมตช์การแข่งขันจากทั่วโลก
ยิงปลา: ลุ้นกำไรจากเกมยิงปลา
ติดตามโปรโมชั่นและสิทธิพิเศษ
อย่าลืมแวะมาเยี่ยมชมที่หน้า โปรโมชันล่าสุด เพื่อรับ สิทธิพิเศษมากมาย ที่เรามอบให้สมาชิกทุกท่าน นอกจากนี้ยังมีระบบ สมาชิกวีไอพี สำหรับลูกค้าคนสำคัญ และช่องทาง พาร์ทเนอร์ สำหรับผู้ที่สนใจสร้างรายได้ร่วมกับเรา
ติดต่อเรา
หากมี ปัญหา หรือ ความคิดเห็น สามารถติดต่อทีมงานของเราได้ตลอด 24 ชั่วโมงที่หน้า ติดต่อเรา และ แบบฟอร์มติดต่อ ทีมงาน TKBNEKO ยินดีให้บริการทุกท่านด้วยใจ
ทดลองเล่นสล็อต pg ไม่ เด้ง
สล็อต
แพลตฟอร์ม TKBNEKO มอบมิติใหม่ของเกมออนไลน์ ธุรกรรมรวดเร็ว ด้วยระบบสแกน คิวอาร์โค้ด
ในยุคดิจิทัลที่ เทคโนโลยีพัฒนาอย่างรวดเร็ว TKBNEKO พร้อมยกระดับการให้บริการ ด้วยระบบที่ ทันสมัย เสถียร และ โปร่งใส เพื่อให้ผู้เล่น อุ่นใจ ทุกครั้งที่ใช้งาน
ระบบการเงินที่ใช้งานง่าย
ฝากขั้นต่ำ: 1 บาท
ถอนขั้นต่ำ: 1 บาท
เวลาฝากเงิน: ภายใน 3 วินาที
ยอดถอน: ไม่มีลิมิต
เติมเงินง่าย แค่สแกน
สแกน QR Code ระบบจะ โอนเงินเข้าทันที ขั้นต่ำ 100 บาท สูงสุด 500,000 บาท
เกมยอดนิยม
สล็อต: ธีมหลากหลาย
เกมสด: ดีลเลอร์สด
กีฬา: แมตช์ทั่วโลก
ยิงปลา: ลุ้นกำไรทันที
โปรโมชั่นและสิทธิพิเศษ
ติดตามหน้า โปรโมชั่น พร้อมระบบ VIP และโปรแกรม แอฟฟิลิเอต
ฝ่ายบริการลูกค้า
สอบถามข้อมูลได้ตลอด 24 ชั่วโมง ผ่านหน้า ศูนย์ช่วยเหลือ ทีมงาน ของเรา พร้อมดูแลตลอดเวลา
ทดลองเล่นสล็อต pg เว็บ ตรง”
pg slot เกมสล็อตออนไลน์ที่คนค้นหาเยอะ เล่นง่าย ฝากถอนเร็ว
คำค้นหา pg slot มาแรงในช่วงนี้ ในกลุ่มผู้เล่นเกมสล็อตออนไลน์ เพราะเป็น ค่ายเกมที่มีชื่อเสียง ด้าน งานภาพคุณภาพสูง ความ นิ่งไม่สะดุด และ โอกาสรับกำไรที่ดี เกมของ PG ผลิตโดยค่ายมาตรฐาน ที่รองรับการเล่นทั้งบน โทรศัพท์มือถือ และ คอมพิวเตอร์
ความโดดเด่น ของ สล็อต PG
PG Slot เป็นเกมสล็อตออนไลน์ที่ออกแบบมาให้ เปิดเกมได้ทันที เล่นผ่าน ระบบออนไลน์ และรองรับ ทุกอุปกรณ์ ไม่ต้องดาวน์โหลดแอป ผู้เล่นสามารถเข้าเล่นผ่าน Browser ได้ทันที ภาพและเสียงถูกพัฒนาในรูปแบบ 3D ให้ความคมชัด พร้อมเอฟเฟกต์ สวยงาม
คุณสมบัติหลักของเกม PG Slot ได้แก่
ระบบโบนัสและฟรีสปินหลากหลายรูปแบบ
ระบบตัวคูณ
เล่นฟรีก่อนเติมเงิน
ใช้งานภาษาไทยง่าย
ระบบฝากถอนสะดวก ไม่ต้องรอนาน
แพลตฟอร์ม pg slot มักมี การฝาก-ถอน ฝากถอนตลอดเวลา ขั้นต่ำเริ่มต้นเพียง หลักหน่วย ขึ้นอยู่กับ กติกาแต่ละแพลตฟอร์ม การทำรายการใช้เวลา รวดเร็วมาก ผ่าน QR Code หรือระบบ แอปธนาคาร ทำให้ธุรกรรมเป็นไปอย่าง ไม่สะดุด
แนวเกมที่คนเล่นเยอะ ใน PG Slot
เกม pg slot มีธีมหลากหลาย เช่น
ธีม เทพเจ้า
ธีม ลุยด่าน
ธีม โชคลาภ
ธีม ธรรมชาติ
ผู้เล่นนิยมเกมที่มีรอบพิเศษบ่อย พร้อมระบบ Special Feature และ อัตราการจ่ายที่สูง เหมาะกับทั้ง ผู้เล่นเริ่มต้น และ สายสล็อตจริงจัง
ความปลอดภัย
สล็อต PG ใช้ระบบที่ได้มาตรฐาน มีการ เข้ารหัสข้อมูล และใช้ระบบสุ่มผล ระบบสุ่มมาตรฐาน เพื่อให้ผลลัพธ์ โปร่งใส แพลตฟอร์มที่ให้บริการ pg slot ควรมี ทีมซัพพอร์ต 24 ชม.
สรุป
pg slot เป็นตัวเลือกยอดนิยมสำหรับผู้ที่ต้องการเล่นสล็อตออนไลน์ ด้วยจุดเด่นด้าน โบนัสหลากหลาย และการทำธุรกรรมที่ ไว ผู้เล่นสามารถเริ่มต้นได้ ไม่ซับซ้อน ฝากถอนสะดวก และเลือกเกมได้ ครบทุกหมวด เหมาะสำหรับ ผู้เล่นทุกสไตล์ ในโลกของเกมสล็อตออนไลน์
ทดลองเล่นสล็อต pg ซื้อฟรีสปิน
Автозайм
Деньги под обеспечение ПТС в городе Самара — представляет собой способ оформить деньги под авто без необходимости продавать автомобиля и без долгих банковских процедур. Главная особенность такого займа — автомобиль продолжает оставаться у собственника, а в качестве залога оформляется лишь ПТС. Это позволяет использовать автомобилем, на протяжении договор займа.
Выдача денег возможна в день подачи заявки. Заявка рассматривается примерно за 15 минут, затем принимается ответ по сумме и условиям. Сумма займа может составлять до уровня 5 000 000 ?, а процентная ставка стартует с уровня 2% в месяц. Период кредитования как правило составляет до 60 мес., поэтому заёмщик выбирает удобный график выплат.
Система оформления заявки работает через интернет. Клиент оставляет форму, вносит информацию об авто и желаемую сумму займа. После проверки данных выносится начальное одобрение. В большинстве случаев средства переводятся в день оформления, после подписания договор займа.
Для оценки параметров применяется калькулятор займа. Например, при сумме 300 000 ? на срок 12 мес. платёж в месяц составит около 33 057 ?. Итоговая переплата за весь срок составит примерно 96 684 ?. Итоговые параметры могут изменяться в зависимости от оценки автомобиля и выбранного срока кредитования.
На сайтах автокредитования часто отображается лента заявок. Она демонстрирует активность сервиса и примеры одобренных заявок по разным городам. Например, заявки на сумму 1 840 000 ? город Тула, 1 890 000 ? город Москва или 1 470 000 ? из Челябинска получают статус «Одобрено». Часть заявок находятся на этапе проверки — например такие суммы, 290 000 ? из Сочи или 720 000 ? город Екатеринбург. Такие блоки отображают текущую активность сервиса и количество обработанных заявок за день и в текущем месяце.
Автозайм с залогом ПТС подходит людям, кому нужно оперативно получить крупную сумму без продажи автомобиля. Основные условия таких займов — процент от 2% в месяц, рассмотрение около 15 минут, сумма до 5 млн ? и возможность оформить заявку через интернет. После подачи заявки заёмщик может дождаться решения, связаться через мессенджер или связаться с менеджером для уточнения деталей оформления.
ทดลองเล่นสล็อต pg ไม่ เด้ง
Автозайм
Займ с обеспечением ПТС в городе Самара — представляет собой вариант получить финансирование под машину без необходимости продавать машины и без длительных банковских процедур. Основная характеристика такого займа — автомобиль продолжает оставаться у собственника, а в качестве залога передаётся только ПТС. Это даёт возможность продолжать пользоваться автомобилем, на протяжении срок договора.
Выдача средств происходит в день подачи заявки. Обращение обрабатывается примерно за 15 минут, затем принимается ответ по сумме займа и условиям. Размер займа может составлять до 5 000 000 ?, а ставка стартует с уровня 2% в месяц. Срок кредитования обычно составляет до 60 мес., по этой причине клиент выбирает подходящий план платежей.
Система подачи заявки доступна онлайн. Заёмщик заполняет форму, указывает информацию об авто и желаемую сумму займа. После проверки документов приходит начальное решение. В большинстве случаев деньги выдаются в тот же день, когда оформляется договор.
Для расчёта условий применяется онлайн-калькулятор. К примеру, при сумме 300 000 ? на срок 12 месяцев платёж в месяц составит около 33 057 ?. Итоговая сумма переплаты за весь срок составит около 96 684 ?. Конечные параметры могут изменяться в зависимости стоимости автомобиля и установленного срока кредитования.
На страницах сервиса автозаймов нередко отображается лента заявок. Этот блок показывает активность системы и образцы обработанных заявок по разным городам. Например, запросы на сумму 1 840 000 ? из Тулы, 1 890 000 ? из Москвы или 1 470 000 ? из Челябинска получают статус «Одобрено». Часть заявок могут находиться в стадии проверки — например, 290 000 ? город Сочи или 720 000 ? город Екатеринбург. Такие блоки отображают текущий поток платформы и число обработанных заявок сегодня и за месяц.
Автозайм с залогом ПТС может подойти людям, кому нужно быстро получить крупную сумму без продажи автомобиля. Базовые параметры подобного финансирования — ставка от 2% в месяц, одобрение примерно 15 минут, размер займа до 5 000 000 ? и вариант оформить заявку через интернет. После подачи заявки клиент может дождаться решения, связаться через мессенджер или связаться с менеджером для уточнения деталей процедуры.
ทดลองเล่นสล็อต pg ฟรี สล็อต PG เกมสล็อตออนไลน์ที่คนค้นหาเยอะ เล่นง่าย ฝากถอนเร็ว
คำค้นหา สล็อต PG ถูกค้นหามากขึ้นเรื่อยๆ ในกลุ่มผู้เล่นเกมสล็อตออนไลน์ เพราะเป็น แบรนด์เกมที่โดดเด่น ด้าน งานภาพคุณภาพสูง ความ นิ่งไม่สะดุด และ โอกาสรับกำไรที่ดี เกมของ PG ผลิตโดยค่ายมาตรฐาน ที่รองรับการเล่นทั้งบน โทรศัพท์มือถือ และ คอมพิวเตอร์
จุดเด่น ของ สล็อต PG
สล็อต PG เป็นเกมสล็อตออนไลน์ที่ออกแบบมาให้ เข้าเกมไว เล่นผ่าน ระบบออนไลน์ และรองรับ ทุกแพลตฟอร์ม เข้าเล่นผ่านเว็บได้เลย ผู้เล่นสามารถเข้าเล่นผ่าน หน้าเว็บ ได้ทันที ภาพและเสียงถูกพัฒนาในรูปแบบ เอฟเฟกต์ 3 มิติ ให้ความคมชัด พร้อมเอฟเฟกต์ จัดเต็ม
คุณสมบัติหลักของเกม สล็อต PG ได้แก่
โบนัสและฟรีสปินหลายแบบ
Multiplier
เดโม่ฟรี
มีเมนูภาษาไทย
ฝากถอนง่าย ไม่ต้องรอนาน
แพลตฟอร์ม PG Slot มักมี การฝาก-ถอน ฝากถอนตลอดเวลา ขั้นต่ำเริ่มต้นเพียง หลักหน่วย ขึ้นอยู่กับ ระบบของผู้ให้บริการ การทำรายการใช้เวลา ไม่กี่วินาที ผ่าน คิวอาร์โค้ด หรือระบบ แอปธนาคาร ทำให้ธุรกรรมเป็นไปอย่าง ต่อเนื่อง
แนวเกมที่คนเล่นเยอะ ใน PG Slot
เกม PG Slot มีธีมหลากหลาย เช่น
ธีม เทพเจ้าและแฟนตาซี
ธีม ผจญภัย
ธีม ความมั่งคั่ง
ธีม สัตว์และธรรมชาติ
หลายคนชอบเกมที่โบนัสเข้าไว พร้อมระบบ Special Feature และ ระบบจ่ายคุ้มค่า เหมาะกับทั้ง คนเพิ่งเล่น และ สายสล็อตจริงจัง
ความปลอดภัย
pg slot ใช้ระบบที่ได้มาตรฐาน มีการ เข้ารหัสข้อมูล และใช้ระบบสุ่มผล Random Number Generator เพื่อให้ผลลัพธ์ ตรวจสอบได้ แพลตฟอร์มที่ให้บริการ สล็อต PG ควรมี ทีมซัพพอร์ต 24 ชม.
บทสรุปท้ายบท
สล็อต PG เป็นตัวเลือกยอดนิยมสำหรับผู้ที่ต้องการเล่นสล็อตออนไลน์ ด้วยจุดเด่นด้าน กราฟิกคุณภาพ และการทำธุรกรรมที่ ไว ผู้เล่นสามารถเริ่มต้นได้ ง่าย ฝากถอนสะดวก และเลือกเกมได้ จำนวนมาก เหมาะสำหรับ ทุกระดับประสบการณ์ ในโลกของเกมสล็อตออนไลน์
rufus Rufus remains a compact, no-cost, open-source utility built to create bootable USB drives. It helps users prepare a USB flash drive that can install an operating system, run diagnostic tools, or start a recovery environment. The program works without installation and can be opened immediately after downloading.
The main purpose of Rufus is helping users to create bootable USB media from ISO images with speed and stability. This allows users to install or run operating systems directly from a USB flash drive without the need for DVDs. The tool works with a broad selection of operating systems and service utilities, which makes the program useful for both regular users and system administrators.
Rufus works on computers with Microsoft Windows, starting from Windows 7. Both 32-bit and 64-bit versions are supported, and there is also a version available for ARM64 architecture.
The software lets users create bootable USB drives from many different ISO images. It can be used to prepare a USB drive for installing Windows 11, Windows 10, Windows 8.1, or Windows 7, as well as various Linux distributions. Rufus also works with DOS systems and other recovery or maintenance tools commonly used for troubleshooting computers.
One of the built-in features of Rufus is the ability to download official Windows ISO images directly from Microsoft servers. This allows users to obtain original installation images for Windows 8.1, Windows 10, and Windows 11 without searching for them on third-party websites.
In addition to creating bootable drives, Rufus can format USB devices. It supports several file systems including FAT32, NTFS, exFAT, UDF, and ReFS. This flexibility allows the USB drive to be prepared for different use cases and compatibility requirements.
Rufus supports both legacy BIOS systems and modern UEFI environments. Because of this, bootable drives created with Rufus can work on older computers as well as newer systems that use UEFI and Secure Boot.
Another feature included in Rufus is Windows To Go support. This option allows users to run a full Windows environment directly from a USB drive. It can be useful for testing systems, performing maintenance, or working on multiple computers without installing Windows on the internal drive.
Rufus also provides the option to bypass certain Windows 11 installation requirements. When creating an installation USB, the program can disable checks for TPM 2.0, Secure Boot, and minimum RAM requirements. This makes it possible to install Windows 11 on computers that would otherwise not meet the official hardware requirements.
One of the reasons Rufus has become popular is its speed and simplicity. The program is extremely small, about 1.9 MB in size, and runs as a portable application without installation. It is distributed under the GPL v3 open-source license, supports more than 70 languages, and contains no advertisements, bundled software, or tracking components.
Rufus works with a large number of ISO images. These include multiple versions of Windows, Windows Server editions, FreeDOS, and various system tools such as GParted, Hiren’s Boot CD, Parted Magic, and Clonezilla. Because of this wide compatibility, the program can be used not only for installing operating systems but also for disk management, data recovery, and system maintenance tasks.
To use Rufus, a computer running Windows 7 or later and a USB flash drive are required. The program does not need to be installed. Users simply download the executable file, run it, select the ISO image they want to use, and create a bootable USB drive. Due to its simplicity, speed, and reliability, Rufus remains one of the most widely used tools for creating bootable USB drives.
ทดลองเล่นสล็อต pg เว็บ ตรง”
PG Slot สล็อตยอดฮิต เข้าเล่นไว ฝากถอนออโต้
คำค้นหา สล็อต PG มาแรงในช่วงนี้ ในกลุ่มผู้เล่นเกมสล็อตออนไลน์ เพราะเป็น ค่ายเกมที่มีชื่อเสียง ด้าน กราฟิก ความ นิ่งไม่สะดุด และ โอกาสรับกำไรที่ดี เกมของ PG ออกแบบโดยทีมงานมืออาชีพ ที่รองรับการเล่นทั้งบน มือถือ และ พีซี
จุดเด่น ของ PG Slot
PG Slot เป็นเกมสล็อตออนไลน์ที่ออกแบบมาให้ เข้าเกมไว เล่นผ่าน ระบบออนไลน์ และรองรับ ทุกแพลตฟอร์ม ไม่ต้องดาวน์โหลดแอป ผู้เล่นสามารถเข้าเล่นผ่าน Browser ได้ทันที ภาพและเสียงถูกพัฒนาในรูปแบบ 3D ให้ความคมชัด พร้อมเอฟเฟกต์ สมจริง
คุณสมบัติหลักของเกม สล็อต PG ได้แก่
มีรอบโบนัสให้ลุ้นบ่อย
ฟีเจอร์ตัวคูณรางวัล
เดโม่ฟรี
มีเมนูภาษาไทย
ระบบการเงินรวดเร็ว ทำรายการไว
แพลตฟอร์ม สล็อต PG ส่วนใหญ่รองรับ การฝาก-ถอน ออโต้ตลอด 24 ชม. ขั้นต่ำเริ่มต้นเพียง 1 บาท ขึ้นอยู่กับ เงื่อนไขของเว็บไซต์ การทำรายการใช้เวลา รวดเร็วมาก ผ่าน QR Code หรือระบบ ธนาคารบนมือถือ ทำให้ธุรกรรมเป็นไปอย่าง ต่อเนื่อง
หมวดเกมฮิต ใน PG Slot
เกม pg slot มีธีมหลากหลาย เช่น
ธีม แฟนตาซี
ธีม ผจญภัย
ธีม ความมั่งคั่ง
ธีม Animal
หลายคนชอบเกมที่โบนัสเข้าไว พร้อมระบบ ฟีเจอร์พิเศษ และ ระบบจ่ายคุ้มค่า เหมาะกับทั้ง มือใหม่ และ ผู้เล่นที่มีประสบการณ์
ความปลอดภัย
สล็อต PG มีมาตรฐานรองรับ มีการ ปกป้องข้อมูลผู้เล่น และใช้ระบบสุ่มผล Random Number Generator เพื่อให้ผลลัพธ์ โปร่งใส แพลตฟอร์มที่ให้บริการ PG Slot ควรมี ความปลอดภัยสูง
สรุป
PG Slot เป็นตัวเลือกยอดนิยมสำหรับผู้ที่ต้องการเล่นสล็อตออนไลน์ ด้วยจุดเด่นด้าน โบนัสหลากหลาย และการทำธุรกรรมที่ รวดเร็ว ผู้เล่นสามารถเริ่มต้นได้ ทันที ฝากถอนสะดวก และเลือกเกมได้ หลากหลายแนว เหมาะสำหรับ ผู้เล่นทุกสไตล์ ในโลกของเกมสล็อตออนไลน์
ทดลองเล่นสล็อต pg ไม่ เด้ง
ทดลองเล่นสล็อต pg ไม่ เด้ง
мелбет официальный сайт скачать
Установить Melbet: Android, iOS и ПК
Мобильная версия Melbet объединяет букмекерскую контору и казино в одном интерфейсе. Пользователю доступны live-ставки, слоты, прямые трансляции, статистика и операции по счёту. Установка занимает несколько минут.
Android (APK)
Скачайте APK с официального источника, запустите установщик и подтвердите установку. При необходимости включите доступ к установке сторонних приложений, затем авторизуйтесь.
iOS (iPhone)
Перейдите в App Store, введите в поиске «Melbet», нажмите «Получить», после установки выполните вход.
ПК
Откройте официальный сайт, авторизуйтесь и создайте ярлык на рабочий стол. Браузерная версия функционирует как отдельное приложение.
Функционал
Live-ставки с мгновенным обновлением линии, казино и слоты, просмотр матчей, аналитические данные, уведомления о матчах, регистрация за минуту и круглосуточная служба поддержки.
Бонусы
После установки доступны приветственный бонус, акционные коды и фрибеты. Правила начисления определяются регионом.
Безопасность
Загружайте только с официальных источников, проверяйте домен, не передавайте пароль третьим лицам и активируйте двухфакторную аутентификацию.
Загрузка выполняется быстро, после чего доступен весь функционал Melbet.
мелбет зеркало скачать
Скачать Melbet: Android, iPhone и компьютер
Приложение Melbet объединяет ставки и казино в едином приложении. Доступны live-ставки, слоты, прямые трансляции, аналитика и операции по счёту. Установка занимает 1–2 минуты.
Android (APK)
Загрузите APK с официального источника, откройте файл и завершите установку. Если требуется включите разрешение на установку из неизвестных источников, затем авторизуйтесь.
iOS (iPhone)
Откройте App Store, найдите «Melbet», нажмите «Получить», после установки выполните вход.
ПК
Перейдите официальный сайт, авторизуйтесь и создайте ярлык на рабочий стол. Веб-версия работает как полноценное приложение.
Функционал
Live-ставки с мгновенным обновлением линии, игровой раздел с тысячами игр, просмотр матчей, аналитические данные, push-оповещения, быстрая регистрация и круглосуточная служба поддержки.
Бонусы
После установки доступны бонус на первый депозит, промокоды и фрибеты. Правила начисления определяются регионом.
Безопасность
Загружайте только с официальных источников, контролируйте адрес сайта, не сообщайте данные доступа третьим лицам и активируйте двухфакторную аутентификацию.
Загрузка выполняется быстро, после чего доступен весь функционал Melbet.
bidik88
мелбет скачать приложение на компьютер
Установить приложение Melbet: APK, iPhone и ПК
Приложение Melbet включает букмекерскую контору и казино в едином приложении. Пользователю доступны live-ставки, слоты, онлайн-трансляции, аналитика и быстрые финансовые операции. Установка занимает 1–2 минуты.
Android (APK)
Загрузите APK с официального источника, запустите установщик и завершите установку. При необходимости включите разрешение на установку из неизвестных источников, затем авторизуйтесь.
iOS (iPhone)
Перейдите в App Store, найдите «Melbet», нажмите «Получить», после установки выполните вход.
ПК
Откройте официальный сайт, войдите в личный кабинет и создайте ярлык на рабочий стол. Браузерная версия функционирует как отдельное приложение.
Функционал
Live-ставки с обновлением коэффициентов, казино и слоты, прямые трансляции, подробная статистика, уведомления о матчах, быстрая регистрация и круглосуточная служба поддержки.
Бонусы
После установки доступны приветственный бонус, промокоды и бесплатные ставки. Правила начисления определяются регионом.
Безопасность
Загружайте только с официального сайта, проверяйте домен, не сообщайте данные доступа третьим лицам и включите 2FA.
Установка занимает несколько минут, после чего доступен весь функционал Melbet.
so i was scrolling reddit yestarday and some freind of mine in a different thread mentioned heaps of wins iniciar sesion and i was skeptical at first but then i actually went and checked it out myself and wow im kinda impressed ngl, way better than expected
http://silichem.co.kr/bbs/board.php?bo_table=free&wr_id=851271
леон игровые автоматы
джойказино зеркало на сегодня
Hello i want share something with you all. I found this site 777bet and is very good for me. The interface is easy to use and customer service is very helpful when i have question.
Guys someone shared ipl live cricket and this is exactly what I was looking for!! Seriously go check it out lol
slot online
Tried it but still not 100% sure if it’s my thing, seems ok so far but gonna give it more time before I make up my mind—the rules are a bit confuseing at first glance. play rummy free against computer
… [Trackback]
[…] Read More on that Topic: coinchapter.com/cryptocurrency-prices-today-doge-eth-matic-gmt-xrp/ […]
Quick pros:
+ Fast loading times
+ Mobile friendly design
+ Easy account setup
+ Responsive support team
+ No annoying ads
[url=https://bajilive-onlinecasino.com/]bajilive222[/url]
Attractive section of content. I just stumbled upon your blog and in accession capital to assert that I acquire actually enjoyed account your blog posts. Anyway I will be subscribing to your feeds and even I achievement you access consistently fast.
GemstoneRO Servers is one of the best Ragnarok Online private servers in 2026, offering two free RO servers: Renewal with EP21 Age of Heroes, chapter 1, chapter2 4th jobs, Doram, latest skills and mid rates, and Loki Pre-Renewal with classic gameplay, custom quests, unique gear and 100x rates. Play on PC or Android with an active global community, low-latency proxies, weekly updates and no paytowin. Join GemstoneRO and enjoy Ragnarok Online your way.
GemstoneRO Servers is one of the best Ragnarok Online private servers in 2026, offering two free RO servers: Renewal with EP21 Age of Heroes, chapter 1, chapter2 4th jobs, Doram, latest skills and mid rates, and Loki Pre-Renewal with classic gameplay, custom quests, unique gear and 100x rates. Play on PC or Android with an active global community, low-latency proxies, weekly updates and no paytowin. Join GemstoneRO and enjoy Ragnarok Online your way.
RateMyRagnarok is a modern Ragnarok Online private server ranking and review platform for 2026. Find the best Ragnarok private servers, RO private servers, Renewal servers, Pre-Renewal servers, low-rate, mid-rate, high-rate, custom, mobile, and classic Ragnarok Online servers. Compare rates, features, reviews, uptime, community activity, and server details. List your RO server for free and help players discover trusted Ragnarok Online private servers.
Thanks for your submission. I also think that laptop computers have grown to be more and more popular right now, and now are usually the only kind of computer used in a household. This is due to the fact that at the same time that they’re becoming more and more reasonably priced, their computing power is growing to the point where these are as effective as desktop computers through just a few years ago.
Everyone loves what you guys tend to be up too. This type of clever work and reporting! Keep up the terrific works guys I’ve incorporated you guys to our blogroll.
Magnificent beat ! I would like to apprentice while you amend your web site, how could i subscribe for a weblog web site? The account helped me a applicable deal. I have been a little bit acquainted of this your broadcast offered vibrant transparent idea
Wonderful site. A lot of useful information here. I?m sending it to several friends ans also sharing in delicious. And certainly, thanks for your effort!
excellent submit, very informative. I’m wondering why the opposite experts of this sector don’t realize this. You should continue your writing. I am confident, you’ve a great readers’ base already!
Thanks for your article. Another thing is that to be a photographer will involve not only problem in recording award-winning photographs but hardships in acquiring the best dslr camera suited to your needs and most especially issues in maintaining the quality of your camera. This really is very true and clear for those photography lovers that are straight into capturing a nature’s engaging scenes — the mountains, the actual forests, the actual wild or seas. Visiting these amazing places certainly requires a video camera that can surpass the wild’s harsh settings.
What i do not realize is actually how you are not actually much more well-liked than you may be now. You are very intelligent. You realize thus considerably relating to this subject, produced me personally consider it from numerous varied angles. Its like women and men aren’t fascinated unless it is one thing to do with Lady gaga! Your own stuffs excellent. Always maintain it up!
One thing I’d prefer to say is the fact that before getting more computer memory, have a look at the machine into which it would be installed. When the machine will be running Windows XP, for instance, a memory threshold is 3.25GB. Setting up over this would just constitute just a waste. Make sure that one’s motherboard can handle the upgrade quantity, as well. Great blog post.
Your place is valueble for me. Thanks!?
These days of austerity along with relative stress about incurring debt, most people balk resistant to the idea of employing a credit card to make purchase of merchandise or even pay for a vacation, preferring, instead just to rely on the particular tried plus trusted technique of making settlement – hard cash. However, if you’ve got the cash on hand to make the purchase in full, then, paradoxically, this is the best time to be able to use the credit cards for several reasons.
Pretty component to content. I just stumbled upon your site and in accession capital to assert that I get in fact enjoyed account your blog posts. Anyway I will be subscribing to your augment or even I success you get right of entry to constantly rapidly.
When I originally commented I clicked the -Notify me when new comments are added- checkbox and now every time a remark is added I get four emails with the same comment. Is there any way you may take away me from that service? Thanks!
Thanks for sharing your ideas. I might also like to state that video games have been ever before evolving. Modern tools and improvements have assisted create practical and fun games. These types of entertainment video games were not actually sensible when the real concept was first being experimented with. Just like other kinds of technological innovation, video games also have had to evolve through many decades. This itself is testimony to the fast growth of video games.
I found your weblog site on google and examine a few of your early posts. Proceed to maintain up the excellent operate. I simply further up your RSS feed to my MSN Information Reader. Seeking forward to reading extra from you in a while!?
I have been exploring for a bit for any high quality articles or weblog posts in this sort of space . Exploring in Yahoo I finally stumbled upon this web site. Studying this info So i?m happy to show that I have an incredibly excellent uncanny feeling I found out just what I needed. I such a lot indisputably will make certain to don?t put out of your mind this site and provides it a look regularly.
One thing I would really like to say is the fact that car insurance canceling is a terrifying experience and if you are doing the best things as a driver you simply will not get one. A lot of people do receive the notice that they’ve been officially dropped by their particular insurance company and many have to struggle to get more insurance after having a cancellation. Low cost auto insurance rates tend to be hard to get following a cancellation. Having the main reasons for auto insurance cancelling can help drivers prevent completely losing in one of the most vital privileges available. Thanks for the tips shared through your blog.
?Levantemos nuestros brindis por cada aspirante al triunfo !
–
?Que la fortuna avance contigo con el placer de ganancias brillantes !
I would love to add that if you do not now have an insurance policy or else you do not remain in any group insurance, you could well really benefit from seeking the aid of a health insurance professional. Self-employed or individuals with medical conditions typically seek the help of an health insurance agent. Thanks for your article.
Greetings from Ohio! I’m bored to death at work so I decided to browse your blog on my iphone during lunch break. I love the information you provide here and can’t wait to take a look when I get home. I’m amazed at how fast your blog loaded on my mobile .. I’m not even using WIFI, just 3G .. Anyways, very good blog!
affordablecanvaspaintings.com.au is Australia Popular Online 100 percent Handmade Art Store. We deliver Budget Handmade Canvas Paintings, Abstract Art, Oil Paintings, Artwork Sale, Acrylic Wall Art Paintings, Custom Art, Oil Portraits, Pet Paintings, Building Paintings etc. 1000+ Designs To Choose From, Highly Experienced Artists team, Up-to 50 percent OFF SALE and FREE Delivery Australia, Sydney, Melbourne, Brisbane, Adelaide, Hobart and all regional areas. We ship worldwide international locations. Order Online Your Handmade Art Today.