 gains 6% amid red crypto day - sell-off risks intensify")
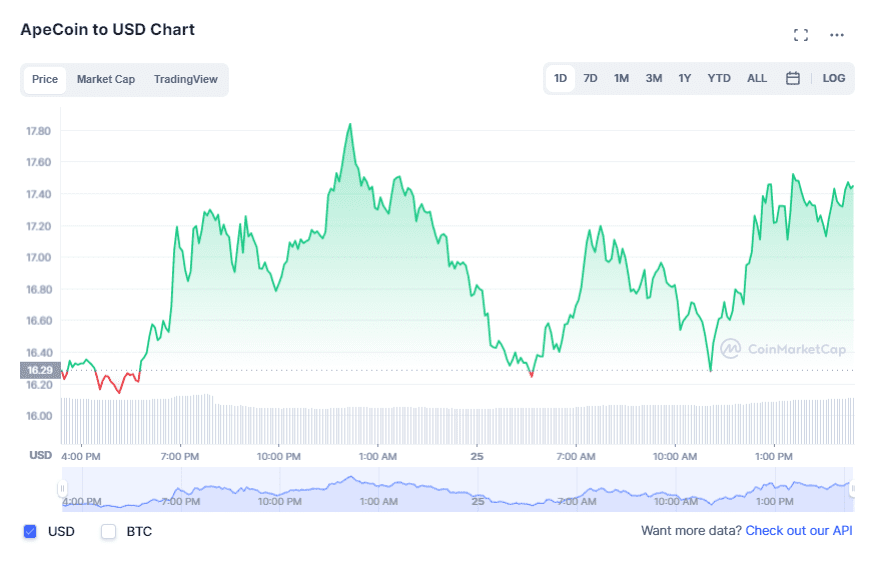
YEREVAN (CoinChapter.com) – Apecoin, the digital asset created in association with popular NFT collections Bored Ape Yacht Club (BAYC), registered a green candle amid ubiquitous declines across the crypto market. As a result, the APE/USD exchange rate clocked at $17.3 in Monday’s European session, after a 6% daily uptrend.
However, APE bulls might not have much time to wave the bullish flag, as the four-hour chart flashed several warnings.
Also read: Apecoin (APE) price jumps nearly 40% on Yugalabs airdrop rumor.
Bearish Apecoin (APE) chart
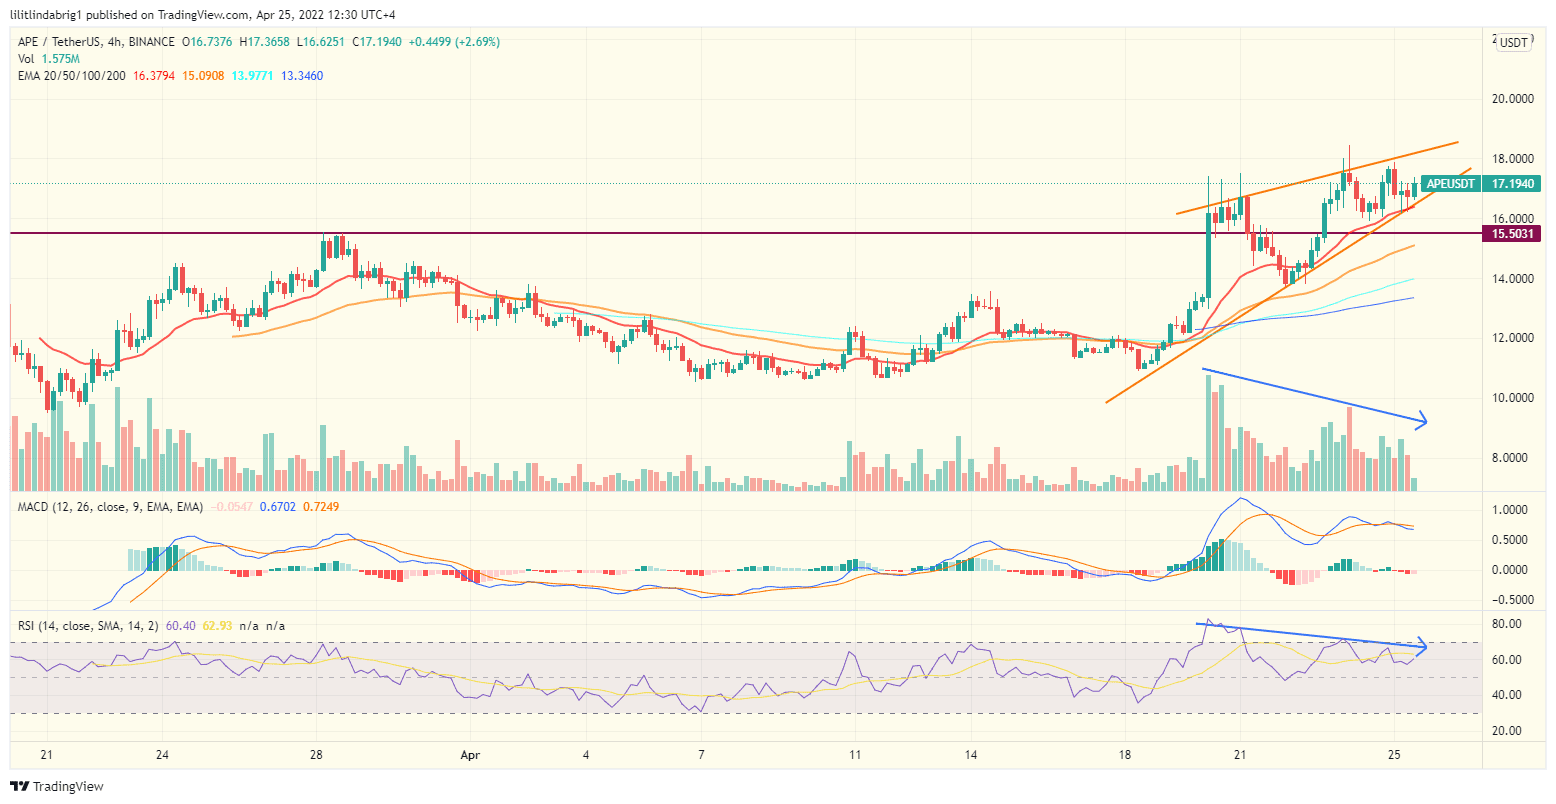
In detail, Apecoin has done well in the previous week and registered a 55% upside move. However, the bullish price action formed a setup dubbed the Rising Wedge. It features two trendlines with a positive slope. They envelop the price action and drive the price up while lowering the swing.
Also read: ApeCoin jumps 17% in two days on news of Bored Ape movie.
The Rising Wedge predicts a downfall after the digital asset exhausts the pattern. Moreover, the decline could equal the maximal distance between the trendlines, which pins the target price for APE at $14, i.e., almost 18% lower than the current value.
Diversions back the claim.
Moreover, the Apecoin token’s four-hour chart threw other bearish technicals. For example, despite the higher highs of the price action, the trading volumes have been declining since Apr. 19-20 jump. The said deviation forecasts a looming decline.
Additionally, another diversion fuelled the bearish forecast. The relative strength index (RSI; purple graph at the bottom) registered a similar picture.
In detail, the RSI is a momentum indicator that measures the magnitude of recent price changes to analyze overbought or oversold conditions. Lower highs on the RSI despite the bullish price action also indicate a looming sell-off.
Also read: BAYC’s ApeCoin has slumped over 70% from debut high already.
Based on the factors listed above, Apecoin (APE) might face a near-20% decline in the upcoming sessions.

… [Trackback]
[…] Read More on on that Topic: coinchapter.com/apecoin-ape-gains-6-amid-red-crypto-day-sell-off-risks-intensify/ […]
… [Trackback]
[…] Read More Information here to that Topic: coinchapter.com/apecoin-ape-gains-6-amid-red-crypto-day-sell-off-risks-intensify/ […]
… [Trackback]
[…] Info to that Topic: coinchapter.com/apecoin-ape-gains-6-amid-red-crypto-day-sell-off-risks-intensify/ […]