

NEW DELHI (CoinChapter.com) — Fantom (FTM) could fall by 60% from its current price levels following a possible ‘double top’ formation.
In detail, a double top is a bearish technical reversal pattern. It appears when an asset reaches a high price level twice in a row with a moderate decline between the two highs. Then, prices falling below support equal to the low between the two highs confirm the pattern.
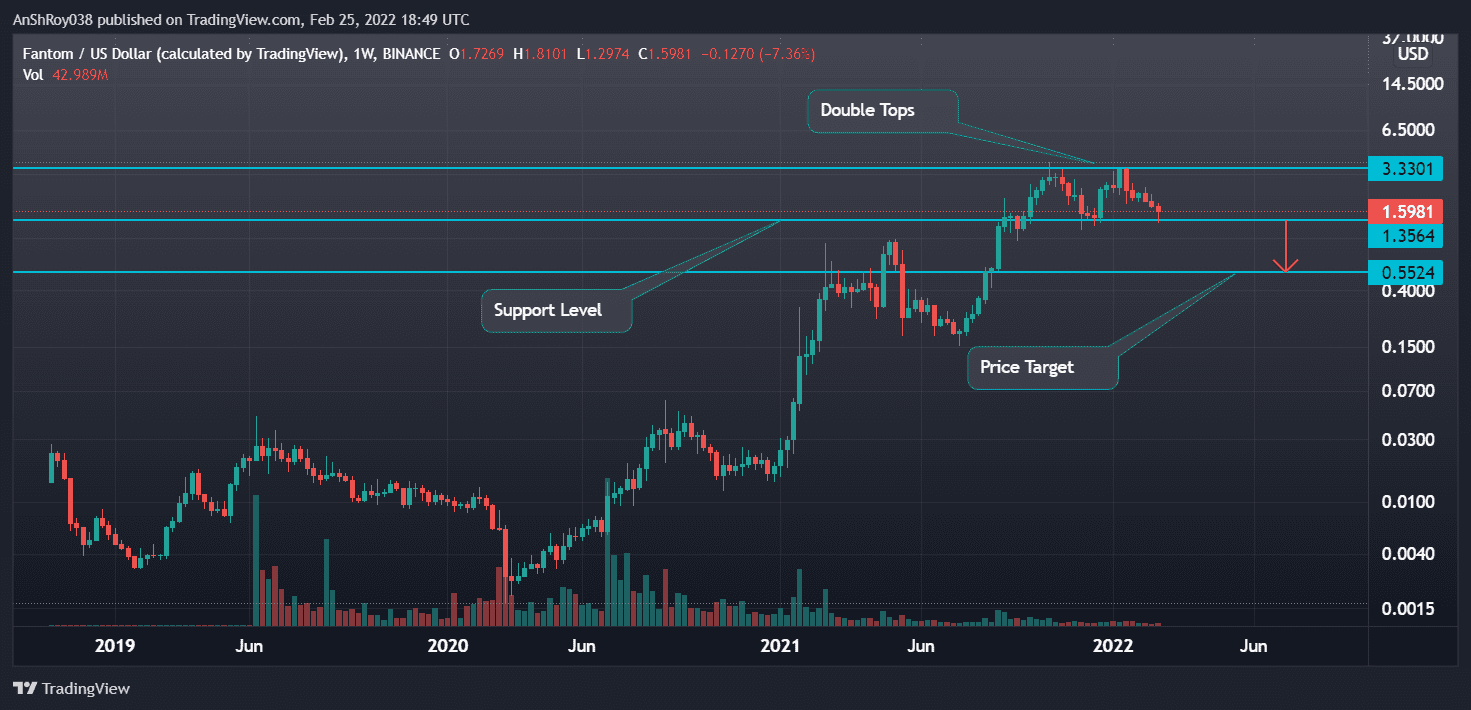
Once an asset’s prices break below the support level, the price target equals the distance between the pattern’s height. Hence, the Fantom token has a price target of $0.552, a drop of 60% from the breakout level if the double top pattern holds.
Fantom Faces Death Cross Woes
Aside from the double top pattern, FTM also has bearish pressure from an upcoming death cross between its 26-day exponential moving average (white wave) and 200-day moving average (red wave).
Also Read: Fantom (FTM) surpasses Ethereum in number of transactions.In detail, a death cross forms when a token’s short-term moving average trendline moves below a relative long-term moving average. Traders believe the technical pattern signals negative sentiment and weakness.
The death cross often indicates the onset of bearish price action, resulting in significant selling pressure. If Fantom succumbs to the resulting FUD, prices could fall to immediate support near the $1.46 price level. Moreover, an extended selling spree might see support near $1.3 come into play.
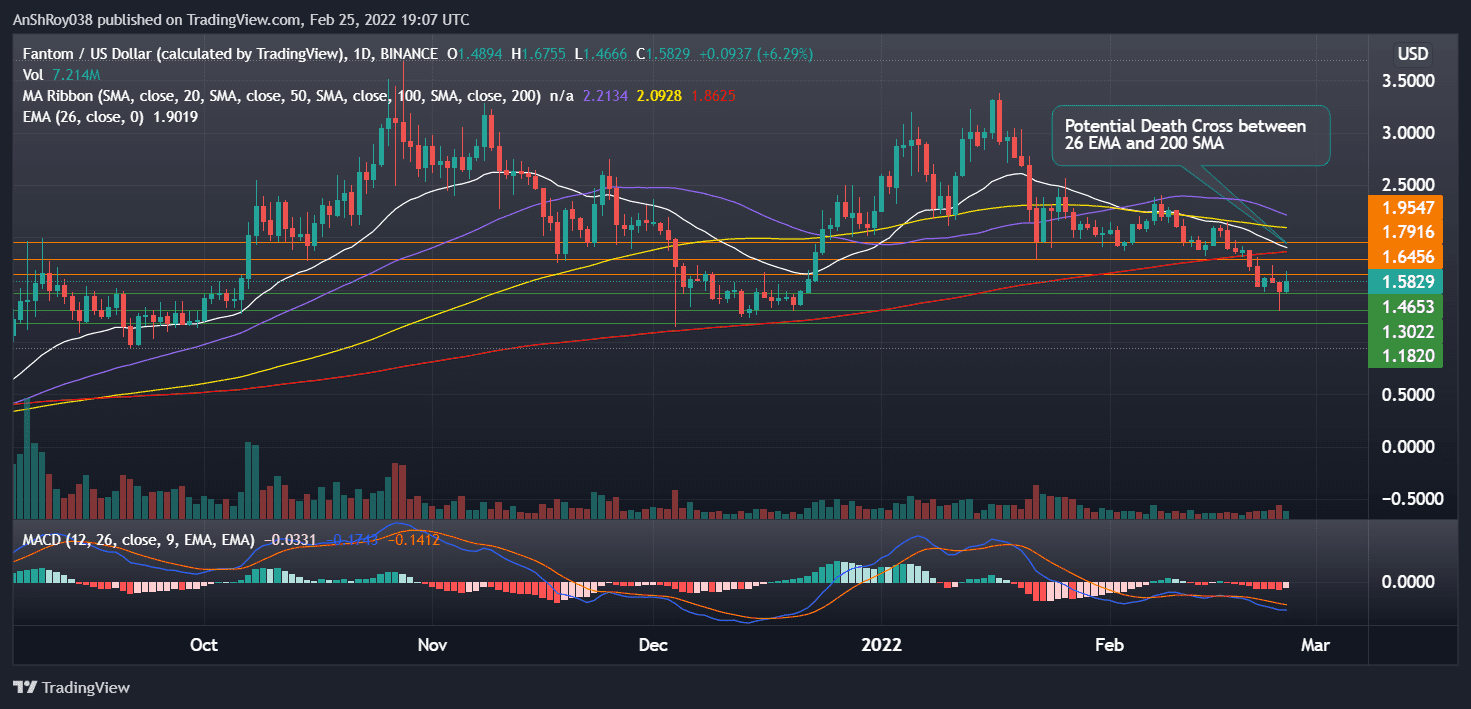
Once prices break below the support line of the double top pattern, it will likely the downside movement would see FTM consolidate near support at $1.18 before either rebounding or reaching the pattern’s price target.
Meanwhile, trend-based momentum oscillator MACD continues to be bearish for the Fantom token.
Bars on the MACD histogram, which plots the difference between the MACD line (difference of 12-day and 26-day EMA) and the MACD signal line (9-day EMA of MACD), remain negative after charting a bearish crossover on Feb 17.
FTM RSI Near Oversold Regions
The relative strength index for Fantom is currently neutral, clocking 37.32 on the daily charts. In addition, the RSI trendline has twice rebounded from the border of the oversold region (RSI<30).
An oversold RSI usually spells an upcoming trend reversal for an asset. If FTM becomes oversold, bulls hope the RSI theory holds and FTM rebounds. If that happens, the Fantom token will target immediate resistance at $1.65.
Also Read: Fantom (FTM) will replace Solana (SOL) by TVL in 2022, according to predictions.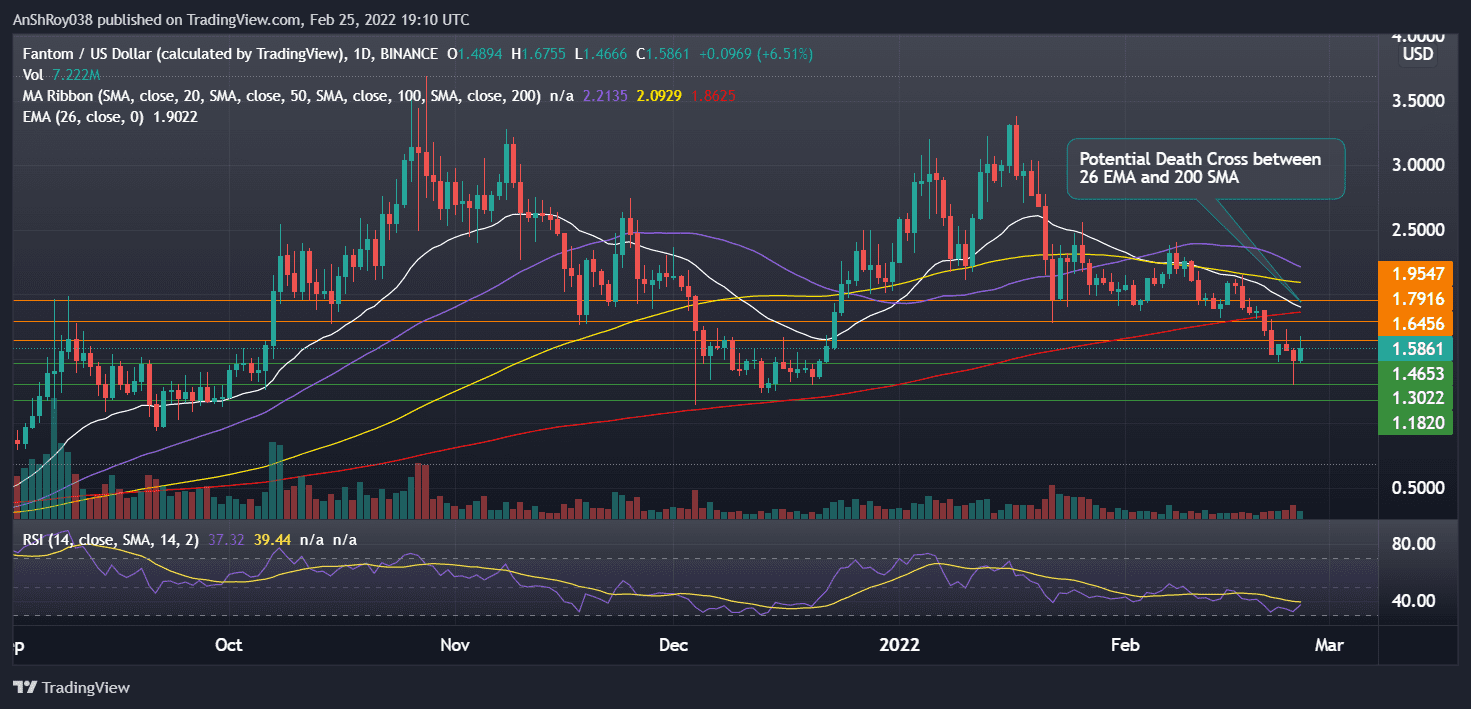
Additionally, a market-wide buying spree would bring Fantom prices to challenge resistance near $1.8. Finally, if FTM flips $1.8 resistance, the Fantom token could reach $2 before prices pull back.
At the time of writing, FTM was trading at $1.59, up 6.99% on the day.

… [Trackback]
[…] Find More to that Topic: coinchapter.com/fantom-eyes-60-downside-risks-as-ftm-forms-a-double-top-pattern/ […]
… [Trackback]
[…] Read More here to that Topic: coinchapter.com/fantom-eyes-60-downside-risks-as-ftm-forms-a-double-top-pattern/ […]