

Key Fantom Takeaways:
- Fantom’s blockchain recorded over 1.2 million transaction on Monday, exceeding those of Ethereum for the first time.
- FTM token’s price moved up on Tuesday after falling 32% in the previous week.
- Fantom charted a ascneding triangle on its weekly charts.
NEW DELHI (CoinChapter.com) — Blockchain platform Fantom overtook Ethereum (ETH) in terms of the number of transactions on the platform for the first time.
On Monday, Fantom processed over 1.2 million transactions, as per data from Fantomscan, a slightly higher number than Ethereum’s 1.1 million transactions. Investors looking for newer avenues to farm yields could be behind the increased number of transactions.
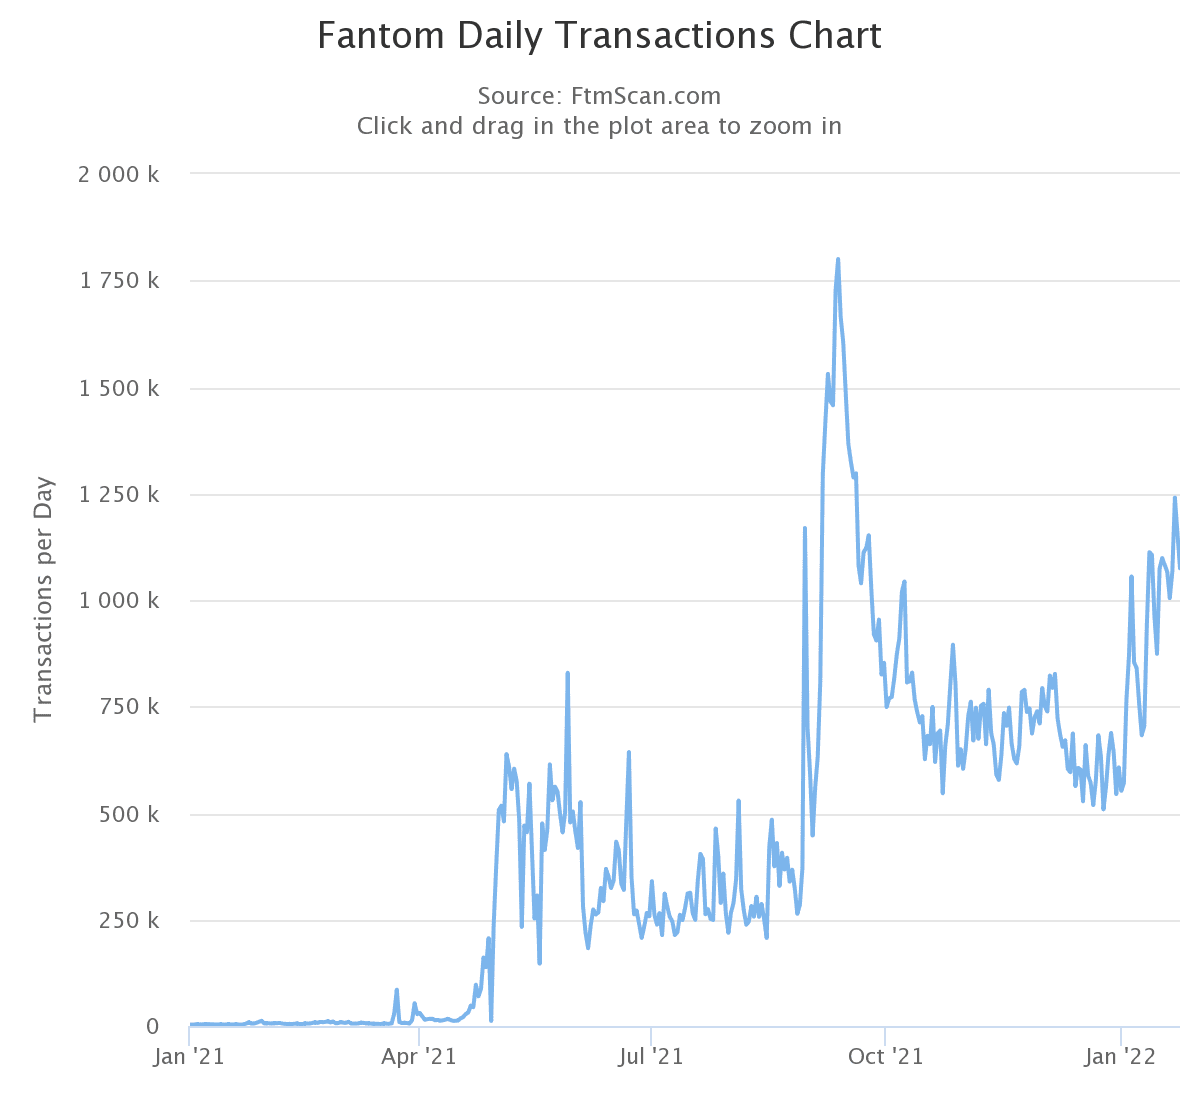
In addition, Fantom maintained upwards of eight transactions per second on Jan 24. However, the 1.2 million transactions are still shy of Fantom’s ATH transaction numbers of 1.8 million.
Also Read: Fantom (FTM) will replace Solana (SOL) by TVL in 2022, according to predictions.Furthermore, Fantom moved to the third spot in the list of largest DeFi ecosystems by TVL, thanks to increasing developer activity and interest in Fantom-based products. Moreover, high yield rewards are also fueling growth on the Fantom network.
Mercenary capital came over to Fantom to yield farm these projects as they were providing incredible yields on single-sided staking.
Excerpt from Delphi Digital ReportFantom’s (FTM) Token Ascending Triangle On Weekly Chart
Fantom’s native token FTM charted an ascending triangle on its weekly charts.
In detail, a horizontal trendline connecting swing highs and a rising trendline connecting swing lows forms an ascending triangle pattern. Analysts often consider the technical setup a continuation pattern, as prices would typically breakout in the price direction prevailing before the triangle.
As such, if prices breakout above the horizontal trendline, it marks the start of a bullish triangle.
 Token Ascending Triangle On Weekly Chart")
However, if prices break below the triangle, it would mark the beginning of a bear run. In both cases, the price target would be equal to the height of the triangle, at its thickest point, added/or subtracted from the breakout point.
Also Read: Fantom (FTM) steals show in crypto market as it shoots for ATH, spike 17%.Hence, the FTM price has a bullish breakout target of 171% above its current price level at $6.32. On the other hand, a bearish breakout places the price target at $0.03, carving off 98.6% from the Fantom token’s prices.
FTM Price Chart
FTM prices dropped 47.5% in the past week, going from a high of $3.38 to reach $1.77 before recovering. However, the Fantom token still ended the week down 31.2%, going down with the marketwide crypto crash.
The Fantom token gained nearly 16% on Sunday. Moreover, FTM jumped over 12% on Tuesday, opening the day at $2.25 before falling to $2.15. Over the course of the day, FTM rose steadily to challenge its immediate resistance near $2.5

The $2.5 resistance comes from the Fantom token’s 26-day Exponential Moving Average line. Once FTM flips 26-day EMA resistance, the next target for Fantom would be the resistance at $2.65. If FTM continues to rally upward, the Fantom token could reach $2.8 before retreating.
Meanwhile, the relative strength index for FTM is currently neutral, clocking a value of 48.44 on the daily charts.

On the other hand, if FTM starts moving downwards, the token has support from its 50-day Moving Average trendline near $2.2. Sustained downside movement could bring into play support near $2.
At the time of writing, FTM was trading at $2.4, up 8.08% on the day.

… [Trackback]
[…] Find More here on that Topic: coinchapter.com/fantom-ftm-surpasses-ethereum-in-number-of-transactions/ […]
… [Trackback]
[…] Read More on that Topic: coinchapter.com/fantom-ftm-surpasses-ethereum-in-number-of-transactions/ […]
… [Trackback]
[…] Read More on on that Topic: coinchapter.com/fantom-ftm-surpasses-ethereum-in-number-of-transactions/ […]