Key Takeaways:
- Fantom’s FTM token would likely reach $5-$6 in the next bull run, an analyst asserts.
- However, bearish technical patterns indicate FTM might fall over 56% from current levels.
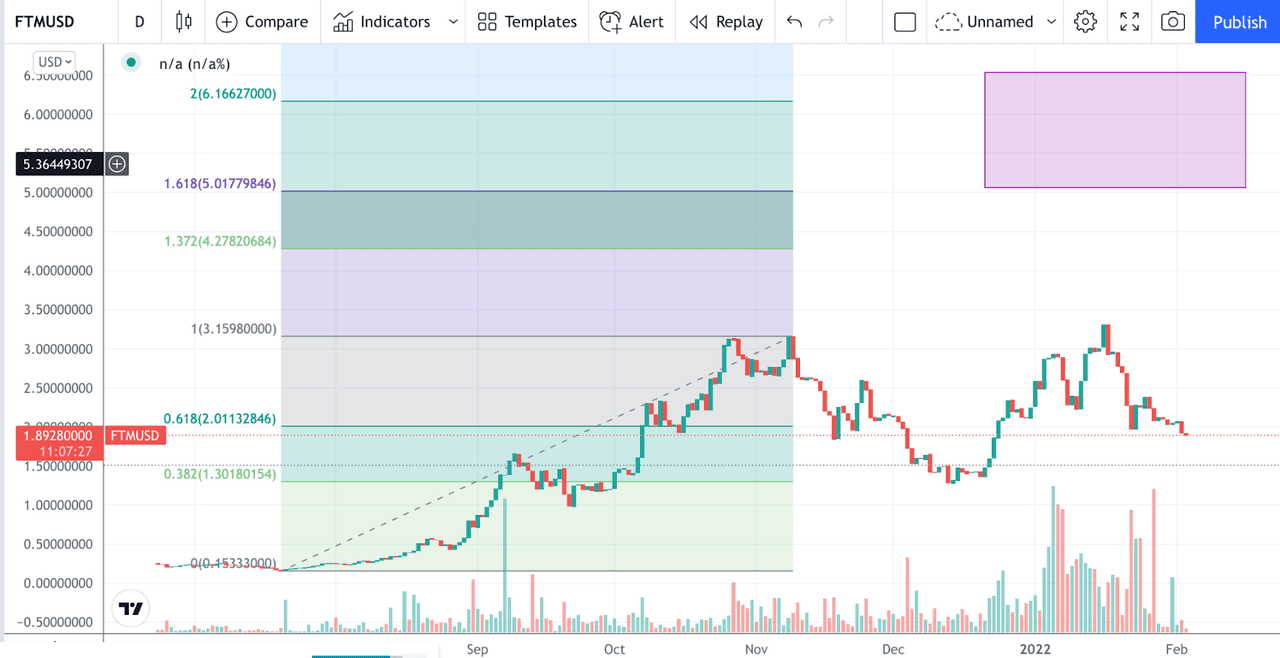
NEW DELHI (CoinChapter.com) — Fantom’s native token, FTM, is likely to reach $5-6 in the next bull run, asserts an analyst going by the moniker ‘The Digital Trend.’
The analyst cited ‘Elliot Wave Theory’ for his predictions, stating that he believed Fantom is entering a wave 3 rally.
In detail, the Elliot Wave theory looks for recurrent long-term price patterns, identifying impulse waves that set up a pattern and corrective waves that oppose the larger trend. The Digital Trend also noted that before starting its bull run, Fantom would likely dip lower.
In addition, the analyst highlighted the benefits of Fantom, noting Fantom’s claimed 20,000 transactions per second. He explained how each node achieving consensus independently helps Fantom maintain high transaction speeds.
Fantom uses a system called Lachesis, which uses a Directed Acyclic Graph (DAG) based asynchronous non-deterministic algorithm that helps the platform achieve Byzantine fault tolerance. As a result, Fantom can create each new block independently on its blockchain.
Furthermore, The Digital Trend noted the independent nature of blocks on the Fantom blockchain enhances its decentralized nature. However, the analyst also noted the platform’s recent misfortunes, such as the Fantom-based protocol Fantasm Finance suffering an exploit for over $2.6 million.
Also Read: Fantom (FTM) surpasses Ethereum in number of transactions.Moreover, Fantom foundation’s technical adviser Andre Cronje and senior solutions architect Anton Nell announced they were in the crypto space. Fantom had to issue a statement to contain the fallout from the announcement.
While the analyst believes the next bull run would take FTM to new record highs, the immediate outlook for the Fantom token remains bearish. FTM has painted two bearish technical patterns on its charts, further adding to the negative sentiment around the token.
Fantom’s FTM Paints A Double Top Pattern
The departure of Fantom’s Andre Cronje and Anton Nell sent many tokens on the Fantom network down. Compounding the bearish outlook for FTM is a double top pattern the token has painted.
In detail, a double top is a bearish technical reversal pattern. It appears when an asset reaches a high price level twice in a row with a moderate decline between the two highs. Then, prices falling below support equal to the low between the two highs confirm the pattern.
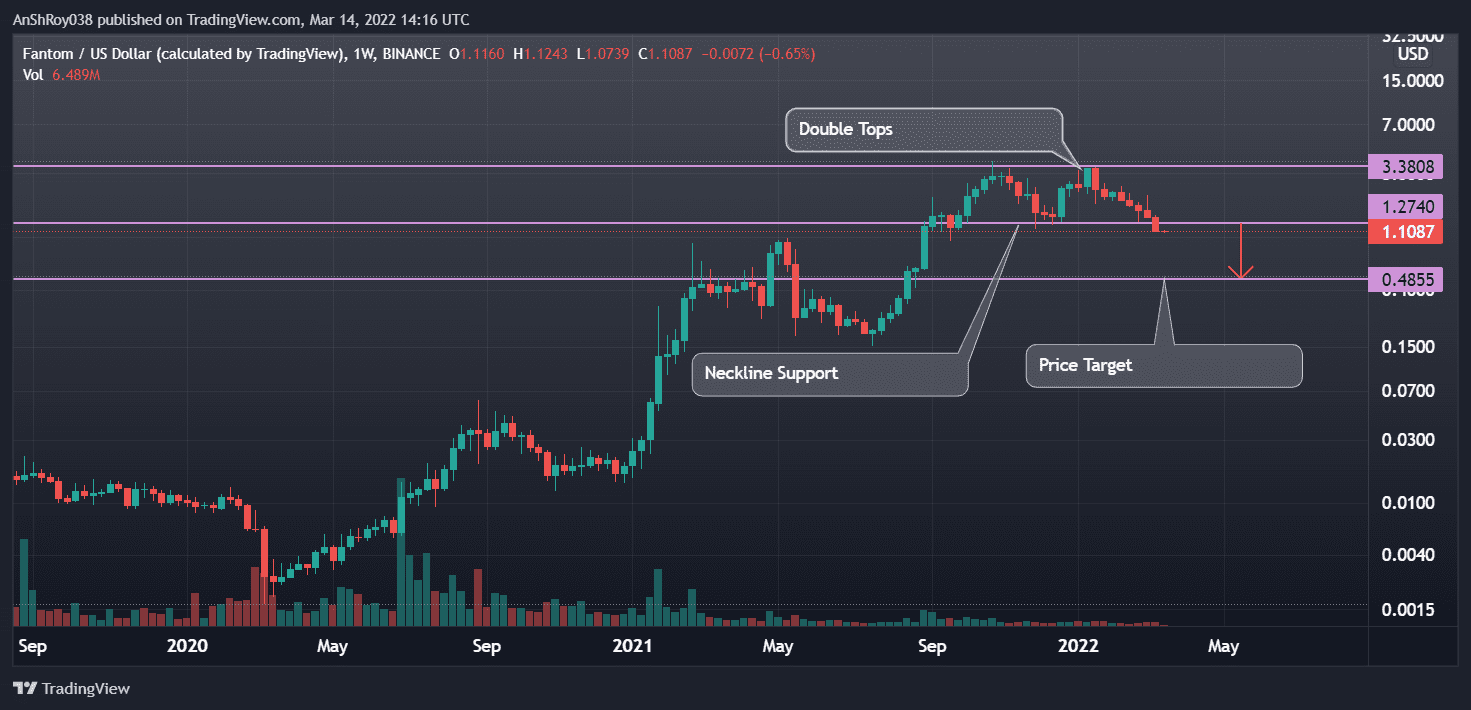
Once an asset’s prices break below the support level, the price target equals the distance between the pattern’s height. Fantom broke below the neckline support at $1.274 in the week ending Mar 13, thus likely confirming the double top pattern breakout.
Hence, the Fantom token has a price target of $0.486, a drop of nearly 62% from the breakout level, if prices continue to fall. In addition, the Fantom token’s moving average (MA) trendlines are moving to form another death cross.
Fantom Price Chart
FTM’s 50-day MA (purple wave) moved below its 200-day MA (red wave) on Mar 9, forming a bearish technical pattern called death cross.
In detail, a death cross forms when a token’s short-term moving average trendline moves below a relative long-term moving average. Traders believe the technical pattern signals negative sentiment and weakness.
Also Read: Fantom (FTM) will replace Solana (SOL) by TVL in 2022, according to predictions.The death cross often indicates the onset of bearish price action, resulting in significant selling pressure. Afterward, FTM prices fell 22.5% between Mar 10’s high ($1.374) to Mar 14’s low ($1.059).
Moreover, another death cross looms over the Fantom token, between FTM’s 100-day (yellow wave) and 200-day MA. As such, it is likely FTM prices would fall to immediate support near $1.03. FTM’s recent downtrend has pushed its prices to levels last seen in Sept 2021.
The formation of a second death cross could push prices below immediate support, bringing support near $0.96 into play.
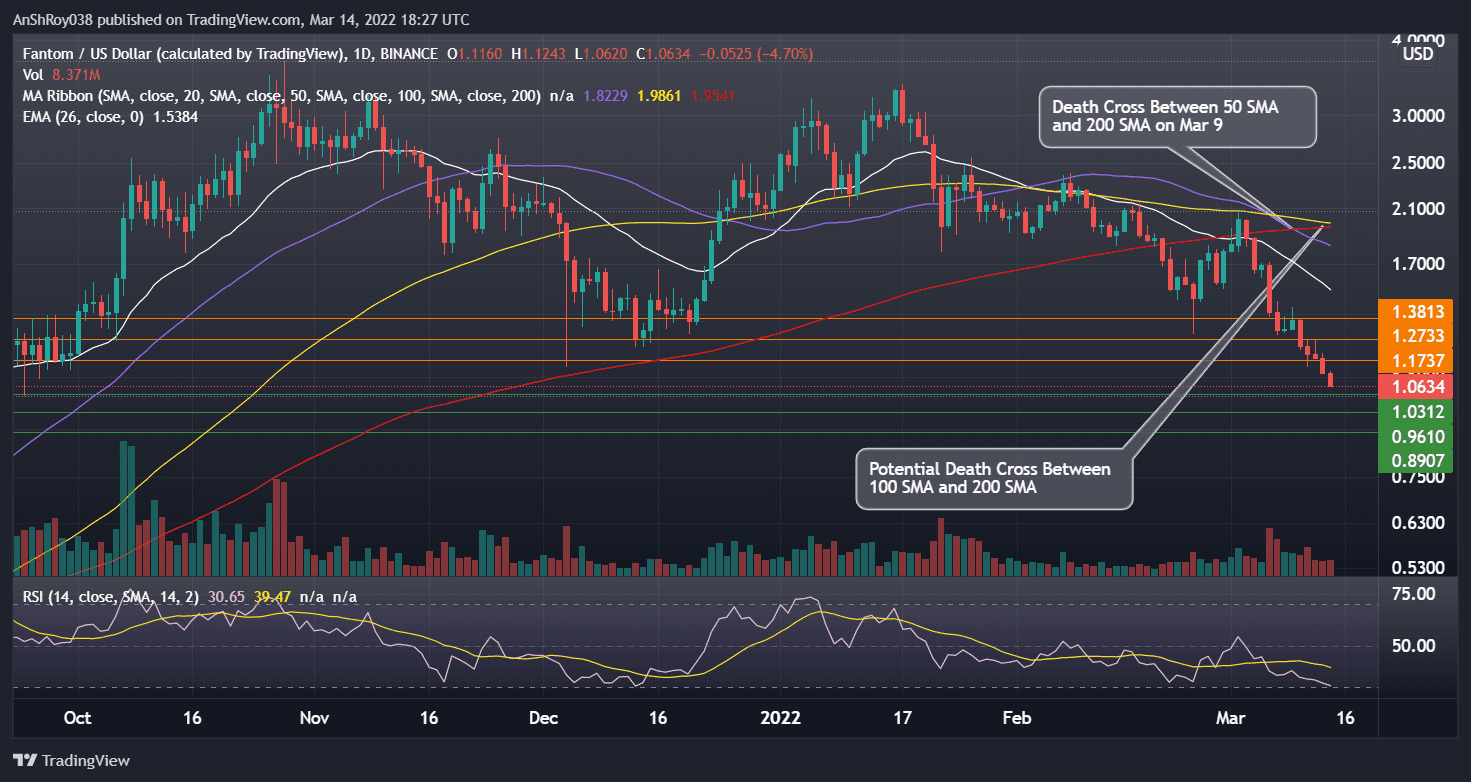
Meanwhile, the relative strength index for the Fantom token is near oversold regions, clocking 30.65 on the daily charts. In detail, the RSI measures the magnitude of recent price changes to analyze overbought or oversold conditions.
When the RSI goes below 30, the asset enters the oversold region, indicating a bullish trend reversal is on the cards. With FTM’s RSI nearing oversold levels, investors who rely on RSI would likely move in to buy the dip and trigger a rally.
If FTM starts moving up, its prices would have to flip immediate resistance at $1.17 before challenging resistance near $1.3. Finally, a sustained uptrend could see FTM recovering to $1.4 before corrections pull back prices.
At the time of writing, FTM was trading at $1.07, down 4.03% on the day.

… [Trackback]
[…] There you will find 87277 additional Info to that Topic: coinchapter.com/fantom-ftm-could-hit-5-6-next-analyst-explains-why/ […]
… [Trackback]
[…] Read More here on that Topic: coinchapter.com/fantom-ftm-could-hit-5-6-next-analyst-explains-why/ […]
… [Trackback]
[…] Info on that Topic: coinchapter.com/fantom-ftm-could-hit-5-6-next-analyst-explains-why/ […]