
Yerevan (CoinChapter.com) — Holo prices rebounded over the last 24 hours, breaking away from a downside trend the surfaced in the wake of an overall cryptocurrency market crash.
The HOT/USD exchange rate inched to an intraday high of $0.012, up 11.50 percent into the Friday trading session. At its week-to-date low, the pair was changing hands for $0.010. That brought HOT’s overall upside to rebound up by 23.52 percent.
Read more: Altcoins in Focus on 11/05/2021: Reef, Cardano, Holo, BitTorrent, Wink
The early-week decline in Holo markets surfaced as Elon Musk dropped a bombshell on the flagship cryptocurrency Bitcoin. In a U-turn, the billionaire investor reversed his plans to accept bitcoin tokens for Tesla’s electric vehicles. He cited the environmental issues related to bitcoin mining for his sudden sentimental shift on cryptocurrency. The BTC/USD exchange rate fell to as low as circa $46,000 after Mr. Musk’s announcement.
Altcoins typically tail the Bitcoin market trend. HOT was no different. The data integrity protocol token, which was already on its way downward after rallying by almost up to 5,250 percent in 2021, strengthened built its bearish momentum on the Tesla news. It fell by 68 percent from its all-time high of $0.031.
Holo Price Outlook
Now the HOT/USD exchange rate corrects, just in line with Bitcoin and other altcoin markets. Meanwhile, certain technical indicators provide bullish backstops to the ongoing price rebound.
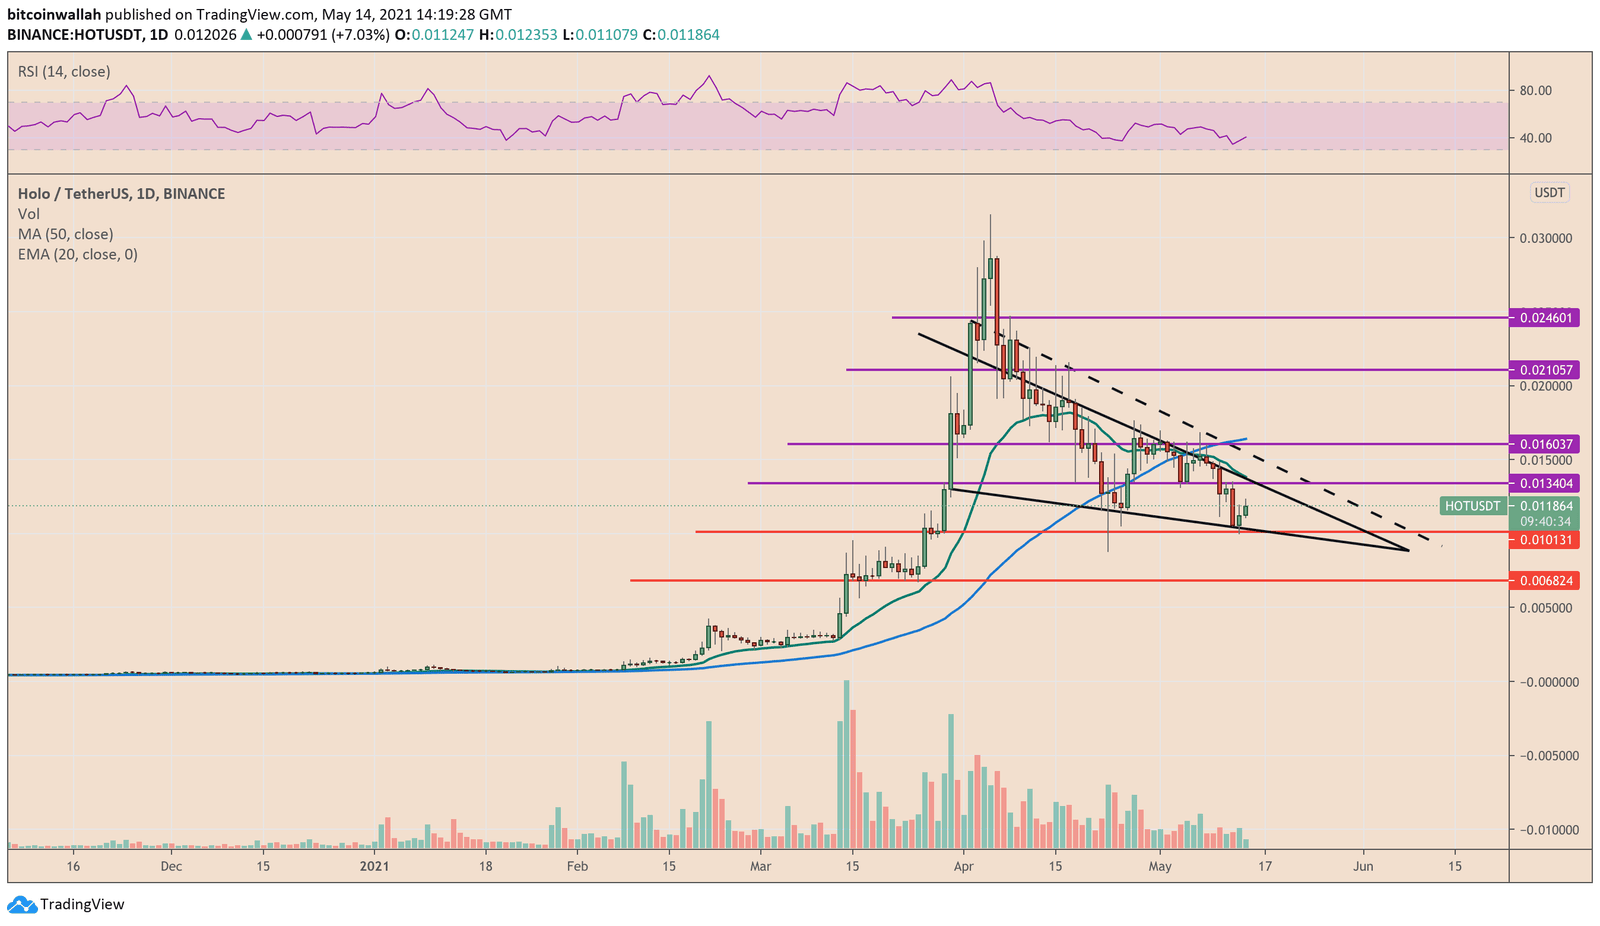
The chart above depicts Holo inside two different patterns. Bordered by a blacked falling trendline and a redded horizontal support line appears like a Descending Triangle. Meanwhile, tilting the red line lower makes the entire pattern look like a Falling Wedge.
Descending Triangle appears during a downtrend. So, it risks extending the sell-off should the price break below the red horizontal trendline. In that case, the downside target is as below as the maximum height of the Triangle. But the interim target sits near $0.0068 due to its historical significance as support during the March 2021 trading session.
Read more: Holo (HOT) Follow Up 06: That Risky Bullish Breakout is [Almost] Happening
On the other hand, the Falling Wedge pattern is a bullish reversal structure. That means HOT/USD could keep trading lower only to attempt an upside breakout at or ahead of hitting the Wedge’s apex — the point where its two trendlines converge. Technically, a bullish move above the Wedge upper trendline would take the price as higher as the maximum Wedge height.
Ideal upside levels to watch on the next breakout, irrespective of the patterns, are flashed in purple in the chart above. They provide decent long opportunities providing traders maintain stop loss targets below their entry levels to minimize their risks.

… [Trackback]
[…] Information to that Topic: coinchapter.com/holo-hot-follow-up-07-price-rebounds-as-bullish-indicator-battles-bearish-one/ […]
… [Trackback]
[…] Find More Info here to that Topic: coinchapter.com/holo-hot-follow-up-07-price-rebounds-as-bullish-indicator-battles-bearish-one/ […]