
MANALI (CoinChapter.com) — VeChain (VET) has doubled its prices in just over a month, rising nearly 110% — from $0.039 on Feb. 24 to as high as $0.0816 on Mar. 28, before bears moved to book profits on Monday.
VET’s’ strong upside move had it break above its two key resistance levels: the 50-day exponential moving average (the yellow wave) and the 100-day EMA (the purple wave). Nonetheless, its 200-day EMA (green wave) remains a hurdle, as shown in the chart below.
Adding fuel to the VeChain token’s ongoing bull run, VET’s 20-day EMA (red wave) moved above its 50-day EMA (yellow wave) to form a bullish technical chart called a Golden Cross.
A golden cross is a bullish technical signal that forms when a short-term MA line moves above a relatively long one. Traders and analysts usually interpret the pattern as an indicator of a definitive uptrend in the market.
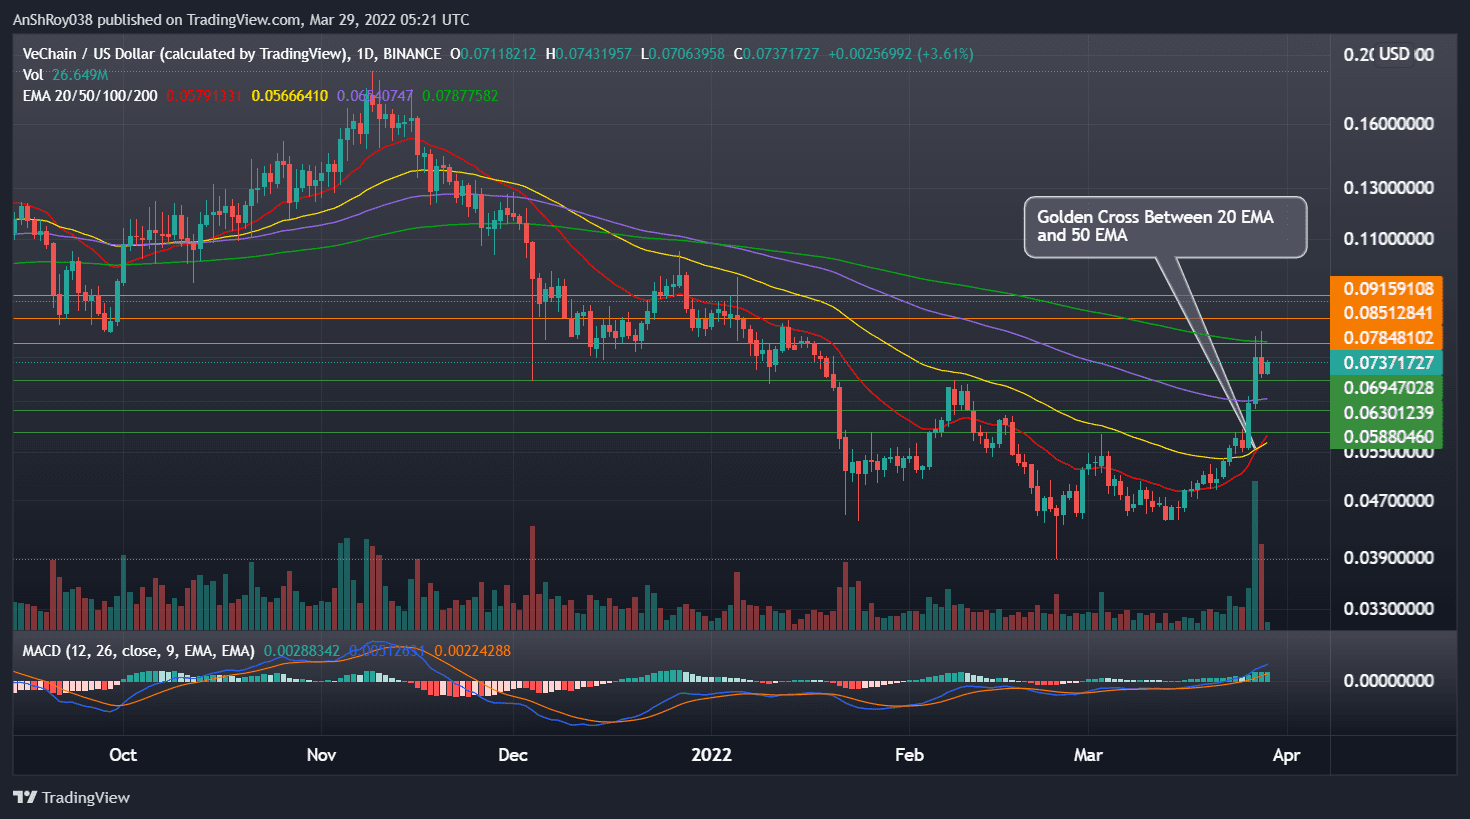
Bulls will try to move the price above the 200-day EMA to target immediate resistance at $0.0785. If VET flips immediate resistance, the VeChain token will next target $0.089, a price level that VET tested in Sept 2021.
Finally, VET faces resistance near $0.092, which earlier acted as resistance during most of Dec 2021.
Also Read: Grayscale considers adding Vechain (VET) token amid market recovery.Meanwhile, momentum oscillator MACD continues to be bullish for the VeChain token. The MACD histogram, which plots the difference between the MACD line (difference of 12-day and 26-day EMA) and the MACD signal line (9-day EMA of MACD), is charting expanding positive bars daily charts.
Expanding positive bars indicate the strengthening of bullish momentum for VET’s prices.
VeChain’s Overbought RSI Likely To Ruin The Party
On the other hand, the relative strength index paints a picture in favor of the bears.
The VeChain token’s relative strength index, or RSI, became overbought as VET began the weekend. To recap, traders often consider an overbought RSI a prelude to an upcoming trend reversal in bears’ favor. As such, overbought RSI levels often trigger sell-offs.
Also Read: VeChain (VET) token price plunge 10% as foundation plans to float stablecoin VeUSD.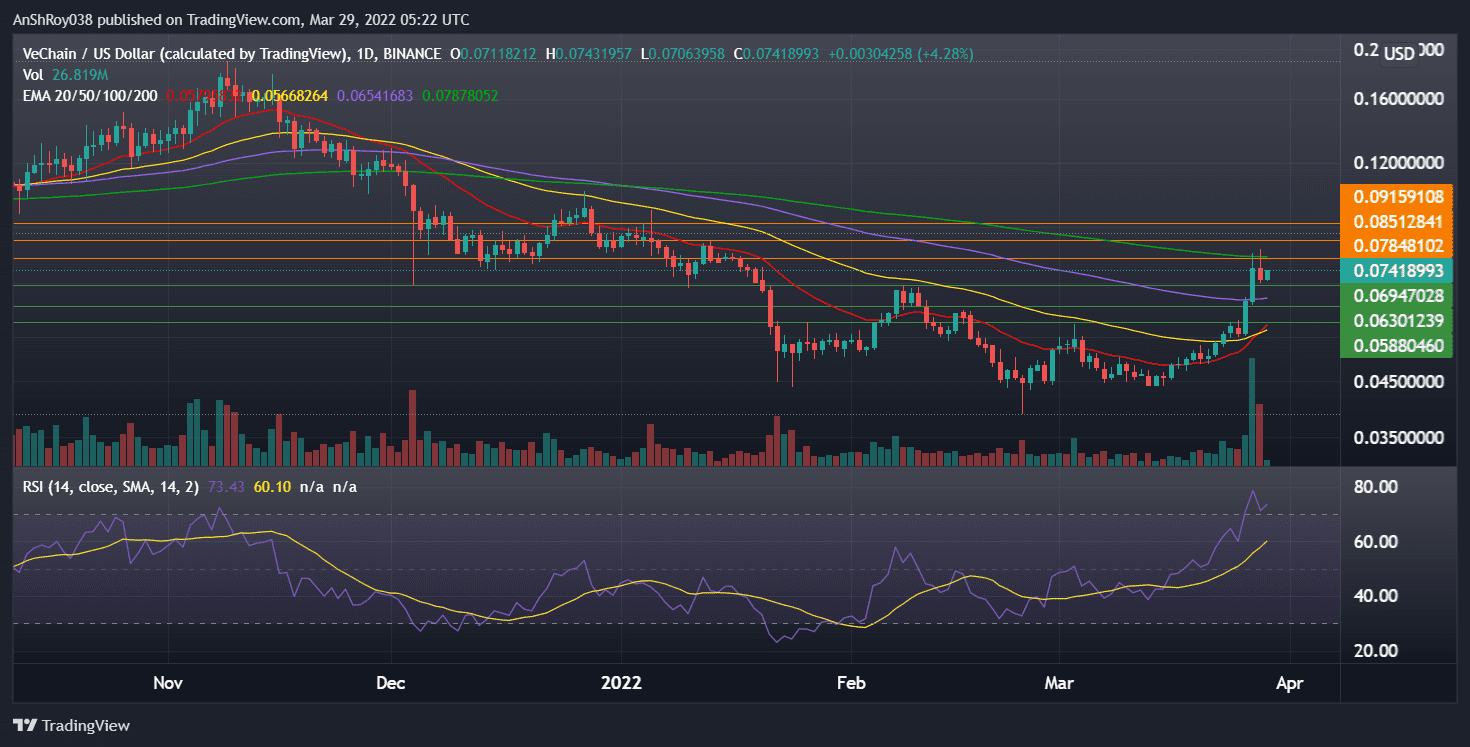
The high RSI also indicates traders’ high return expectations. In addition, the VeChain token’s uptrend has not stuttered much despite its RSI reaching 73.85 on the daily charts. Although, the long upper wicks on VET’s daily candles indicate bears are moving to book profits.
Although VET’s RSI moved down following Monday’s downtrend, the token is moving up again on Mar. 29.
When VET’s current uptrend exhausts, the token would likely move to support near $0.0742. If VET breaks below immediate support, the VeChain token would likely test support near $0.069 before moving to support from VET’s 100-day EMA (purple wave) near $0.0651.
At the time of writing, VET was trading at $0.0743, up 4.49% on the day.
