
NEW DELHI (CoinChapter.com) — Cryptocurrency exchange KuCoin’s native token KCS prices have been moving upstream against the crypto market’s bearish trend, jumping more than 79% between May 12’s low of $9.5 to reaching an intraday high of $17.13 on May 23.
On the other hand, the total crypto market cap fell by more than $64 billion in the same time frame.

KuCoin prices uptrend started after the token’s relative strength index rebounded from oversold levels on May 12. It seems KCS prices reacted in a textbook manner to oversold RSI levels.
Also Read: Chainlink price risks 30% decline in May as LINK paints a bearish continuation pattern.In detail, RSI measures the magnitude of recent price changes to analyze overbought or oversold conditions. An oversold RSI is often a prelude to a bullish trend reversal. KuCoin’s RSI is currently neutral, with 55.48 on the daily charts.
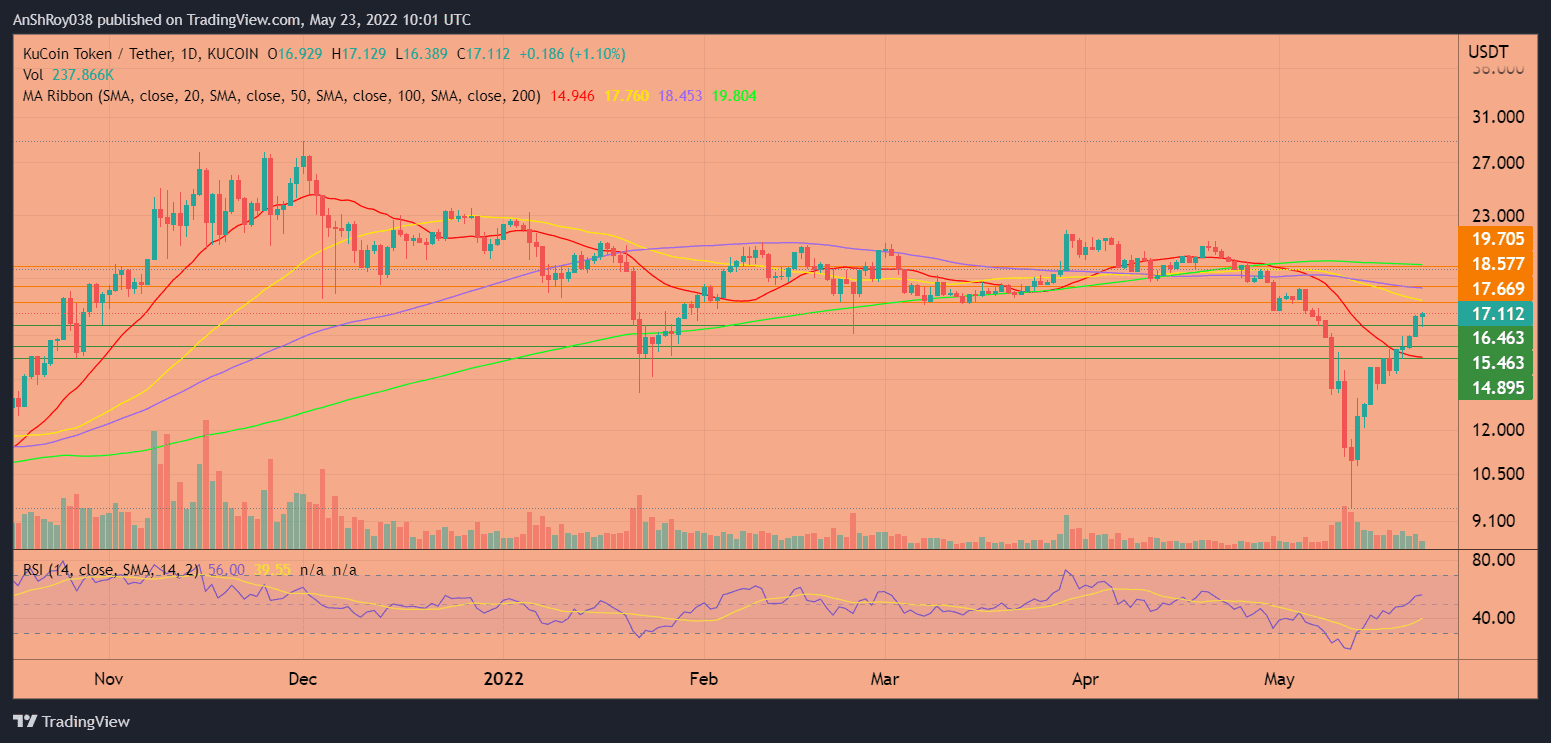
If KuCoin’s uptrend falters, KCS prices could fall to immediate support near $16.5. A breach below immediate support could see the KuCoin token test support near $15.4.
Finally, a sustained sell-off might push KCS prices down to support from its 20-day moving average (20-day MA, red wave) near $14.9, nearly 13% below current price levels, before recovering. A rebound off the 20-day MA might suggest a potential change in trend.
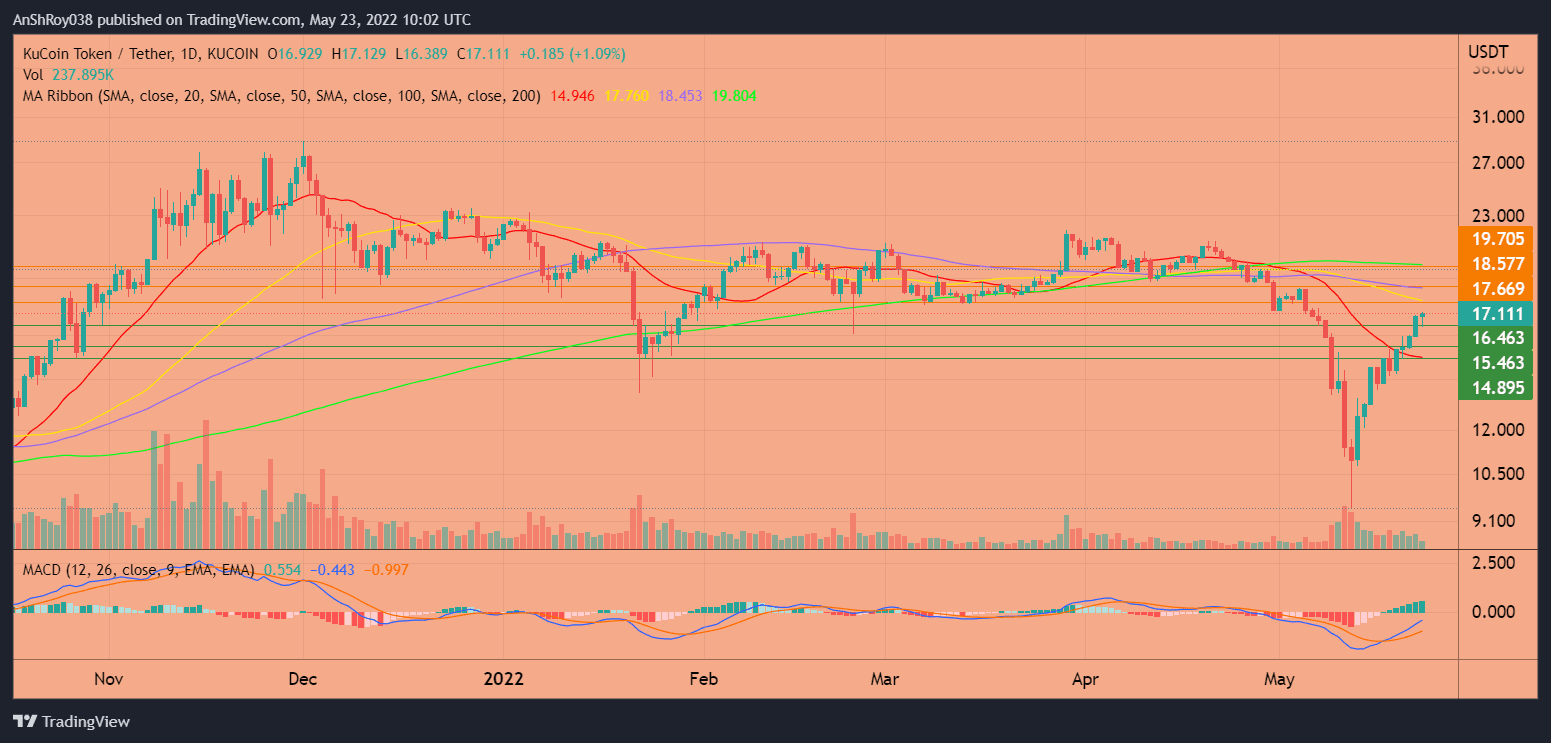
KuCoin MACD Remains Bullish
Meanwhile, the momentum oscillator MACD continues to forecast a strengthening upward momentum for the KuCoin token.
Positive bars on the MACD histogram have been expanding, indicating that the MACD line (difference between 12-day and 26-day EMA) is moving away from the MACD signal line (9-day EMA of MACD).
In addition, the long lower wick on May 12’s candle suggests a buy-the-dip mentality among investors. If bulls continue to push KCS prices, the token could rise to the resistance zone between the 200-day MA ($19.7; green wave) and the 100-day MA ($18.6; purple wave).
The 200-day MA resistance presents a 15% price target for KuCoin token prices.
Also Read: KuCoin (KCS) jumps more than 56%, likely to paint a bullish pattern soon.However, bears might defend the zone aggressively, likely forcing KCS to fall back and consolidate above immediate resistance near its 50-day MA (yellow wave) at $17.7.
At the time of writing, KCS was trading $17.1, up 0.8% on the day.

… [Trackback]
[…] Information to that Topic: coinchapter.com/kucoin-eyes-further-selloff-despite-kcs-soaring-79-in-10-days/ […]
… [Trackback]
[…] Find More Info here on that Topic: coinchapter.com/kucoin-eyes-further-selloff-despite-kcs-soaring-79-in-10-days/ […]
… [Trackback]
[…] Read More Information here to that Topic: coinchapter.com/kucoin-eyes-further-selloff-despite-kcs-soaring-79-in-10-days/ […]