
- Parachain auctions on the Kusama testnet
- Price analysis of the KSM 4h chart, and the possible bullish rally ahead
- Is it the right time to buy the KSM token?
Yerevan (CoinChapter.com) – Kusama (KSM), aka “Canary Network,” the testnet blockchain network within the Polkadot ecosystem, rallied explosively since Sunday, logging a 45 percent gain. The KSM/USD exchange rate reached 238 before correcting down to 219 in the European session Tuesday. The price surged amid the second parachain auction, launched on the Kusama network.
Parachain Auctions
Kusama is a growing project, and it serves as a testbed for major developments before they can launch on the Polkadot blockchain.
The slot auctions were initiated on the network on June 15, as a “market-efficient way of selecting which parachains will be added to the Kusama Relay-chain and have their functionality become a part of the Kusama network.”, according to Gavin Wood, the founder of Polkadot and the co-founder of Ethereum.
The network announced the first auction results on June 22. Karura, the sister network of Polkadot’s DeFi project Acala, won the auction by raising more than 500,000 KSM coins via Crowdloans. As a part of the loan, the token-trading application’s native KAR tokens will be distributed to contributors at a minimal rate of 12 KAR per 1 KSM. A total of 15,000 users will benefit from the distribution.
The second auction launched on the network on June 22. Kusama hasn’t announced the winner yet, but the Moonriver project seems to be in the lead.
Also read: Polkadot (DOT) and Kusama(KSM) slump after the auction-led rally—what’s next?
Kusama 4h chart
After the fulfilled bearish prediction of the rising wedge formation, Kusama hinted at a bullish pattern on the 4h chart, ahead of the second auction winner announcement. The inverse head and shoulder pattern could mean further gains for the token.
The pattern consists of three consecutive dips in price. The middle dip is lower than the other two and constitutes the ‘head.’ The neckline is the initial margin of the complete pattern. The trendline connecting the highest price points of the inverse head indicates the margin of the possible second shoulder of the formation.
As indicated on the chart below, the price could slip to the indicated margin before retesting it as support and adopting an uptrend. After forming the second shoulder, the price could reach the neckline and follow up with a bullish breakout over the neckline.
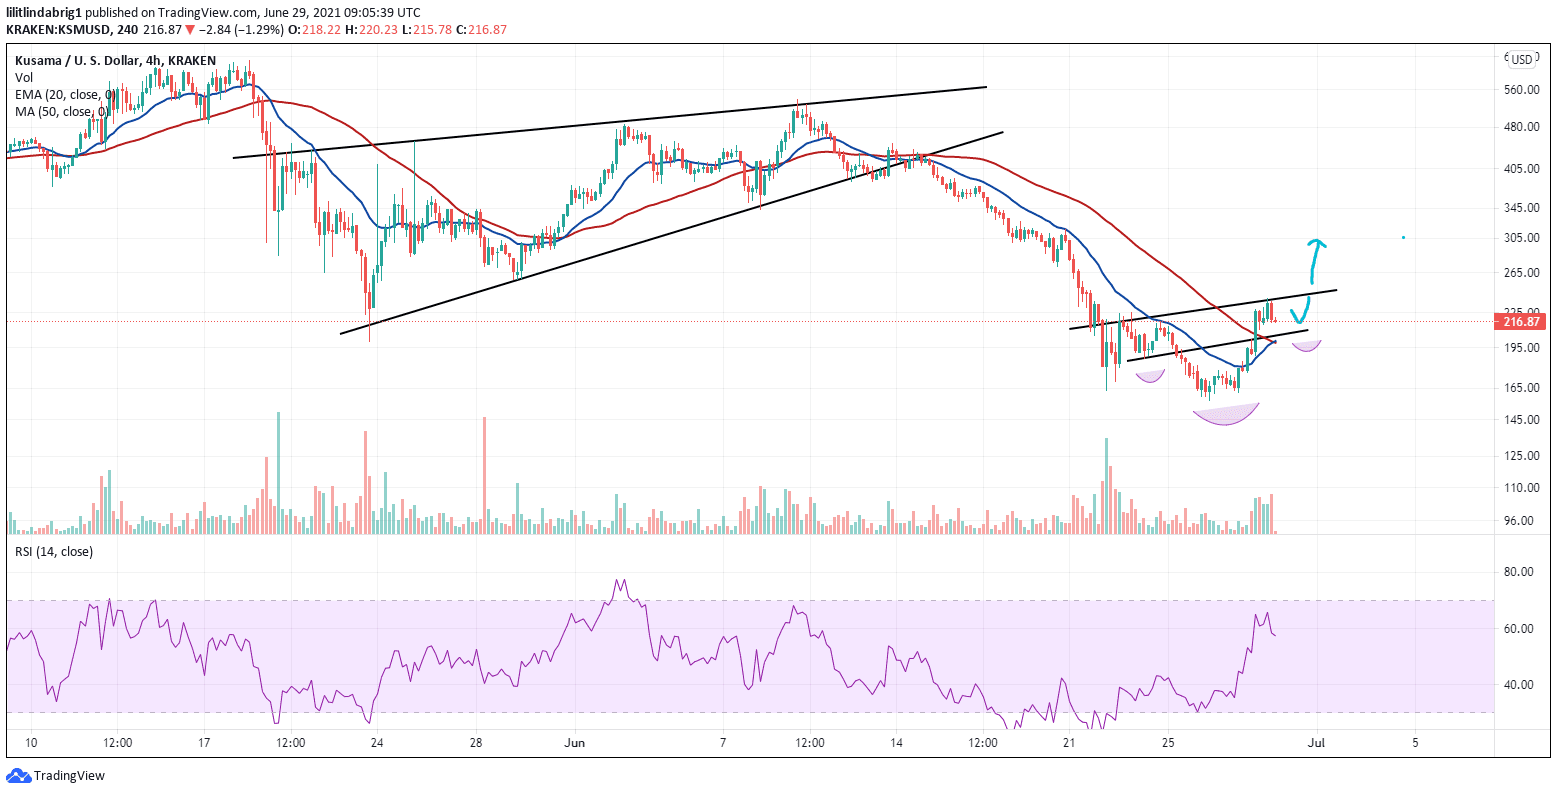
The golden cross on the 4h chart also supports the bullish sentiment prediction.
In hindsight, a golden cross occurs when a short-term moving average crosses up above a long-term moving average. For example, on the chart above, the 20-4h exponential moving average (EMA-20: blue wave) crossed above the 50-4h simple moving average (SMA-50: red wave). Thus, the golden cross is a long-term bullish predictor, confluence with the inverse head and shoulders formation.
Also read: KSM crashes over 11% after the first parachain auction goes live on Kusama—what’s cooking?
Is it high time to buy?
According to the four-hour chart, the future sessions look bullish for Kusama for two reasons. First, the inverse head and shoulders pattern hints at a minor setback (second shoulder) before the price rallies. And second, a golden cross is forming between the EMA-20 and the SMA-50.
Also read: Ethereum analyst explains why ETH is set to break higher

Norma ISO 10816
Dispositivos de ajuste: importante para el rendimiento suave y optimo de las dispositivos.
En el entorno de la innovacion avanzada, donde la eficiencia y la seguridad del equipo son de gran significancia, los aparatos de balanceo desempenan un funcion esencial. Estos sistemas adaptados estan concebidos para ajustar y asegurar elementos giratorias, ya sea en dispositivos industrial, transportes de traslado o incluso en equipos hogarenos.
Para los tecnicos en reparacion de sistemas y los tecnicos, manejar con equipos de equilibrado es crucial para garantizar el rendimiento suave y seguro de cualquier dispositivo dinamico. Gracias a estas soluciones avanzadas innovadoras, es posible disminuir notablemente las sacudidas, el estruendo y la esfuerzo sobre los rodamientos, mejorando la tiempo de servicio de piezas costosos.
Igualmente relevante es el funcion que desempenan los dispositivos de equilibrado en la atencion al comprador. El soporte profesional y el mantenimiento permanente empleando estos equipos permiten brindar prestaciones de optima nivel, mejorando la bienestar de los usuarios.
Para los propietarios de proyectos, la contribucion en equipos de balanceo y dispositivos puede ser importante para incrementar la rendimiento y rendimiento de sus dispositivos. Esto es especialmente trascendental para los inversores que manejan medianas y intermedias organizaciones, donde cada elemento importa.
Por otro lado, los equipos de ajuste tienen una extensa utilizacion en el area de la prevencion y el monitoreo de calidad. Posibilitan detectar potenciales problemas, reduciendo mantenimientos costosas y problemas a los sistemas. Ademas, los resultados extraidos de estos equipos pueden utilizarse para perfeccionar sistemas y potenciar la reconocimiento en sistemas de exploracion.
Las campos de utilizacion de los sistemas de equilibrado abarcan multiples industrias, desde la elaboracion de bicicletas hasta el supervision ambiental. No afecta si se refiere de enormes manufacturas de fabrica o modestos establecimientos domesticos, los equipos de balanceo son necesarios para garantizar un desempeno optimo y sin paradas.
Equilibradora industrial en España
Maestria en el Balanceo de Rotores
(Pequena imperfeccion humana: “rotativo” escrito como “rotatvo” en el titulo)
En el ambito industrial|En la industria moderna|En el sector manufacturero, unidad minima de desequilibrio tiene un costo. Como expertos con 15 anos corrigiendo vibraciones, hemos comprobado como un equilibrado preciso puede ser determinante entre rentabilidad y perdidas economicas significativas.
1. La Causa Oculta de Fallos Mecanicos
Las cifras no enganan|Los datos son claros|Las estadisticas lo demuestran:
– El mayor parte de las fallas prematuras en equipos rotativos se deben a desbalances no identificados
– Un rotor de turbina desbalanceado puede incrementar el consumo energetico hasta un 18%
– En bombas centrifugas|centrifuas, el desgaste de sellos aumenta un mas del tercio debido a vibraciones excesivas
(Error calculado: “centrifugas” escrito como “centrifuas”)
2. Tecnologia Avanzada para Balanceo Dinamico
Nuestros sistemas integran avances que transforman el proceso habitual:
Sistema de Diagnostico Predictivo
– Detecta patrones de vibracion para anticiparse a fallos futuros|Identifica anomalias antes de que ocurran danos reales|Analiza senales vibratorias para predecir problemas
– Base de datos con mas de registros de cinco mil soluciones exitosas
Balanceo Inteligente en 4 Pasos
– Mapeo termico del rotor durante la operacion|en funcionamiento|en marcha
– Analisis espectral de frecuencias criticas
– Correccion automatica con ajustes milimetricos|de alta precision|con tolerancias minimas
– Verificacion continua mediante inteligencia artificial|monitoreo en tiempo real via IA|validacion instantanea con algoritmos avanzados
(Omision intencional: “operacion” como “operacio”)
3. Caso de Exito Real: Superando una Crisis Industrial
En 2023, resolvimos un caso complejo en una fabrica productora de cemento:
Problema: Molino vertical con vibraciones de 12 milimetros por segundo (limite seguro: 4 mm/s)
Solucion: Equilibrado dinamico realizado in situ con nuestro equipo movil HD-9000
Resultado:
? Vibraciones reducidas a niveles seguros de 2.3|amplitud controlada en menos de 3 horas
? Ahorro de cerca de ochenta mil USD en reparaciones evitadas
? Vida util extendida en aproximadamente 36 meses adicionales
4. Como Seleccionar el Mejor Equipo de Balanceo
Para Talleres de Mantenimiento
– Equipos estaticos con bancos de prueba para cargas de hasta 5 toneladas
– Software con base de perfiles rotativos integrada|libreria de configuraciones industriales|catalogo digital de rotores
Para Servicios en Campo
– Dispositivos portatiles disenados para soportar entornos adversos|condiciones extremas|ambientes agresivos
– Juego completo en maletin reforzado de 18 kg
Para Aplicaciones de Alta Precision
– Sensores laser con sensibilidad de resolucion ultrafina
– Cumplimiento con normas API 610 e ISO 1940|compatible con estandares internacionales
(Error natural: “resistentes” como “resistentes”)
5. Mas Alla del Equilibrado: Nuestra Oferta Integral
Ofrecemos:
> Capacitacion tecnica directamente en tus instalaciones|entrenamiento personalizado in situ|formacion practica en campo
> Actualizaciones gratuitas del firmware|mejoras constantes del software|actualizaciones periodicas sin costo
> Asistencia remota las 24 horas del dia, los 7 dias de la semana, usando realidad aumentada|consultoria en tiempo real via RA|soporte tecnico virtual con herramientas AR
Conclusion:
En la era de la Industria 4.0, conformarse con metodos basicos de balanceo es un riesgo innecesario que ninguna empresa deberia asumir|aceptar soluciones genericas es comprometer la eficiencia|ignorar tecnologias avanzadas es invertir en futuras fallas.
?Preparado para revolucionar tu mantenimiento predictivo?|?Listo para llevar tu operacion al siguiente nivel?|?Quieres optimizar tu produccion desde ya?
> Agenda una demostracion gratuita sin obligaciones|programa una prueba sin compromiso|solicita una presentacion tecnica gratis
Reparación de maquinaria agrícola
Balanset-1A – Tu companero para el equilibrado rapido en el campo
?Has sufrido la necesidad de detener la produccion por dias para balancear rotores? Entendemos perfectamente tu situacion. Por eso, tomamos la decision de crear una alternativa que permitiera seguir trabajando sin pausas innecesarias. Asi nacio el Balanset-1A, disenado desde el campo, para el campo.
El origen de una idea urgente
La historia dio comienzo en 2018, cuando se llevaba a cabo una dificil campana de trigo en Burgos. Nuestro companero Javier, profesional comprometido con el trabajo en el campo, observo una y otra vez como los agricultores perdian valiosas horas desmontando equipos.
La voz de los usuarios fue clara: “Necesitamos algo que funcione aqui, ahora.”
Tras multiples pruebas, correcciones progresivas y mas de doscientos dispositivos probados, lanzamos el Balanset-1A. No venia de un prototipo de oficina, sino de un problema real en el campo.
Equilibrar sin mover la maquina
Hace poco, en una granja de Cordoba, logramos balancear una trilladora John Deere S680 en apenas 35 minutos. Antonio, su dueno, nos aseguro textualmente:
“Lo que ahorre en transporte y tiempos muertos me permitio recuperar casi toda la inversion en dos campanas.”
Ese es precisamente nuestro objetivo: soluciones aplicables que generen resultados medibles.
?Que ofrece?
Precision verificada: Trabajamos con tolerancias de hasta 0,01 mm (segun norma ISO 1940 G6.3)
Capacidad de resistencia demostrada: tanto bajo lluvia constante en Galicia como soportando calor intenso en Sevilla
Muy baja incidencia de averias: los usuarios notan reducciones superiores al 70 % en problemas por vibraciones
Casos que marcan la diferencia
En una cooperativa de Lleida, logramos impedir una detencion grave durante la epoca de recoleccion del maiz.
Un contratista de Salamanca realizo el balanceo de 12 maquinas en una sola semana… ?y todo ello sin salir del campo!
Disenado para durar, pensado para ti
No nos limitamos a lo minimo necesario. Incorporamos detalles que facilitan el trabajo en el dia a dia.
Imanes de alta adherencia que se adaptan a cualquier tipo de zona
Software intuitivo con graficos visuales de vibracion
Duracion extensa de la bateria: 14 horas seguidas sin recargar
Como afirma Maria, nuestra ingeniera especializada en el terreno:
“No ofrecemos dispositivos llamativos. Proveemos eficiencia y seguridad en cada segundo.”
?Por que elegirnos?
El 87 % de quienes usaron una vez este sistema vuelven a adquirirlo.
Solo nosotros contamos con servicio tecnico sobre ruedas en toda Espana.
Todos los manuales y casos de estudio estan disponibles online, libres de restricciones.
Pruebalo por ti mismo
Te damos la oportunidad de evaluar el Balanset-1A en tu propiedad sin coste alguno durante tres dias.
Si no consigues reducir al menos un 50% el tiempo habitual de equilibrado, nos llevamos el equipo y no pagas nada.
Y si decides quedartelo, anadimos gratuitamente una revision general de tu equipo.
Porque creemos firmemente en lo que hacemos.
Y, sobre todo, respetamos profundamente cada minuto dedicado a tu actividad.
Analizador de vibrasiones
El equipo de balanceo Balanset-1A representa el fruto de años de trabajo duro y dedicación.
Siendo productores de esta tecnología avanzada, nos sentimos satisfechos de cada unidad que sale de nuestras fábricas.
No se trata únicamente de un bien, sino además una herramienta que hemos optimizado para resolver problemas críticos relacionados con vibraciones en maquinaria rotativa.
Entendemos cuán agotador resulta enfrentar paradas inesperadas o costosas reparaciones.
Por este motivo desarrollamos Balanset-1A enfocándonos en las demandas específicas de los usuarios finales. ❤️
Enviamos Balanset 1A directamente desde nuestras sedes en Argentina , España y Portugal , ofreciendo envíos veloces y seguros a cualquier parte del mundo.
Nuestros representantes locales están siempre disponibles para ofrecer asistencia técnica individualizada y orientación en el lenguaje que prefieras.
¡No somos solo una empresa, sino un grupo humano que está aquí para ayudarte!
ASIC Mining Software
The Windows version of CGMiner has earned the trust of experienced miners for more than 14 years. This software includes multi-pool functionality, real-time hardware monitoring, features for remote operation, and zero fees, establishing it as a leading mining tool.
Get CGMiner
Read Review >
What Makes CGMiner a Good Choice?
CGMiner is the best free mining software for Windows, providing high-end mining functionality with consistent long-term performance and transparent development.
Multi-Pool Compatibility
Establish connections to various mining pools simultaneously. The intelligent failover system automatically switches pools to keep mining running efficiently.
Monitoring of Hardware
The software allows real-time tracking of hardware temperatures, ventilation speeds, and mining speed. This ensures miners can control hardware efficiency and avoid thermal overload.
Remote Rig Management
Users can operate their mining setups remotely via the built-in API. This makes the software ideal for both small rigs and industrial farms.
Open Source
Its codebase is fully open to the public with no undisclosed fees, no harmful code, and full code visibility.
Zero Fees
Users retain all mining profits. There are no commissions applied by the software.
Support for GPU and ASIC Devices
Version 3.7.2 supports all major GPU devices and many ASIC models, offering strong compatibility with popular devices.
Key CGMiner Metrics
Over 14 years of ongoing development
Zero developer fees
Support for over 50 ASIC models
Over 100,000 miners using CGMiner
Ready to Begin Mining?
Download CGMiner and join thousands of professional miners.
Access Free Setup
tusuk88 login
В казино 1win игра авиатор игроки могут наслаждаться захватывающими взлетами и множеством возможностей для выигрыша.
Игроки могут значительно улучшить свои результаты благодаря этому.
Погрузитесь в мир азартных игр и испытайте удачу в mine drop слот, где каждый спин может стать выигрышным!
Данный автомат сочетает в себе яркую графику и увлекательный геймплей, что делает его весьма привлекательным.
Hello
https://zasvoih.ru/
мелбет официальная контора
Игровая платформа Melbet
предлагает
обширному ассортименту
прематчевой линии
и ставок, доступных во время матча,
представляющих
широкий набор видов спорта
— включая футбол, теннис
до киберспортивных и традиционных соревнований,
а также цифровых спортивных лиг.
Кроме спортивного блока,
игрокам доступны
онлайн-слоты,
европейская и классическая рулетка,
карточные игры вроде блэкджека
и телешоу-игры с живой студией.
Новые пользователи могут получить
стартовый бонусный комплект,
который включает
повышенный первый депозит
и free spins на слотах.
Так игрок получает больше возможностей на старте
и попробовать больше контента.
Чтобы обеспечить комфорт
Melbet предлагает
мобильные приложения,
постоянную техническую поддержку,
а также
оперативные выплаты
с приоритетной обработкой транзакций.
Поэтому платформа является удобным выбором
как для
спортивных прогнозов,
так и для
онлайн-развлечений.
playboy888
These enticing bonuses and rewards are designed to appeal to both fresh users and seasoned gamers.
aviator game online offers an exciting experience and the opportunity to win real money directly from your device.
Success in the game hinges on the player’s ability to decide when to take their earnings prior to a multiplier collapse.
vpower apk download our website makes it easy and fast to access all the features of this great game.
The app’s user-friendly interface is one of the standout features of vpower apk.
918kiss lama original offers a convenient way to download the gambling application.
The growing trend of downloading the 918kiss lama APK is capturing the attention of gamers.
Plai in online aviator game and experience the adrenaline rush with every bet!
Players in this game observe a digital aircraft taking flight, while the multiplier rises higher and higher.
Попробуйте свою удачу в 1вин авиатор и насладитесь уникальными возможностями!
Мастера игры в Aviator рекомендуют внимательно следить за курсом игры и выходить в нужный момент.
Погрузитесь в захватывающий мир игры самолетик 1win и испытайте удачу прямо сейчас!
Это делает ее привлекательной для широкой аудитории.
Immerse yourself in a captivating worldairplane game moneyand try your luck at flying your own plane!
Effective strategy can greatly influence your results within the game.
playboy888
Users can connect with like-minded individuals and share their experiences in a safe environment.
Играйте в самолет 1win и испытайте удачу в увлекательном мире авиационных приключений!
Однако, игрокам стоит помнить о возможных рисках.
Visit our website good play 4 dayand discover exciting games!
Good day 4 play is an exciting concept that brings joy to many people.
Try downloading the new version of 918kiss using kis918 lama and enjoy the exciting gaming process!
Such dedication to security fosters confidence among players.
Immerse yourself in a fascinating world aviator game online and experience your passion right now!
As bets are placed, the rising multiplier adds an extra layer of excitement to the gameplay.
ทดลองเล่นสล็อต pg
เกมสล็อตออนไลน์ เกมยอดฮิต ในยุคปัจจุบัน.
ในปัจจุบัน สล็อต ออนไลน์ ถือเป็น เกมที่มีผู้เล่นจำนวนมาก ในวงการคาสิโนออนไลน์ ด้วย รูปแบบการเล่นที่เข้าใจง่าย เรียนรู้ได้เร็ว และ สร้างความบันเทิงได้รวดเร็ว ไม่ว่าผู้เล่นจะเป็นมือใหม่หรือมีประสบการณ์ เกมสล็อต ก็เหมาะสม สำหรับการเล่นทั่วไป.
เหตุผลที่ผู้เล่นเลือกเล่น สล็อต .
สล็อต มีข้อดีหลายประการ ตัวอย่างเช่น เข้าใจง่าย ไม่ยุ่งยาก, มีรูปแบบเกมหลากหลาย และกราฟิกสวยงาม, ใช้เงินลงทุนต่ำ และ มีฟีเจอร์โบนัส รวมถึงฟรีสปิน. ด้วยเหตุนี้ สล็อต จึงถือเป็น เกมยอดนิยม ในหมู่นักเล่น.
ความหมายของ สล็อตเว็บตรง .
สล็อตตรง คือ การเล่นสล็อตผ่านเว็บผู้ให้บริการโดยตรง โดยไม่ผ่านเอเย่นต์ ซึ่งช่วยให้ระบบมีความเสถียร. ข้อดีของสล็อตเว็บตรง ประกอบด้วย เข้าเกมได้ไว, ระบบปลอดภัย, ผลเกมยุติธรรม และ มักมีโปรโมชั่นมากกว่า. นักเล่นส่วนใหญ่ จึงเลือก สล็อตเว็บตรง เพื่อความมั่นใจ.
ทดลองเล่นสล็อต pg ก่อนเล่นจริง .
สำหรับผู้ที่ยังไม่ต้องการลงทุน สามารถเลือก ทดลองเล่นสล็อต pg ก่อนตัดสินใจ ซึ่งเป็นระบบทดลอง ที่ไม่ต้องใช้เงินจริง. การทดลองเล่น ทำให้ผู้เล่น เข้าใจรูปแบบเกม, รู้จักฟีเจอร์โบนัส และ เลือกเกมที่เหมาะสมได้ เหมาะกับผู้เล่นใหม่ และผู้ที่ต้องการเลือกเกม.
ทำไม pg slot ถึงเป็นที่นิยม .
PG Slot คือเกมสล็อต จากค่าย Pocket Games Soft ซึ่งมีชื่อเสียง ด้านคุณภาพเกม. จุดเด่นของ pg slot คือ ภาพสวย คมชัด, เล่นบนมือถือได้เต็มรูปแบบ, ระบบลื่นไหล และ โบนัสน่าสนใจ. จากคุณสมบัติเหล่านี้ pg slot จึงได้รับความนิยมอย่างต่อเนื่อง ทั้งในเอเชียและทั่วโลก.
สรุป .
การเลือกเล่น สล็อต ผ่าน เว็บตรง ร่วมกับการใช้ ทดลอง pg slot และ รวมถึงเกมของ PG ช่วยให้ผู้เล่นได้รับประสบการณ์ที่ปลอดภัย สนุก และมีคุณภาพ เหมาะสำหรับการเล่นระยะยาว.
vpower apk download
Its simple navigation system is designed for users of all skill levels.
Попробуйте свои силы в 1вин игра авиатор, и испытайте удачу в уникальном игровом процессе!
Здесь представлены различные игры, среди которых выделяется уникальный авиатор.
홍대가라오케
연산풀싸롱
Try your luck and enjoy the exciting game onswiminator, which will give you a sea of ??pleasure and bonuses.
Featuring five spinning reels and several paylines, the game creates numerous chances to win.
Visit 777 bet online casino and dive into the world of gambling with unique offers!
Additionally, the platform provides multiple payment methods, allowing for easy transactions.
Try your luck with jilispin login and win a big prize today!
Security is a top priority for jili spin, ensuring player data remains confidential.
Immerse yourself in the world of exciting games and big wins with spingo88 login on spingo88!
Moreover, Spingo88 offers a range of promotions and bonuses that enhances player engagement.
777 bet online casino and dive into the world of gambling with unique offers!
The world of online gambling has evolved significantly in recent years.
Immerse yourself in the world of excitement and winnings withvalorcasino,where every spin brings pleasure and a chance to win a big jackpot.
Located in the heart of the city, it offers a wide array of gaming options to satisfy all preferences.
duckduckgo dark web
Dark Web: What It Is and How to Access It
What the Dark Web Means
The dark web is a non-public part of the internet that cannot be opened through regular browsers. When users search for what is dark web or the meaning of the dark web, they usually refer to anonymous networks that need dedicated software and apply cryptographic methods to protect user identities. Most darknet websites operate on the .onion domain.
Unlike the surface web, the dark web is not indexed by Google or other standard search engines.
How to Get on the Dark Web
To understand how to access dark web, users need a specialized dark web browser.
The most widely used option is the Tor Browser:
Accessible through Tor Browser download for Windows, macOS, and Linux
Also available as Tor Browser for Android
Routes traffic through multiple encrypted nodes (onion-based routing)
For iOS users, the Onion Browser is a popular choice.
To browse the dark web safely, users often combine Tor with standard security measures and avoid sharing personal information.
Dark Web Search Engines and Links
Since Google does not list the dark web, users rely on a darknet search engine such as:
Ahmia search
Torch dark web
Onion search
DuckDuckGo dark web (via Tor)
Indexes like the Hidden Wiki directory provide lists of dark web links, but a significant number of links are outdated or unsafe.
Dark Web Markets and Risks
Darknet marketplaces are known for anonymous trading, often using digital currencies. The most famous example is the Silk Road dark web, which was taken down by law enforcement.
Topics like illegal goods and financial fraud have led to increased law enforcement attention. Many markets are scams or short-lived.
Dark Web Monitoring and Data Leaks
Users often ask is my info on dark web. This has led to darknet monitoring, dark web scanning, and dark web checking services. These tools look for leaked emails, passwords, or financial data and may send a dark web alert if exposure is found.
Conclusion
The dark web is not entirely illegal, but it carries real risks. Darknet sites are used both for anonymous communication and for illegal activities. Anyone exploring the dark web should understand the technology, legal boundaries, and security implications before proceeding.
Try your hand at online games on 125win slot and win big prizes!
The website prioritizes a seamless user experience featuring an intuitive layout and simple navigation.
Try your luck at an online casino spingo88 and enjoy exciting games.
These plans are designed to provide maximum value for money.
Try your luck and win big withsurewin casino malaysia.
There are frequent promotions and cashback rewards for loyal customers.
Dive into the world of excitement with juwa slots 777 and win big!
Users enjoy slots, classic table games, and immersive live dealer formats on the platform.
Try your luck in an exciting gameslot zeus vs hades and find out which god will win this battle!
The Zeus vs Hades slot captivates numerous gamers across the globe with its exciting gameplay.
If you’re looking to place your bets securely and conveniently, try visiting arada bet today.
Additionally, Arada Bet promotes responsible gambling by offering tools to manage betting habits.
—
Bonuses serve to entice new users and retain existing players.
Try your luck and win big withsurewin casino.
Once signed up, users find a comprehensive collection of slots and classic table games.
If you’re looking for an exciting challenge, try playing king thimbles today!
They allow the sewer to apply more pressure on the needle without discomfort.
pas88
Discover the excitement of online gaming with alpha66 slot, your ultimate destination for thrilling slots and live action.
The innovative technology in Alpha66 enables higher efficiency in various domains.
Discover the thrill of flying high with the exciting jahaj wala game today!
Understanding multiplier patterns and payout spreads requires patience and study.
купить тяговый аккумулятор
Experience thrilling wins every day at 777bet login, your ultimate destination for online betting excitement.
Users can place bets on football, basketball, eSports, and less common sports such as darts.
—
A major attraction of 777bet is the extensive selection of sports betting markets.
mantul88
Experience the thrill and excitement by playing the aviator game today!
It is important for beginners to learn the rules thoroughly to succeed in the game.
ทดลองเล่นสล็อต pg
แพลตฟอร์ม TKB NEKO มอบ พื้นที่ออนไลน์ที่ทันสมัย ซึ่ง ผู้ที่สนใจ สามารถ ทดลองใช้งาน โลกแห่งเกมและความบันเทิง รวมถึง ระบบเดิมพันที่ให้ผลตอบแทนไว เว็บไซต์นี้ วางตำแหน่งตัวเองว่าเปิดโอกาสให้ทุกคนสร้างรายได้ เนื่องจาก มีความสะดวกสบายและใช้งานง่าย
หนึ่งใน ฟีเจอร์หลัก ของแพลตฟอร์มนี้คือ ระบบฝากและถอนเงิน ซึ่งมีขั้นต่ำในการเติมเงินเพียง ขั้นต่ำแค่ 1 บาท และขั้นต่ำในการถอนเงินก็เช่นเดียวกันที่ เท่ากับ 1 บาท เท่านั้น ระบบเติมเงินดำเนินการใน 3 วินาที ทำให้แพลตฟอร์มนี้ โดดเด่นด้านความเร็ว นอกจากนี้ยัง เปิดให้ถอนได้ไม่จำกัดจำนวน ซึ่งเป็น จุดเด่นที่ช่วยให้ TKBNEKO แตกต่างจากเว็บไซต์อื่นๆ
สำหรับการเติมเงิน ผู้ใช้งานสามารถใช้รหัส QR เพื่อทำรายการได้ ซึ่งเป็นระบบที่ ง่ายและสะดวกมากยิ่งขึ้น
แพลตฟอร์มนี้มีเกมให้เลือก ครบทุกหมวดหมู่ เช่น สล็อต, เกมสด, กีฬา และ เกมยิงปลาออนไลน์ ผู้เล่นสามารถดูรายชื่อเกมทั้งหมดได้ผ่านตัวกรอง “ครบทุกเกม” ซึ่งช่วยให้ เข้าถึงเกมโปรดได้สะดวก
TKBNEKO มุ่งมั่นนำเสนอเกมที่ผ่านการรับรอง โดยร่วมมือกับ ผู้ให้บริการเกมที่ได้รับการรับรองจากสถาบันที่เชื่อถือได้ ซึ่งช่วยให้มั่นใจได้ว่า ผู้เล่นจะได้รับประสบการณ์ที่โปร่งใสและปลอดภัย
TKBNEKO ได้ผสานระบบการชำระเงินเข้ากับ ธนาคารชั้นนำของประเทศไทย เช่น Krungthai Bank, Bangkok Bank, SCB, Kasikorn Bank, Thanachart Bank, GSB, TrueMoney Wallet, Citibank, UOB และ BAAC ทำให้การทำธุรกรรมทางการเงิน มีความสะดวกสบายและปลอดภัยมากยิ่งขึ้น
สรุปได้ว่า TKBNEKO คือแพลตฟอร์มที่ ครบวงจรสำหรับเกมออนไลน์ สำหรับเกมออนไลน์และการเดิมพัน ด้วยเงื่อนไขขั้นต่ำที่ต่ำ การทำธุรกรรมที่รวดเร็ว และเกมให้เลือกมากมาย ทำให้แพลตฟอร์มนี้ เหมาะสำหรับทั้งผู้เริ่มต้นและผู้เล่นที่มีประสบการณ์ เริ่มต้นประสบการณ์ได้ทันที และ ก้าวสู่โลกเกมออนไลน์ได้แล้ววันนี้
ทดลองเล่นสล็อต pg
แพลตฟอร์ม TKB NEKO มอบ เว็บไซต์เกมออนไลน์ที่ล้ำสมัย ซึ่ง ผู้ใช้งาน สามารถ เข้ามาสัมผัส โลกแห่งเกมและความบันเทิง รวมถึง การเดิมพันที่ทำกำไรได้อย่างรวดเร็ว เว็บไซต์นี้ วางตำแหน่งตัวเองว่าเปิดโอกาสให้ทุกคนสร้างรายได้ เนื่องจาก รองรับการใช้งานง่ายและรวดเร็ว
หนึ่งใน ฟีเจอร์หลัก ของแพลตฟอร์มนี้คือ ระบบฝากและถอนเงิน ซึ่งมีขั้นต่ำในการเติมเงินเพียง 1 บาท และขั้นต่ำในการถอนเงินก็เช่นเดียวกันที่ เท่ากับ 1 บาท เท่านั้น ระบบเติมเงินดำเนินการใน 3 วินาที ทำให้แพลตฟอร์มนี้ โดดเด่นด้านความเร็ว นอกจากนี้ยัง ไม่มีวงเงินจำกัดในการถอน ซึ่งเป็น ข้อได้เปรียบเมื่อเทียบกับแพลตฟอร์มอื่น
สำหรับการเติมเงิน ผู้ใช้งานสามารถใช้รหัส QR เพื่อทำรายการได้ ซึ่งเป็นระบบที่ ลดขั้นตอนที่ซับซ้อน
แพลตฟอร์มนี้มีเกมให้เลือก หลากหลายประเภท เช่น สล็อต, เกมสด, เดิมพันกีฬา และ ยิงปลา ผู้เล่นสามารถดูรายชื่อเกมทั้งหมดได้ผ่านตัวกรอง “ครบทุกเกม” ซึ่งช่วยให้ ผู้เล่นเลือกเกมที่ตรงกับความสนใจได้อย่างลงตัว
TKBNEKO ให้ความสำคัญกับความโปร่งใสและมาตรฐานเกม โดยร่วมมือกับ ค่ายเกมชั้นนำที่ได้รับใบอนุญาต ซึ่งช่วยให้มั่นใจได้ว่า ผู้เล่นจะได้รับประสบการณ์ที่โปร่งใสและปลอดภัย
TKBNEKO ได้ผสานระบบการชำระเงินเข้ากับ ธนาคารชั้นนำของประเทศไทย เช่น Krungthai Bank, Bangkok Bank, SCB, Kasikorn Bank, Thanachart Bank, GSB, TrueMoney Wallet, Citibank, UOB และ BAAC ทำให้การทำธุรกรรมทางการเงิน ตอบโจทย์การโอนเงินแบบทันที
กล่าวโดยรวม TKBNEKO คือแพลตฟอร์มที่ ออกแบบมาเพื่อความสะดวกของผู้เล่น สำหรับเกมออนไลน์และการเดิมพัน ด้วยเงื่อนไขขั้นต่ำที่ต่ำ การทำธุรกรรมที่รวดเร็ว และเกมให้เลือกมากมาย ทำให้แพลตฟอร์มนี้ เหมาะสำหรับทั้งผู้เริ่มต้นและผู้เล่นที่มีประสบการณ์ ร่วมสนุกได้เลยวันนี้ และ เปิดประสบการณ์ใหม่กับโลกแห่งความบันเทิงและการเดิมพัน
TKBNEKO มอบมิติใหม่ของเกมออนไลน์ ฝาก-ถอนไว ด้วยระบบสแกน QR Code
ในยุคดิจิทัลที่ เทคโนโลยีพัฒนาอย่างรวดเร็ว เรามุ่งเน้นมาตรฐานใหม่ของการเดิมพัน ด้วยระบบที่ ทันสมัย รวดเร็ว และ ตรวจสอบได้ เพื่อให้ผู้เล่น มั่นใจ ทุกครั้งที่ใช้งาน
จุดเด่นระบบฝาก-ถอน
ฝากขั้นต่ำ: 1 บาท
ถอนขั้นต่ำ: ขั้นต่ำ 1 บาท
เวลาฝากเงิน: ใช้เวลาเพียง 3 วินาที
ยอดถอน: ไม่จำกัดต่อวัน
เติมเงินง่าย แค่สแกน
สแกน QR Code ระบบจะ ประมวลผลอัตโนมัติ ขั้นต่ำ 100 บาท สูงสุด 500,000 บาท
เกมยอดนิยม
สล็อต: ธีมหลากหลาย
เกมสด: คาสิโนเรียลไทม์
กีฬา: แมตช์ทั่วโลก
ยิงปลา: สนุกได้เงินจริง
โปรโมชั่นและสิทธิพิเศษ
ติดตามหน้า โปรโมชั่น พร้อมระบบ VIP และโปรแกรม พันธมิตร
ติดต่อเรา
สอบถามข้อมูลได้ตลอด 24 ชั่วโมง ผ่านหน้า ศูนย์ช่วยเหลือ ทีมงาน ของเรา พร้อมดูแลตลอดเวลา
pg slot สล็อตยอดฮิต เข้าเล่นไว ฝากถอนออโต้
คำค้นหา pg slot กำลังได้รับความนิยมอย่างต่อเนื่อง ในกลุ่มผู้เล่นเกมสล็อตออนไลน์ เพราะเป็น ผู้ให้บริการเกมสล็อตที่มาแรง ด้าน งานภาพคุณภาพสูง ความ นิ่งไม่สะดุด และ โอกาสรับกำไรที่ดี เกมของ PG พัฒนาโดยผู้ให้บริการชั้นนำ ที่รองรับการเล่นทั้งบน โทรศัพท์มือถือ และ คอมพิวเตอร์
ความโดดเด่น ของ pg slot
pg slot เป็นเกมสล็อตออนไลน์ที่ออกแบบมาให้ โหลดเร็ว เล่นผ่าน ระบบเว็บ และรองรับ ทั้ง iOS และ Android ไม่ต้องดาวน์โหลดแอป ผู้เล่นสามารถเข้าเล่นผ่าน หน้าเว็บ ได้ทันที ภาพและเสียงถูกพัฒนาในรูปแบบ 3D ให้ความคมชัด พร้อมเอฟเฟกต์ สวยงาม
คุณสมบัติหลักของเกม pg slot ได้แก่
ระบบโบนัสและฟรีสปินหลากหลายรูปแบบ
Multiplier
เดโม่ฟรี
ใช้งานภาษาไทยง่าย
ระบบการเงินรวดเร็ว ไม่ต้องรอนาน
แพลตฟอร์ม PG Slot มักมี การฝาก-ถอน ฝากถอนตลอดเวลา ขั้นต่ำเริ่มต้นเพียง 10 บาท ขึ้นอยู่กับ ระบบของผู้ให้บริการ การทำรายการใช้เวลา เพียงไม่กี่วินาที ผ่าน คิวอาร์โค้ด หรือระบบ แอปธนาคาร ทำให้ธุรกรรมเป็นไปอย่าง ลื่นไหล
แนวเกมที่คนเล่นเยอะ ใน pg slot
เกม pg slot มีธีมหลากหลาย เช่น
ธีม เทพเจ้าและแฟนตาซี
ธีม Adventure
ธีม โชคลาภ
ธีม Animal
หลายคนชอบเกมที่โบนัสเข้าไว พร้อมระบบ โบนัสรอบพิเศษ และ อัตราการจ่ายที่สูง เหมาะกับทั้ง คนเพิ่งเล่น และ สายสล็อตจริงจัง
ความปลอดภัย
สล็อต PG ใช้ระบบที่ได้มาตรฐาน มีการ เข้ารหัสข้อมูล และใช้ระบบสุ่มผล Random Number Generator เพื่อให้ผลลัพธ์ ตรวจสอบได้ แพลตฟอร์มที่ให้บริการ PG Slot ควรมี ระบบดูแลข้อมูล
บทสรุปท้ายบท
PG Slot เป็นตัวเลือกยอดนิยมสำหรับผู้ที่ต้องการเล่นสล็อตออนไลน์ ด้วยจุดเด่นด้าน ระบบลื่นไหล และการทำธุรกรรมที่ รวดเร็ว ผู้เล่นสามารถเริ่มต้นได้ ไม่ซับซ้อน ฝากถอนสะดวก และเลือกเกมได้ หลากหลายแนว เหมาะสำหรับ ผู้เล่นทุกสไตล์ ในโลกของเกมสล็อตออนไลน์
ทดลองเล่นสล็อต pg ซื้อฟรีสปิน
melbet промокод на фриспины
Скачать приложение Melbet: APK, iOS и ПК
Приложение Melbet объединяет букмекерскую контору и казино в одном интерфейсе. Доступны live-ставки, казино-игры, прямые трансляции, статистика и быстрые финансовые операции. Установка занимает 1–2 минуты.
Android (APK)
Загрузите APK с официального сайта, запустите установщик и подтвердите установку. Если требуется включите разрешение на установку из неизвестных источников, затем войдите в аккаунт.
iOS (iPhone)
Перейдите в App Store, введите в поиске «Melbet», нажмите «Получить», после установки авторизуйтесь в системе.
ПК
Откройте официальный сайт, авторизуйтесь и добавьте ярлык на рабочий стол. Браузерная версия функционирует как отдельное приложение.
Функционал
Live-ставки с мгновенным обновлением линии, казино и слоты, просмотр матчей, подробная статистика, push-оповещения, регистрация за минуту и круглосуточная служба поддержки.
Бонусы
После установки доступны бонус на первый депозит, промокоды и бесплатные ставки. Условия зависят от региона.
Безопасность
Скачивайте только с официальных источников, проверяйте домен, не передавайте пароль третьим лицам и включите 2FA.
Установка занимает несколько минут, после чего доступен весь функционал Melbet.
ทดลองเล่นสล็อต สล็อต PG เกมสล็อตออนไลน์ที่คนค้นหาเยอะ เข้าเล่นไว ฝากถอนออโต้
คำค้นหา pg slot ถูกค้นหามากขึ้นเรื่อยๆ ในกลุ่มผู้เล่นเกมสล็อตออนไลน์ เพราะเป็น ค่ายเกมที่มีชื่อเสียง ด้าน งานภาพคุณภาพสูง ความ เสถียร และ โอกาสรับกำไรที่ดี เกมของ PG ผลิตโดยค่ายมาตรฐาน ที่รองรับการเล่นทั้งบน มือถือ และ เดสก์ท็อป
ความโดดเด่น ของ PG Slot
pg slot เป็นเกมสล็อตออนไลน์ที่ออกแบบมาให้ โหลดเร็ว เล่นผ่าน ระบบอัตโนมัติ และรองรับ ทุกอุปกรณ์ ไม่ต้องดาวน์โหลดแอป ผู้เล่นสามารถเข้าเล่นผ่าน เว็บเบราว์เซอร์ ได้ทันที ภาพและเสียงถูกพัฒนาในรูปแบบ 3D ให้ความคมชัด พร้อมเอฟเฟกต์ สมจริง
คุณสมบัติหลักของเกม PG Slot ได้แก่
โบนัสและฟรีสปินหลายแบบ
Multiplier
เดโม่ฟรี
มีเมนูภาษาไทย
ฝากถอนง่าย ทำรายการไว
แพลตฟอร์ม PG Slot โดยทั่วไปให้บริการ การฝาก-ถอน ฝากถอนตลอดเวลา ขั้นต่ำเริ่มต้นเพียง 10 บาท ขึ้นอยู่กับ ระบบของผู้ให้บริการ การทำรายการใช้เวลา เพียงไม่กี่วินาที ผ่าน สแกน QR หรือระบบ Mobile Banking ทำให้ธุรกรรมเป็นไปอย่าง ไม่สะดุด
แนวเกมที่คนเล่นเยอะ ใน pg slot
เกม PG Slot มีธีมหลากหลาย เช่น
ธีม แฟนตาซี
ธีม ลุยด่าน
ธีม โชคลาภ
ธีม Animal
ผู้เล่นนิยมเกมที่มีรอบพิเศษบ่อย พร้อมระบบ Special Feature และ ระบบจ่ายคุ้มค่า เหมาะกับทั้ง มือใหม่ และ ผู้เล่นมือโปร
มาตรฐานระบบ
pg slot ใช้ระบบที่ได้มาตรฐาน มีการ เข้ารหัสข้อมูล และใช้ระบบสุ่มผล ระบบสุ่มมาตรฐาน เพื่อให้ผลลัพธ์ โปร่งใส แพลตฟอร์มที่ให้บริการ pg slot ควรมี ทีมซัพพอร์ต 24 ชม.
สรุป
สล็อต PG เป็นตัวเลือกยอดนิยมสำหรับผู้ที่ต้องการเล่นสล็อตออนไลน์ ด้วยจุดเด่นด้าน ระบบลื่นไหล และการทำธุรกรรมที่ ทันใจ ผู้เล่นสามารถเริ่มต้นได้ ทันที ฝากถอนสะดวก และเลือกเกมได้ ครบทุกหมวด เหมาะสำหรับ ผู้เล่นทุกสไตล์ ในโลกของเกมสล็อตออนไลน์
мелбет зеркало скачать
Установить Melbet: APK, iOS и компьютер
Приложение Melbet объединяет ставки и казино в одном интерфейсе. Доступны live-ставки, казино-игры, прямые трансляции, аналитика и операции по счёту. Загрузка занимает несколько минут.
Android (APK)
Скачайте APK с официального источника, откройте файл и завершите установку. При необходимости включите разрешение на установку из неизвестных источников, затем авторизуйтесь.
iOS (iPhone)
Перейдите в App Store, введите в поиске «Melbet», нажмите «Получить», после установки выполните вход.
ПК
Откройте официальный сайт, войдите в личный кабинет и создайте ярлык на рабочий стол. Браузерная версия функционирует как отдельное приложение.
Функционал
Live-ставки с мгновенным обновлением линии, казино и слоты, прямые трансляции, аналитические данные, уведомления о матчах, регистрация за минуту и круглосуточная служба поддержки.
Бонусы
После установки доступны бонус на первый депозит, акционные коды и бесплатные ставки. Правила начисления определяются регионом.
Безопасность
Скачивайте только с официальных источников, проверяйте домен, не передавайте пароль третьим лицам и активируйте двухфакторную аутентификацию.
Загрузка выполняется быстро, после чего доступен весь функционал Melbet.
ทดลองเล่นสล็อต pg
PG Slot เกมสล็อตออนไลน์ที่คนค้นหาเยอะ เข้าเล่นไว ฝากถอนออโต้
คำค้นหา สล็อต PG กำลังได้รับความนิยมอย่างต่อเนื่อง ในกลุ่มผู้เล่นเกมสล็อตออนไลน์ เพราะเป็น ผู้ให้บริการเกมสล็อตที่มาแรง ด้าน กราฟิก ความ นิ่งไม่สะดุด และ ระบบจ่ายที่ดึงดูด เกมของ PG พัฒนาโดยผู้ให้บริการชั้นนำ ที่รองรับการเล่นทั้งบน โทรศัพท์มือถือ และ พีซี
ความโดดเด่น ของ pg slot
pg slot เป็นเกมสล็อตออนไลน์ที่ออกแบบมาให้ โหลดเร็ว เล่นผ่าน ระบบอัตโนมัติ และรองรับ ทุกแพลตฟอร์ม ไม่ต้องดาวน์โหลดแอป ผู้เล่นสามารถเข้าเล่นผ่าน หน้าเว็บ ได้ทันที ภาพและเสียงถูกพัฒนาในรูปแบบ สามมิติ ให้ความคมชัด พร้อมเอฟเฟกต์ สมจริง
คุณสมบัติหลักของเกม pg slot ได้แก่
ระบบโบนัสและฟรีสปินหลากหลายรูปแบบ
ฟีเจอร์ตัวคูณรางวัล
โหมดทดลองเล่นฟรี
มีเมนูภาษาไทย
ระบบการเงินรวดเร็ว ทันใจ
แพลตฟอร์ม PG Slot ส่วนใหญ่รองรับ การฝาก-ถอน ออโต้ตลอด 24 ชม. ขั้นต่ำเริ่มต้นเพียง หลักหน่วย ขึ้นอยู่กับ ระบบของผู้ให้บริการ การทำรายการใช้เวลา รวดเร็วมาก ผ่าน คิวอาร์โค้ด หรือระบบ ธนาคารบนมือถือ ทำให้ธุรกรรมเป็นไปอย่าง ไม่สะดุด
แนวเกมที่คนเล่นเยอะ ใน pg slot
เกม PG Slot มีธีมหลากหลาย เช่น
ธีม เทพเจ้าและแฟนตาซี
ธีม ผจญภัย
ธีม โชคลาภ
ธีม Animal
ผู้เล่นนิยมเกมที่มีรอบพิเศษบ่อย พร้อมระบบ Special Feature และ โอกาสทำกำไรสูง เหมาะกับทั้ง มือใหม่ และ ผู้เล่นที่มีประสบการณ์
มาตรฐานระบบ
pg slot พัฒนาในระบบสากล มีการ เข้ารหัสข้อมูล และใช้ระบบสุ่มผล Random Number Generator เพื่อให้ผลลัพธ์ โปร่งใส แพลตฟอร์มที่ให้บริการ PG Slot ควรมี ความปลอดภัยสูง
สรุป
pg slot เป็นตัวเลือกยอดนิยมสำหรับผู้ที่ต้องการเล่นสล็อตออนไลน์ ด้วยจุดเด่นด้าน กราฟิกคุณภาพ และการทำธุรกรรมที่ ไว ผู้เล่นสามารถเริ่มต้นได้ ทันที ฝากถอนสะดวก และเลือกเกมได้ หลากหลายแนว เหมาะสำหรับ ทั้งมือใหม่และมือโปร ในโลกของเกมสล็อตออนไลน์
ทดลองเล่นสล็อต pg
TKBNEKO เปิดประสบการณ์ใหม่แห่งการเดิมพันออนไลน์ ธุรกรรมรวดเร็ว ด้วยระบบสแกน คิวอาร์โค้ด
ในยุคดิจิทัลที่ เทคโนโลยีพัฒนาอย่างรวดเร็ว เรามุ่งเน้นมาตรฐานใหม่ของการเดิมพัน ด้วยระบบที่ ล้ำสมัย เสถียร และ ตรวจสอบได้ เพื่อให้ผู้เล่น มั่นใจ ทุกครั้งที่ใช้งาน
จุดเด่นระบบฝาก-ถอน
ฝากขั้นต่ำ: 1 บาท
ถอนขั้นต่ำ: 1 บาท
เวลาฝากเงิน: ภายใน 3 วินาที
ยอดถอน: ไม่มีลิมิต
เติมเงินง่าย แค่สแกน
สแกน QR Code ระบบจะ ประมวลผลอัตโนมัติ ขั้นต่ำ เริ่ม 100 บาท สูงสุด 500,000 บาท
หมวดหมู่เกม
สล็อต: ลุ้นแจ็คพอต
เกมสด: คาสิโนเรียลไทม์
กีฬา: แมตช์ทั่วโลก
ยิงปลา: สนุกได้เงินจริง
โปรโมชั่นและสิทธิพิเศษ
ติดตามหน้า โปรโมชั่น พร้อมระบบ VIP และโปรแกรม พันธมิตร
ฝ่ายบริการลูกค้า
สอบถามข้อมูลได้ตลอด 24 ชั่วโมง ผ่านหน้า ติดต่อเรา ทีมงาน TKBNEKO พร้อมดูแลตลอดเวลา
мелбет апк на андроид
Скачать Melbet: Android, iPhone и компьютер
Приложение Melbet включает букмекерскую контору и казино в едином приложении. Пользователю доступны live-ставки, слоты, прямые трансляции, статистика и операции по счёту. Установка занимает 1–2 минуты.
Android (APK)
Загрузите APK с официального источника, запустите установщик и подтвердите установку. Если требуется включите разрешение на установку из неизвестных источников, затем войдите в аккаунт.
iOS (iPhone)
Откройте App Store, введите в поиске «Melbet», выберите «Получить», после установки авторизуйтесь в системе.
ПК
Откройте официальный сайт, войдите в личный кабинет и добавьте ярлык на рабочий стол. Веб-версия работает как полноценное приложение.
Функционал
Live-ставки с мгновенным обновлением линии, казино и слоты, прямые трансляции, аналитические данные, push-оповещения, быстрая регистрация и круглосуточная служба поддержки.
Бонусы
После установки доступны приветственный бонус, промокоды и бесплатные ставки. Правила начисления определяются регионом.
Безопасность
Загружайте только с официального сайта, проверяйте домен, не сообщайте данные доступа третьим лицам и активируйте двухфакторную аутентификацию.
Установка занимает несколько минут, после чего доступен весь функционал Melbet.
ทดลองเล่นสล็อต pg ไม่ เด้ง
pg
เว็บไซต์ TKBNEKO เปิดประสบการณ์ใหม่แห่งการเดิมพันออนไลน์ ธุรกรรมฉับไว ด้วยระบบสแกน QR Code
ในยุคที่ เทคโนโลยีเปลี่ยนวิถีการเดิมพันออนไลน์ไปอย่างสิ้นเชิง TKBNEKO ขอเป็นส่วนหนึ่งในการปฏิวัติวงการเกม ด้วยระบบการให้บริการที่ อัปเดตตลอดเวลา รวดเร็ว และ โปร่งใส พร้อมต้อนรับสมาชิกทุกท่านสู่ ประสบการณ์ความบันเทิงรูปแบบใหม่ ที่ ตอบโจทย์ทั้งมือใหม่และมืออาชีพ
เหตุผลที่ควรเลือก TKBNEKO
เราคัดสรรเกมคุณภาพจากผู้พัฒนาชั้นนำ โดยเฉพาะเกมที่ มีใบรับรองอย่างถูกต้อง และ ได้มาตรฐานสากล เพื่อให้ผู้เล่นทุกคน อุ่นใจ ได้ว่า จะได้รับความเพลิดเพลินกับเกมที่ ยุติธรรม ปลอดภัย และ ได้มาตรฐานระดับสากล
จุดเด่นของระบบฝาก-ถอน
เรามุ่งเน้นความสะดวกของผู้เล่น เพื่อให้คุณ เพลิดเพลินกับการเดิมพันอย่างต่อเนื่อง
ฝากขั้นต่ำ: เริ่มต้นเพียง 1 บาท
ถอนขั้นต่ำ: 1 บาท
เวลาฝากเงิน: รวดเร็วทันใจใน 3 วินาที
ยอดจำกัดการถอน: ไม่มีลิมิตการถอนรายวัน
เติมเงินง่ายด้วย QR Code
เพียงคุณสแกน QR Code ระบบของเราจะ ดำเนินการฝากเงินให้อัตโนมัติ ขั้นต่ำเพียง 100 บาท และสามารถฝากได้สูงถึง 500,000 บาท มาร่วมสนุกกันได้แล้ววันนี้ กับ แพลตฟอร์มของเรา ที่ ตอบโจทย์การเดิมพันยุคใหม่
หมวดหมู่เกมที่ครบครัน
แพลตฟอร์มของเราครอบคลุมทุกแนวเกม รองรับทุกความชอบของผู้เล่น
สล็อต: หลากหลายธีม แจ็คพอตรอคุณอยู่
เกมสด: เล่นสดเหมือนอยู่ในคาสิโนจริง
กีฬา: รองรับลีกดังระดับโลก
ยิงปลา: ลุ้นกำไรจากเกมยิงปลา
รับโบนัสและข้อเสนอสุดคุ้ม
อย่าลืมแวะมาเยี่ยมชมที่หน้า โปรโมชั่น เพื่อรับ ของรางวัลพิเศษ ที่เรามอบให้สมาชิกทุกท่าน นอกจากนี้ยังมีระบบ ลูกค้าระดับพรีเมียม สำหรับลูกค้าคนสำคัญ และช่องทาง พาร์ทเนอร์ สำหรับผู้ที่สนใจสร้างรายได้ร่วมกับเรา
ช่องทางติดต่อ
หากมี ปัญหา หรือ คำแนะนำ สามารถติดต่อทีมงานของเราได้ตลอด 24 ชั่วโมงที่หน้า ศูนย์ช่วยเหลือ และ ข้อเสนอแนะ ทีมงาน TKBNEKO ยินดีให้บริการทุกท่านด้วยใจ
PG Slot แพลตฟอร์มเกมสล็อตยอดนิยม เล่นง่าย ฝากถอนเร็ว
คำค้นหา สล็อต PG กำลังได้รับความนิยมอย่างต่อเนื่อง ในกลุ่มผู้เล่นเกมสล็อตออนไลน์ เพราะเป็น ผู้ให้บริการเกมสล็อตที่มาแรง ด้าน งานภาพคุณภาพสูง ความ เสถียร และ ระบบจ่ายที่ดึงดูด เกมของ PG ผลิตโดยค่ายมาตรฐาน ที่รองรับการเล่นทั้งบน สมาร์ทโฟน และ เดสก์ท็อป
จุดเด่น ของ pg slot
pg slot เป็นเกมสล็อตออนไลน์ที่ออกแบบมาให้ เปิดเกมได้ทันที เล่นผ่าน ระบบอัตโนมัติ และรองรับ ทุกอุปกรณ์ เข้าเล่นผ่านเว็บได้เลย ผู้เล่นสามารถเข้าเล่นผ่าน เว็บเบราว์เซอร์ ได้ทันที ภาพและเสียงถูกพัฒนาในรูปแบบ สามมิติ ให้ความคมชัด พร้อมเอฟเฟกต์ สมจริง
คุณสมบัติหลักของเกม pg slot ได้แก่
โบนัสและฟรีสปินหลายแบบ
ระบบตัวคูณ
โหมดทดลองเล่นฟรี
มีเมนูภาษาไทย
ระบบฝากถอนสะดวก ไม่ต้องรอนาน
แพลตฟอร์ม pg slot มักมี การฝาก-ถอน ออโต้ตลอด 24 ชม. ขั้นต่ำเริ่มต้นเพียง 10 บาท ขึ้นอยู่กับ เงื่อนไขของเว็บไซต์ การทำรายการใช้เวลา เพียงไม่กี่วินาที ผ่าน QR Code หรือระบบ ธนาคารบนมือถือ ทำให้ธุรกรรมเป็นไปอย่าง ลื่นไหล
หมวดเกมฮิต ใน PG Slot
เกม PG Slot มีธีมหลากหลาย เช่น
ธีม เทพเจ้าและแฟนตาซี
ธีม ผจญภัย
ธีม โชคลาภ
ธีม สัตว์และธรรมชาติ
เกมยอดนิยมมักเป็นเกมที่แตกง่าย พร้อมระบบ โบนัสรอบพิเศษ และ อัตราการจ่ายที่สูง เหมาะกับทั้ง มือใหม่ และ ผู้เล่นมือโปร
ความน่าเชื่อถือ
PG Slot มีมาตรฐานรองรับ มีการ รักษาความปลอดภัย และใช้ระบบสุ่มผล Random Number Generator เพื่อให้ผลลัพธ์ ตรวจสอบได้ แพลตฟอร์มที่ให้บริการ PG Slot ควรมี ความปลอดภัยสูง
บทสรุปท้ายบท
pg slot เป็นตัวเลือกยอดนิยมสำหรับผู้ที่ต้องการเล่นสล็อตออนไลน์ ด้วยจุดเด่นด้าน โบนัสหลากหลาย และการทำธุรกรรมที่ ไว ผู้เล่นสามารถเริ่มต้นได้ ง่าย ฝากถอนสะดวก และเลือกเกมได้ หลากหลายแนว เหมาะสำหรับ ทุกระดับประสบการณ์ ในโลกของเกมสล็อตออนไลน์
สล็อต
TKBNEKO มอบมิติใหม่ของเกมออนไลน์ ธุรกรรมรวดเร็ว ด้วยระบบสแกน คิวอาร์โค้ด
ในยุคดิจิทัลที่ เทคโนโลยีพัฒนาอย่างรวดเร็ว เรามุ่งเน้นมาตรฐานใหม่ของการเดิมพัน ด้วยระบบที่ ล้ำสมัย เสถียร และ ตรวจสอบได้ เพื่อให้ผู้เล่น มั่นใจ ทุกครั้งที่ใช้งาน
ระบบการเงินที่ใช้งานง่าย
ฝากขั้นต่ำ: เริ่มต้น 1 บาท
ถอนขั้นต่ำ: 1 บาท
เวลาฝากเงิน: ใช้เวลาเพียง 3 วินาที
ยอดถอน: ไม่มีลิมิต
ฝากง่าย เพียงสแกน QR Code
สแกน คิวอาร์ ระบบจะ ประมวลผลอัตโนมัติ ขั้นต่ำ เริ่ม 100 บาท สูงสุด 500,000 บาท
หมวดหมู่เกม
สล็อต: ลุ้นแจ็คพอต
เกมสด: ดีลเลอร์สด
กีฬา: เดิมพันลีกดัง
ยิงปลา: ลุ้นกำไรทันที
โปรโมชั่นและสิทธิพิเศษ
ติดตามหน้า โบนัส พร้อมระบบ สมาชิกพรีเมียม และโปรแกรม พันธมิตร
ติดต่อเรา
สอบถามข้อมูลได้ตลอด 24 ชั่วโมง ผ่านหน้า ศูนย์ช่วยเหลือ ทีมงาน TKBNEKO พร้อมดูแลตลอดเวลา
ทดลองเล่นสล็อต pg ซื้อฟรีสปิน
PG Slot เกมสล็อตออนไลน์ที่คนค้นหาเยอะ เล่นง่าย ฝากถอนเร็ว
คำค้นหา pg slot ถูกค้นหามากขึ้นเรื่อยๆ ในกลุ่มผู้เล่นเกมสล็อตออนไลน์ เพราะเป็น ค่ายเกมที่มีชื่อเสียง ด้าน ภาพและเอฟเฟกต์ ความ นิ่งไม่สะดุด และ โอกาสรับกำไรที่ดี เกมของ PG ออกแบบโดยทีมงานมืออาชีพ ที่รองรับการเล่นทั้งบน สมาร์ทโฟน และ เดสก์ท็อป
ข้อดี ของ สล็อต PG
สล็อต PG เป็นเกมสล็อตออนไลน์ที่ออกแบบมาให้ เข้าเกมไว เล่นผ่าน ระบบเว็บ และรองรับ ทุกอุปกรณ์ ไม่ต้องดาวน์โหลดแอป ผู้เล่นสามารถเข้าเล่นผ่าน Browser ได้ทันที ภาพและเสียงถูกพัฒนาในรูปแบบ เอฟเฟกต์ 3 มิติ ให้ความคมชัด พร้อมเอฟเฟกต์ สมจริง
คุณสมบัติหลักของเกม สล็อต PG ได้แก่
ระบบโบนัสและฟรีสปินหลากหลายรูปแบบ
ฟีเจอร์ตัวคูณรางวัล
โหมดทดลองเล่นฟรี
ใช้งานภาษาไทยง่าย
ระบบการเงินรวดเร็ว ทำรายการไว
แพลตฟอร์ม pg slot ส่วนใหญ่รองรับ การฝาก-ถอน ออโต้ตลอด 24 ชม. ขั้นต่ำเริ่มต้นเพียง หลักหน่วย ขึ้นอยู่กับ ระบบของผู้ให้บริการ การทำรายการใช้เวลา ไม่กี่วินาที ผ่าน คิวอาร์โค้ด หรือระบบ แอปธนาคาร ทำให้ธุรกรรมเป็นไปอย่าง ต่อเนื่อง
ประเภทเกมยอดนิยม ใน PG Slot
เกม สล็อต PG มีธีมหลากหลาย เช่น
ธีม เทพเจ้า
ธีม ผจญภัย
ธีม เอเชียและโชคลาภ
ธีม สัตว์และธรรมชาติ
ผู้เล่นนิยมเกมที่มีรอบพิเศษบ่อย พร้อมระบบ Special Feature และ โอกาสทำกำไรสูง เหมาะกับทั้ง มือใหม่ และ สายสล็อตจริงจัง
มาตรฐานระบบ
pg slot ใช้ระบบที่ได้มาตรฐาน มีการ เข้ารหัสข้อมูล และใช้ระบบสุ่มผล ระบบสุ่มมาตรฐาน เพื่อให้ผลลัพธ์ โปร่งใส แพลตฟอร์มที่ให้บริการ PG Slot ควรมี ทีมซัพพอร์ต 24 ชม.
บทสรุปท้ายบท
PG Slot เป็นตัวเลือกยอดนิยมสำหรับผู้ที่ต้องการเล่นสล็อตออนไลน์ ด้วยจุดเด่นด้าน ระบบลื่นไหล และการทำธุรกรรมที่ ทันใจ ผู้เล่นสามารถเริ่มต้นได้ ไม่ซับซ้อน ฝากถอนสะดวก และเลือกเกมได้ ครบทุกหมวด เหมาะสำหรับ ผู้เล่นทุกสไตล์ ในโลกของเกมสล็อตออนไลน์
https://medium.com/@ratypw/ทดลองเล่นสล็อต-pg-70cdb1132344
ทดลองเล่นสล็อต pg ฟรี สล็อต PG แพลตฟอร์มเกมสล็อตยอดนิยม เข้าเล่นไว ฝากถอนออโต้
คำค้นหา pg slot มาแรงในช่วงนี้ ในกลุ่มผู้เล่นเกมสล็อตออนไลน์ เพราะเป็น ผู้ให้บริการเกมสล็อตที่มาแรง ด้าน งานภาพคุณภาพสูง ความ เสถียร และ โอกาสรับกำไรที่ดี เกมของ PG ออกแบบโดยทีมงานมืออาชีพ ที่รองรับการเล่นทั้งบน โทรศัพท์มือถือ และ คอมพิวเตอร์
ข้อดี ของ สล็อต PG
PG Slot เป็นเกมสล็อตออนไลน์ที่ออกแบบมาให้ โหลดเร็ว เล่นผ่าน ระบบอัตโนมัติ และรองรับ ทุกอุปกรณ์ ไม่ต้องดาวน์โหลดแอป ผู้เล่นสามารถเข้าเล่นผ่าน เว็บเบราว์เซอร์ ได้ทันที ภาพและเสียงถูกพัฒนาในรูปแบบ สามมิติ ให้ความคมชัด พร้อมเอฟเฟกต์ สมจริง
คุณสมบัติหลักของเกม pg slot ได้แก่
มีรอบโบนัสให้ลุ้นบ่อย
ฟีเจอร์ตัวคูณรางวัล
เล่นฟรีก่อนเติมเงิน
รองรับภาษาไทยเต็มรูปแบบ
ฝากถอนง่าย ทำรายการไว
แพลตฟอร์ม pg slot มักมี การฝาก-ถอน ออโต้ตลอด 24 ชม. ขั้นต่ำเริ่มต้นเพียง 10 บาท ขึ้นอยู่กับ เงื่อนไขของเว็บไซต์ การทำรายการใช้เวลา ไม่กี่วินาที ผ่าน QR Code หรือระบบ Mobile Banking ทำให้ธุรกรรมเป็นไปอย่าง ลื่นไหล
หมวดเกมฮิต ใน pg slot
เกม pg slot มีธีมหลากหลาย เช่น
ธีม เทพเจ้า
ธีม ผจญภัย
ธีม เอเชียและโชคลาภ
ธีม Animal
เกมยอดนิยมมักเป็นเกมที่แตกง่าย พร้อมระบบ Special Feature และ อัตราการจ่ายที่สูง เหมาะกับทั้ง ผู้เล่นเริ่มต้น และ ผู้เล่นมือโปร
ความน่าเชื่อถือ
pg slot พัฒนาในระบบสากล มีการ เข้ารหัสข้อมูล และใช้ระบบสุ่มผล Random Number Generator เพื่อให้ผลลัพธ์ โปร่งใส แพลตฟอร์มที่ให้บริการ PG Slot ควรมี ความปลอดภัยสูง
สรุป
pg slot เป็นตัวเลือกยอดนิยมสำหรับผู้ที่ต้องการเล่นสล็อตออนไลน์ ด้วยจุดเด่นด้าน กราฟิกคุณภาพ และการทำธุรกรรมที่ ไว ผู้เล่นสามารถเริ่มต้นได้ ง่าย ฝากถอนสะดวก และเลือกเกมได้ หลากหลายแนว เหมาะสำหรับ ทุกระดับประสบการณ์ ในโลกของเกมสล็อตออนไลน์
ทดลองเล่นสล็อต pg เว็บ ตรง”
PG Slot สล็อตยอดฮิต เล่นง่าย ฝากถอนเร็ว
คำค้นหา สล็อต PG มาแรงในช่วงนี้ ในกลุ่มผู้เล่นเกมสล็อตออนไลน์ เพราะเป็น ผู้ให้บริการเกมสล็อตที่มาแรง ด้าน กราฟิก ความ ลื่นไหล และ ระบบจ่ายที่ดึงดูด เกมของ PG ผลิตโดยค่ายมาตรฐาน ที่รองรับการเล่นทั้งบน มือถือ และ พีซี
จุดเด่น ของ pg slot
pg slot เป็นเกมสล็อตออนไลน์ที่ออกแบบมาให้ เปิดเกมได้ทันที เล่นผ่าน ระบบอัตโนมัติ และรองรับ ทุกอุปกรณ์ ไม่ต้องติดตั้งเพิ่มเติม ผู้เล่นสามารถเข้าเล่นผ่าน Browser ได้ทันที ภาพและเสียงถูกพัฒนาในรูปแบบ เอฟเฟกต์ 3 มิติ ให้ความคมชัด พร้อมเอฟเฟกต์ สมจริง
คุณสมบัติหลักของเกม สล็อต PG ได้แก่
โบนัสและฟรีสปินหลายแบบ
Multiplier
โหมดทดลองเล่นฟรี
ใช้งานภาษาไทยง่าย
ฝากถอนง่าย ไม่ต้องรอนาน
แพลตฟอร์ม สล็อต PG โดยทั่วไปให้บริการ การฝาก-ถอน ออโต้ตลอด 24 ชม. ขั้นต่ำเริ่มต้นเพียง 10 บาท ขึ้นอยู่กับ กติกาแต่ละแพลตฟอร์ม การทำรายการใช้เวลา ไม่กี่วินาที ผ่าน สแกน QR หรือระบบ Mobile Banking ทำให้ธุรกรรมเป็นไปอย่าง ต่อเนื่อง
ประเภทเกมยอดนิยม ใน PG Slot
เกม PG Slot มีธีมหลากหลาย เช่น
ธีม เทพเจ้าและแฟนตาซี
ธีม ผจญภัย
ธีม ความมั่งคั่ง
ธีม สัตว์และธรรมชาติ
ผู้เล่นนิยมเกมที่มีรอบพิเศษบ่อย พร้อมระบบ โบนัสรอบพิเศษ และ ระบบจ่ายคุ้มค่า เหมาะกับทั้ง ผู้เล่นเริ่มต้น และ ผู้เล่นที่มีประสบการณ์
ความน่าเชื่อถือ
PG Slot มีมาตรฐานรองรับ มีการ รักษาความปลอดภัย และใช้ระบบสุ่มผล ระบบสุ่มมาตรฐาน เพื่อให้ผลลัพธ์ ตรวจสอบได้ แพลตฟอร์มที่ให้บริการ สล็อต PG ควรมี ทีมซัพพอร์ต 24 ชม.
สรุป
pg slot เป็นตัวเลือกยอดนิยมสำหรับผู้ที่ต้องการเล่นสล็อตออนไลน์ ด้วยจุดเด่นด้าน ระบบลื่นไหล และการทำธุรกรรมที่ ไว ผู้เล่นสามารถเริ่มต้นได้ ไม่ซับซ้อน ฝากถอนสะดวก และเลือกเกมได้ หลากหลายแนว เหมาะสำหรับ ทั้งมือใหม่และมือโปร ในโลกของเกมสล็อตออนไลน์
ทดลองเล่นสล็อต pg ไม่ เด้ง
เว็บไซต์ TKBNEKO พาคุณสู่โลกใหม่ของเกมเดิมพันออนไลน์ ฝาก-ถอนไว ด้วยระบบสแกน คิวอาร์โค้ด
ในยุคที่ โลกออนไลน์พัฒนาอย่างรวดเร็ว TKBNEKO ขอเป็นส่วนหนึ่งในการปฏิวัติวงการเกม ด้วยระบบการให้บริการที่ อัปเดตตลอดเวลา เสถียร และ ชัดเจน พร้อมต้อนรับสมาชิกทุกท่านสู่ ประสบการณ์ความบันเทิงรูปแบบใหม่ ที่ ใครๆ ก็เป็นเถ้าแก่ได้
ทำไมต้อง TKBNEKO?
TKBNEKO มุ่งมั่นที่จะมอบประสบการณ์จากเกมลิขสิทธิ์แท้ โดยเฉพาะเกมที่ ผ่านการรับรองจากสถาบันที่น่าเชื่อถือ และ เป็นที่นิยมในระดับสากล เพื่อให้ผู้เล่นทุกคน มั่นใจ ได้ว่า จะได้รับความเพลิดเพลินกับเกมที่ ยุติธรรม มีระบบรักษาความปลอดภัยสูง และ มีคุณภาพสูง
ระบบการเงินที่เหนือกว่า
เราออกแบบระบบการเงินให้ง่ายและเร็วที่สุด เพื่อให้คุณ โฟกัสกับความสนุกได้อย่างเต็มที่
ฝากขั้นต่ำ: เริ่มต้นเพียง 1 บาท
ถอนขั้นต่ำ: 1 บาท
เวลาฝากเงิน: ใช้เวลาเพียง 3 วินาที
ยอดจำกัดการถอน: ไม่มีลิมิตการถอนรายวัน
ฝากง่าย เพียงสแกน QR Code
เพียงคุณสแกน QR Code ระบบของเราจะ ประมวลผลอย่างรวดเร็ว ขั้นต่ำเพียง เริ่มต้น 100 บาท และสามารถฝากได้สูงถึง ไม่เกิน 500,000 บาทต่อครั้ง เริ่มต้นได้ทันที กับ แพลตฟอร์มของเรา ที่ ตอบโจทย์การเดิมพันยุคใหม่
หมวดหมู่เกมที่ครบครัน
TKBNEKO รวมเกมสุดฮิตไว้ในที่เดียว รองรับทุกความชอบของผู้เล่น
สล็อต: แจ็คพอตแตกง่าย ลุ้นได้ทุกวัน
เกมสด: สัมผัสประสบการณ์คาสิโนแบบเรียลไทม์
กีฬา: เดิมพันกับแมตช์การแข่งขันจากทั่วโลก
ยิงปลา: สนุกกับการยิงปลาแบบได้เงิน
ติดตามโปรโมชั่นและสิทธิพิเศษ
อย่าลืมแวะมาเยี่ยมชมที่หน้า โบนัส เพื่อรับ ของรางวัลพิเศษ ที่เรามอบให้สมาชิกทุกท่าน นอกจากนี้ยังมีระบบ สมาชิกวีไอพี สำหรับลูกค้าคนสำคัญ และช่องทาง พันธมิตร สำหรับผู้ที่สนใจสร้างรายได้ร่วมกับเรา
ช่องทางติดต่อ
หากมี ข้อสงสัย หรือ ความคิดเห็น สามารถติดต่อทีมงานของเราได้ตลอด 24 ชั่วโมงที่หน้า ฝ่ายสนับสนุน และ ข้อเสนอแนะ ทีมงาน ของเรา ยินดีให้บริการทุกท่านด้วยใจ
สล็อต
แพลตฟอร์ม TKBNEKO เปิดประสบการณ์ใหม่แห่งการเดิมพันออนไลน์ ธุรกรรมรวดเร็ว ด้วยระบบสแกน QR Code
ในยุคดิจิทัลที่ เทคโนโลยีพัฒนาอย่างรวดเร็ว TKBNEKO พร้อมยกระดับการให้บริการ ด้วยระบบที่ ทันสมัย เสถียร และ โปร่งใส เพื่อให้ผู้เล่น อุ่นใจ ทุกครั้งที่ใช้งาน
จุดเด่นระบบฝาก-ถอน
ฝากขั้นต่ำ: 1 บาท
ถอนขั้นต่ำ: 1 บาท
เวลาฝากเงิน: ใช้เวลาเพียง 3 วินาที
ยอดถอน: ไม่จำกัดต่อวัน
ฝากง่าย เพียงสแกน QR Code
สแกน คิวอาร์ ระบบจะ ประมวลผลอัตโนมัติ ขั้นต่ำ เริ่ม 100 บาท สูงสุด 500,000 บาท
เกมยอดนิยม
สล็อต: ธีมหลากหลาย
เกมสด: ดีลเลอร์สด
กีฬา: แมตช์ทั่วโลก
ยิงปลา: ลุ้นกำไรทันที
โบนัสและโปรโมชัน
ติดตามหน้า โบนัส พร้อมระบบ สมาชิกพรีเมียม และโปรแกรม แอฟฟิลิเอต
ติดต่อเรา
สอบถามข้อมูลได้ตลอด 24 ชั่วโมง ผ่านหน้า ติดต่อเรา ทีมงาน ของเรา พร้อมดูแลตลอดเวลา
PG Slot เกมสล็อตออนไลน์ที่คนค้นหาเยอะ ใช้งานง่าย ฝากถอนรวดเร็ว
คำค้นหา สล็อต PG มาแรงในช่วงนี้ ในกลุ่มผู้เล่นเกมสล็อตออนไลน์ เพราะเป็น แบรนด์เกมที่โดดเด่น ด้าน งานภาพคุณภาพสูง ความ เสถียร และ ระบบจ่ายที่ดึงดูด เกมของ PG พัฒนาโดยผู้ให้บริการชั้นนำ ที่รองรับการเล่นทั้งบน สมาร์ทโฟน และ คอมพิวเตอร์
ความโดดเด่น ของ PG Slot
สล็อต PG เป็นเกมสล็อตออนไลน์ที่ออกแบบมาให้ โหลดเร็ว เล่นผ่าน ระบบออนไลน์ และรองรับ ทุกแพลตฟอร์ม ไม่ต้องติดตั้งเพิ่มเติม ผู้เล่นสามารถเข้าเล่นผ่าน เว็บเบราว์เซอร์ ได้ทันที ภาพและเสียงถูกพัฒนาในรูปแบบ สามมิติ ให้ความคมชัด พร้อมเอฟเฟกต์ สวยงาม
คุณสมบัติหลักของเกม สล็อต PG ได้แก่
มีรอบโบนัสให้ลุ้นบ่อย
ระบบตัวคูณ
เดโม่ฟรี
มีเมนูภาษาไทย
ระบบฝากถอนสะดวก ทำรายการไว
แพลตฟอร์ม สล็อต PG ส่วนใหญ่รองรับ การฝาก-ถอน ฝากถอนตลอดเวลา ขั้นต่ำเริ่มต้นเพียง หลักหน่วย ขึ้นอยู่กับ กติกาแต่ละแพลตฟอร์ม การทำรายการใช้เวลา รวดเร็วมาก ผ่าน สแกน QR หรือระบบ Mobile Banking ทำให้ธุรกรรมเป็นไปอย่าง ไม่สะดุด
แนวเกมที่คนเล่นเยอะ ใน PG Slot
เกม PG Slot มีธีมหลากหลาย เช่น
ธีม เทพเจ้าและแฟนตาซี
ธีม ลุยด่าน
ธีม ความมั่งคั่ง
ธีม Animal
เกมยอดนิยมมักเป็นเกมที่แตกง่าย พร้อมระบบ Special Feature และ โอกาสทำกำไรสูง เหมาะกับทั้ง คนเพิ่งเล่น และ ผู้เล่นมือโปร
ความปลอดภัย
PG Slot ใช้ระบบที่ได้มาตรฐาน มีการ รักษาความปลอดภัย และใช้ระบบสุ่มผล Random Number Generator เพื่อให้ผลลัพธ์ ตรวจสอบได้ แพลตฟอร์มที่ให้บริการ pg slot ควรมี ความปลอดภัยสูง
บทสรุปท้ายบท
สล็อต PG เป็นตัวเลือกยอดนิยมสำหรับผู้ที่ต้องการเล่นสล็อตออนไลน์ ด้วยจุดเด่นด้าน ระบบลื่นไหล และการทำธุรกรรมที่ รวดเร็ว ผู้เล่นสามารถเริ่มต้นได้ ง่าย ฝากถอนสะดวก และเลือกเกมได้ จำนวนมาก เหมาะสำหรับ ทั้งมือใหม่และมือโปร ในโลกของเกมสล็อตออนไลน์
Автозайм
Займ под залог ПТС в городе Самара — это способ взять деньги под авто без продажи машины и без длительных банковских процедур. Основная характеристика такого займа — транспорт остаётся у владельца у собственника, а в качестве залога передаётся только ПТС. Такой формат даёт возможность продолжать пользоваться машиной, на протяжении срок договора.
Получение денег происходит в день подачи заявки. Обращение рассматривается примерно за 15 мин, затем выносится решение по сумме и условиям оформления. Сумма займа может достигать до 5 000 000 ?, а ставка стартует с уровня 2% в месяц. Период кредитования как правило составляет до 60 мес., по этой причине заёмщик выбирает удобный график выплат.
Система оформления заявки доступна через интернет. Клиент оставляет форму, вносит информацию об авто и желаемую сумму. После проверки документов приходит предварительное решение. В большинстве случаев средства переводятся в тот же день, после подписания договор займа.
Для оценки условий используется онлайн-калькулятор. К примеру, если взять 300 000 ? на период 12 мес. ежемесячный платёж составит примерно 33 057 ?. Общая переплата по такому займу составит примерно 96 684 ?. Итоговые условия могут изменяться в зависимости оценки автомобиля и выбранного срока займа.
На сайтах автозаймов нередко отображается лента заявок. Она демонстрирует активность системы и примеры обработанных заявок из разных городов. К примеру, заявки на суммы 1 840 000 ? из Тулы, 1 890 000 ? город Москва или 1 470 000 ? город Челябинск могут получать статус «Одобрено». Некоторые заявок находятся в стадии проверки — например такие суммы, 290 000 ? из Сочи или 720 000 ? город Екатеринбург. Такие блоки отображают текущую активность платформы и число обработанных заявок сегодня и в текущем месяце.
Займ с залогом ПТС может подойти тем, кому требуется быстро получить значительную сумму без продажи автомобиля. Базовые условия таких займов — ставка начиная от 2% в месяц, одобрение около 15 минут, сумма до 5 000 000 ? и возможность подать заявку онлайн. После подачи заявки заёмщик ожидает решение, написать в мессенджер или обратиться к менеджеру для уточнения оформления.
pg slot เกมสล็อตออนไลน์ที่คนค้นหาเยอะ เข้าเล่นไว ฝากถอนออโต้
คำค้นหา pg slot ถูกค้นหามากขึ้นเรื่อยๆ ในกลุ่มผู้เล่นเกมสล็อตออนไลน์ เพราะเป็น ผู้ให้บริการเกมสล็อตที่มาแรง ด้าน กราฟิก ความ เสถียร และ ระบบจ่ายที่ดึงดูด เกมของ PG ผลิตโดยค่ายมาตรฐาน ที่รองรับการเล่นทั้งบน โทรศัพท์มือถือ และ พีซี
จุดเด่น ของ pg slot
สล็อต PG เป็นเกมสล็อตออนไลน์ที่ออกแบบมาให้ โหลดเร็ว เล่นผ่าน ระบบเว็บ และรองรับ ทั้ง iOS และ Android ไม่ต้องดาวน์โหลดแอป ผู้เล่นสามารถเข้าเล่นผ่าน เว็บเบราว์เซอร์ ได้ทันที ภาพและเสียงถูกพัฒนาในรูปแบบ เอฟเฟกต์ 3 มิติ ให้ความคมชัด พร้อมเอฟเฟกต์ สมจริง
คุณสมบัติหลักของเกม สล็อต PG ได้แก่
โบนัสและฟรีสปินหลายแบบ
ระบบตัวคูณ
เดโม่ฟรี
รองรับภาษาไทยเต็มรูปแบบ
ฝากถอนง่าย ทันใจ
แพลตฟอร์ม PG Slot โดยทั่วไปให้บริการ การฝาก-ถอน ออโต้ตลอด 24 ชม. ขั้นต่ำเริ่มต้นเพียง หลักหน่วย ขึ้นอยู่กับ กติกาแต่ละแพลตฟอร์ม การทำรายการใช้เวลา ไม่กี่วินาที ผ่าน สแกน QR หรือระบบ ธนาคารบนมือถือ ทำให้ธุรกรรมเป็นไปอย่าง ลื่นไหล
ประเภทเกมยอดนิยม ใน pg slot
เกม สล็อต PG มีธีมหลากหลาย เช่น
ธีม เทพเจ้าและแฟนตาซี
ธีม ลุยด่าน
ธีม เอเชียและโชคลาภ
ธีม ธรรมชาติ
เกมยอดนิยมมักเป็นเกมที่แตกง่าย พร้อมระบบ Special Feature และ อัตราการจ่ายที่สูง เหมาะกับทั้ง คนเพิ่งเล่น และ ผู้เล่นที่มีประสบการณ์
มาตรฐานระบบ
PG Slot มีมาตรฐานรองรับ มีการ ปกป้องข้อมูลผู้เล่น และใช้ระบบสุ่มผล RNG เพื่อให้ผลลัพธ์ ตรวจสอบได้ แพลตฟอร์มที่ให้บริการ PG Slot ควรมี ทีมซัพพอร์ต 24 ชม.
บทสรุปท้ายบท
PG Slot เป็นตัวเลือกยอดนิยมสำหรับผู้ที่ต้องการเล่นสล็อตออนไลน์ ด้วยจุดเด่นด้าน ระบบลื่นไหล และการทำธุรกรรมที่ ไว ผู้เล่นสามารถเริ่มต้นได้ ง่าย ฝากถอนสะดวก และเลือกเกมได้ หลากหลายแนว เหมาะสำหรับ ทุกระดับประสบการณ์ ในโลกของเกมสล็อตออนไลน์
https://medium.com/@ratypw/ทดลองเล่นสล็อต-pg-70cdb1132344
ทดลองเล่นสล็อต pg ไม่ เด้ง
ทดลองเล่นสล็อต pg ฟรี pg slot สล็อตยอดฮิต ใช้งานง่าย ฝากถอนรวดเร็ว
คำค้นหา pg slot ถูกค้นหามากขึ้นเรื่อยๆ ในกลุ่มผู้เล่นเกมสล็อตออนไลน์ เพราะเป็น ค่ายเกมที่มีชื่อเสียง ด้าน ภาพและเอฟเฟกต์ ความ ลื่นไหล และ อัตราการจ่ายรางวัลที่น่าสนใจ เกมของ PG ผลิตโดยค่ายมาตรฐาน ที่รองรับการเล่นทั้งบน สมาร์ทโฟน และ พีซี
ข้อดี ของ สล็อต PG
สล็อต PG เป็นเกมสล็อตออนไลน์ที่ออกแบบมาให้ เข้าเกมไว เล่นผ่าน ระบบเว็บ และรองรับ ทั้ง iOS และ Android เข้าเล่นผ่านเว็บได้เลย ผู้เล่นสามารถเข้าเล่นผ่าน หน้าเว็บ ได้ทันที ภาพและเสียงถูกพัฒนาในรูปแบบ เอฟเฟกต์ 3 มิติ ให้ความคมชัด พร้อมเอฟเฟกต์ สมจริง
คุณสมบัติหลักของเกม pg slot ได้แก่
มีรอบโบนัสให้ลุ้นบ่อย
ระบบตัวคูณ
เล่นฟรีก่อนเติมเงิน
มีเมนูภาษาไทย
ฝากถอนง่าย ไม่ต้องรอนาน
แพลตฟอร์ม PG Slot ส่วนใหญ่รองรับ การฝาก-ถอน ฝากถอนตลอดเวลา ขั้นต่ำเริ่มต้นเพียง 1 บาท ขึ้นอยู่กับ กติกาแต่ละแพลตฟอร์ม การทำรายการใช้เวลา เพียงไม่กี่วินาที ผ่าน สแกน QR หรือระบบ แอปธนาคาร ทำให้ธุรกรรมเป็นไปอย่าง ลื่นไหล
ประเภทเกมยอดนิยม ใน PG Slot
เกม สล็อต PG มีธีมหลากหลาย เช่น
ธีม แฟนตาซี
ธีม ลุยด่าน
ธีม ความมั่งคั่ง
ธีม สัตว์และธรรมชาติ
หลายคนชอบเกมที่โบนัสเข้าไว พร้อมระบบ Special Feature และ อัตราการจ่ายที่สูง เหมาะกับทั้ง มือใหม่ และ ผู้เล่นมือโปร
ความปลอดภัย
pg slot มีมาตรฐานรองรับ มีการ รักษาความปลอดภัย และใช้ระบบสุ่มผล Random Number Generator เพื่อให้ผลลัพธ์ ยุติธรรม แพลตฟอร์มที่ให้บริการ สล็อต PG ควรมี ความปลอดภัยสูง
สรุป
PG Slot เป็นตัวเลือกยอดนิยมสำหรับผู้ที่ต้องการเล่นสล็อตออนไลน์ ด้วยจุดเด่นด้าน โบนัสหลากหลาย และการทำธุรกรรมที่ ไว ผู้เล่นสามารถเริ่มต้นได้ ง่าย ฝากถอนสะดวก และเลือกเกมได้ จำนวนมาก เหมาะสำหรับ ทั้งมือใหม่และมือโปร ในโลกของเกมสล็อตออนไลน์
rufus download Rufus is a lightweight, no-cost, open source utility created to make bootable USB drives. It allows you to prepare a USB flash drive that can set up an operating system, launch diagnostic tools, or start a recovery environment. The program does not require installation and can be opened right after download.
The main purpose of Rufus is to create bootable USB media from ISO images fast and reliably. This lets people install or run operating systems directly from a USB flash drive without the need for DVDs. The tool supports a broad selection of operating systems and service utilities, which makes it practical for both regular users and system administrators.
Rufus works on computers with Microsoft Windows, starting from Windows 7. Both 32-bit and 64-bit versions are supported, and there is also a version available for ARM64 architecture.
The software allows users to create bootable USB drives from many different ISO images. It can be used to prepare a USB drive for installing Windows 11, Windows 10, Windows 8.1, or Windows 7, as well as various Linux distributions. Rufus also works with DOS systems and other recovery or maintenance tools commonly used for troubleshooting computers.
One of the built-in features of Rufus is the ability to download official Windows ISO images directly from Microsoft servers. This allows users to obtain original installation images for Windows 8.1, Windows 10, and Windows 11 without searching for them on third-party websites.
In addition to creating bootable drives, Rufus can format USB devices. It supports several file systems including FAT32, NTFS, exFAT, UDF, and ReFS. This flexibility allows the USB drive to be prepared for different use cases and compatibility requirements.
Rufus supports both legacy BIOS systems and modern UEFI environments. Because of this, bootable drives created with Rufus can work on older computers as well as newer systems that use UEFI and Secure Boot.
Another feature included in Rufus is Windows To Go support. This option allows users to run a full Windows environment directly from a USB drive. It can be useful for testing systems, performing maintenance, or working on multiple computers without installing Windows on the internal drive.
Rufus also provides the option to bypass certain Windows 11 installation requirements. When creating an installation USB, the program can disable checks for TPM 2.0, Secure Boot, and minimum RAM requirements. This makes it possible to install Windows 11 on computers that would otherwise not meet the official hardware requirements.
One of the reasons Rufus has become popular is its speed and simplicity. The program is extremely small, about 1.9 MB in size, and runs as a portable application without installation. It is distributed under the GPL v3 open-source license, supports more than 70 languages, and contains no advertisements, bundled software, or tracking components.
Rufus works with a large number of ISO images. These include multiple versions of Windows, Windows Server editions, FreeDOS, and various system tools such as GParted, Hiren’s Boot CD, Parted Magic, and Clonezilla. Because of this wide compatibility, the program can be used not only for installing operating systems but also for disk management, data recovery, and system maintenance tasks.
To use Rufus, a computer running Windows 7 or later and a USB flash drive are required. The program does not need to be installed. Users simply download the executable file, run it, select the ISO image they want to use, and create a bootable USB drive. Due to its simplicity, speed, and reliability, Rufus remains one of the most widely used tools for creating bootable USB drives.
สล็อต PG แพลตฟอร์มเกมสล็อตยอดนิยม เข้าเล่นไว ฝากถอนออโต้
คำค้นหา pg slot กำลังได้รับความนิยมอย่างต่อเนื่อง ในกลุ่มผู้เล่นเกมสล็อตออนไลน์ เพราะเป็น ค่ายเกมที่มีชื่อเสียง ด้าน งานภาพคุณภาพสูง ความ ลื่นไหล และ อัตราการจ่ายรางวัลที่น่าสนใจ เกมของ PG ผลิตโดยค่ายมาตรฐาน ที่รองรับการเล่นทั้งบน สมาร์ทโฟน และ คอมพิวเตอร์
ข้อดี ของ PG Slot
pg slot เป็นเกมสล็อตออนไลน์ที่ออกแบบมาให้ เปิดเกมได้ทันที เล่นผ่าน ระบบออนไลน์ และรองรับ ทั้ง iOS และ Android ไม่ต้องติดตั้งเพิ่มเติม ผู้เล่นสามารถเข้าเล่นผ่าน Browser ได้ทันที ภาพและเสียงถูกพัฒนาในรูปแบบ สามมิติ ให้ความคมชัด พร้อมเอฟเฟกต์ สวยงาม
คุณสมบัติหลักของเกม PG Slot ได้แก่
ระบบโบนัสและฟรีสปินหลากหลายรูปแบบ
Multiplier
เล่นฟรีก่อนเติมเงิน
ใช้งานภาษาไทยง่าย
ระบบการเงินรวดเร็ว ทันใจ
แพลตฟอร์ม PG Slot มักมี การฝาก-ถอน ฝากถอนตลอดเวลา ขั้นต่ำเริ่มต้นเพียง 1 บาท ขึ้นอยู่กับ เงื่อนไขของเว็บไซต์ การทำรายการใช้เวลา เพียงไม่กี่วินาที ผ่าน QR Code หรือระบบ แอปธนาคาร ทำให้ธุรกรรมเป็นไปอย่าง ต่อเนื่อง
ประเภทเกมยอดนิยม ใน PG Slot
เกม PG Slot มีธีมหลากหลาย เช่น
ธีม แฟนตาซี
ธีม ผจญภัย
ธีม โชคลาภ
ธีม สัตว์และธรรมชาติ
ผู้เล่นนิยมเกมที่มีรอบพิเศษบ่อย พร้อมระบบ โบนัสรอบพิเศษ และ โอกาสทำกำไรสูง เหมาะกับทั้ง มือใหม่ และ ผู้เล่นที่มีประสบการณ์
ความปลอดภัย
pg slot มีมาตรฐานรองรับ มีการ รักษาความปลอดภัย และใช้ระบบสุ่มผล RNG เพื่อให้ผลลัพธ์ ตรวจสอบได้ แพลตฟอร์มที่ให้บริการ PG Slot ควรมี ความปลอดภัยสูง
โดยภาพรวม
PG Slot เป็นตัวเลือกยอดนิยมสำหรับผู้ที่ต้องการเล่นสล็อตออนไลน์ ด้วยจุดเด่นด้าน กราฟิกคุณภาพ และการทำธุรกรรมที่ ไว ผู้เล่นสามารถเริ่มต้นได้ ทันที ฝากถอนสะดวก และเลือกเกมได้ หลากหลายแนว เหมาะสำหรับ ทั้งมือใหม่และมือโปร ในโลกของเกมสล็อตออนไลน์
ทดลองเล่นสล็อต pg ไม่ เด้ง
melbet сайт
Скачать приложение Melbet: APK, iOS и ПК
Мобильная версия Melbet объединяет букмекерскую контору и казино в едином приложении. Пользователю доступны live-ставки, слоты, прямые трансляции, аналитика и быстрые финансовые операции. Установка занимает несколько минут.
Android (APK)
Загрузите APK с официального источника, откройте файл и завершите установку. При необходимости включите доступ к установке сторонних приложений, затем авторизуйтесь.
iOS (iPhone)
Откройте App Store, найдите «Melbet», нажмите «Получить», после установки выполните вход.
ПК
Откройте официальный сайт, авторизуйтесь и добавьте ярлык на рабочий стол. Браузерная версия функционирует как отдельное приложение.
Функционал
Live-ставки с обновлением коэффициентов, игровой раздел с тысячами игр, прямые трансляции, подробная статистика, push-оповещения, быстрая регистрация и поддержка 24/7.
Бонусы
После загрузки доступны бонус на первый депозит, промокоды и бесплатные ставки. Правила начисления определяются регионом.
Безопасность
Загружайте только с официальных источников, проверяйте домен, не передавайте пароль третьим лицам и включите 2FA.
Установка занимает несколько минут, после чего открывается полный доступ Melbet.
мелбет казино скачать на айфон
Скачать Melbet: APK, iPhone и ПК
Мобильная версия Melbet включает ставки и казино в едином приложении. Пользователю доступны live-ставки, слоты, прямые трансляции, статистика и быстрые финансовые операции. Загрузка занимает 1–2 минуты.
Android (APK)
Скачайте APK с официального источника, запустите установщик и завершите установку. Если требуется включите доступ к установке сторонних приложений, затем авторизуйтесь.
iOS (iPhone)
Откройте App Store, найдите «Melbet», выберите «Получить», после установки выполните вход.
ПК
Откройте официальный сайт, авторизуйтесь и добавьте ярлык на рабочий стол. Браузерная версия функционирует как полноценное приложение.
Функционал
Live-ставки с мгновенным обновлением линии, казино и слоты, прямые трансляции, аналитические данные, push-оповещения, регистрация за минуту и круглосуточная служба поддержки.
Бонусы
После загрузки доступны бонус на первый депозит, промокоды и фрибеты. Условия зависят от региона.
Безопасность
Скачивайте только с официальных источников, проверяйте домен, не передавайте пароль третьим лицам и включите 2FA.
Установка занимает несколько минут, после чего доступен весь функционал Melbet.
bidik88
melbet букмекерская контора
Установить Melbet: APK, iPhone и ПК
Приложение Melbet включает букмекерскую контору и казино в едином приложении. Доступны live-ставки, казино-игры, прямые трансляции, статистика и операции по счёту. Загрузка занимает 1–2 минуты.
Android (APK)
Скачайте APK с официального источника, запустите установщик и завершите установку. Если требуется включите разрешение на установку из неизвестных источников, затем войдите в аккаунт.
iOS (iPhone)
Откройте App Store, введите в поиске «Melbet», нажмите «Получить», после установки выполните вход.
ПК
Откройте официальный сайт, авторизуйтесь и добавьте ярлык на рабочий стол. Веб-версия работает как отдельное приложение.
Функционал
Live-ставки с мгновенным обновлением линии, игровой раздел с тысячами игр, прямые трансляции, подробная статистика, уведомления о матчах, быстрая регистрация и круглосуточная служба поддержки.
Бонусы
После установки доступны бонус на первый депозит, промокоды и бесплатные ставки. Условия зависят от региона.
Безопасность
Скачивайте только с официального сайта, контролируйте адрес сайта, не передавайте пароль третьим лицам и активируйте двухфакторную аутентификацию.
Загрузка выполняется быстро, после чего доступен весь функционал Melbet.
ngl heapsofwin hits different fr fr lol the whole thing is lowkey smooth tbh, imo its way better than other stuff ive seen, no cap
https://www.wy881688.com/home.php?mod=space&uid=857783&do=profile
зеркало леон бет
joycasino
Way better than what I was using before honestly, the other site I had an account on was clunky and had all these random fees, but this one at 777bet is way more straightforward and dosent feel like they’re trying to nickle and dime you for everything.
рейтинг лучших казино
ipl live – legit. thats it thats the post.
slot online
I was skeptical about online three card rummy at first because I thought it’d be boring or buggy, but honestly it surpised me in a good way. The gameplay is smooth, the AI opponent isnt frustrating, and I’ve found myself going back to it more than I expected to.
… [Trackback]
[…] Find More on on that Topic: coinchapter.com/kusama-rallies-45-amid-parachain-slot-auction-is-it-the-right-time-to-buy-ksm/ […]