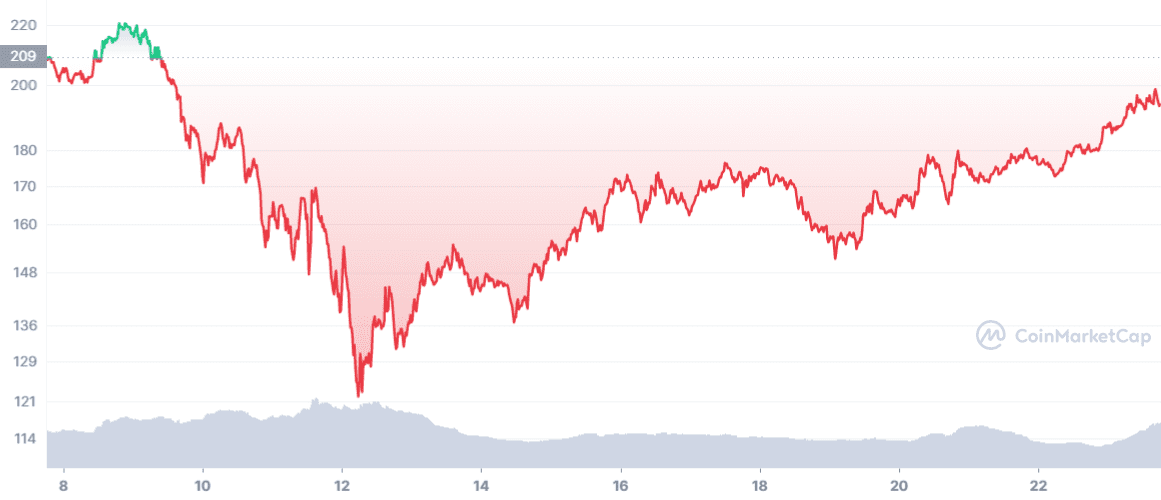
NEW DELHI (CoinChapter.com) — Privacy-centered cryptocurrency project Monero’s native token XMR’s prices jumped nearly 77% between May 12’s low ($113) and May 23’s high ($200) levels.
Furthermore, the XMR token is up by more than 16% between Monday’s low ($172) to May 23’s high ($200). Despite the uptrend, XMR prices still have some ground to recover their losses from the crypto hell-week sell-off in the week beginning May 9.
Moreover, the recent uptrend has made XMR primed for a trend reversal, with the token painting a bearish technical pattern called the rising wedge.
Two upwards sloping and converging trendlines, joining higher highs and higher lows, form the said structure. Declining trading volumes often accompany a breakdown below the pattern. The price target of the pattern is equal to the height of the back of the wedge.
Also Read: Monero (XMR) rebounds near the end of the crypto market’s most hellish week since 2020.As per the pattern, XMR prices might fall to somewhere between $149.3 to $140, losing nearly 23.3% to 28.3% from the current price level.

XMR’s relative strength index is skirting around overbought levels on the four-hour chart. An RSI above 70 indicates the market considers the token overvalued. Theoretically, that would mean a sell-off might be in the works for XMR.
At present, Monero’s RSI is technically neutral, with a value of 69.06 on the four-hour chart.
XMR’s MACD Remains Bullish
A sell-off might force XMR prices down to support from its 20-day exponential moving average (20-day EMA, red wave) near $182. A breach below the 20-day EMA might cause XMR prices to fall to $172.4, 10% below current prices.
$172.4 previously acted as resistance to Monero’s price action between May 10 and May 20. Finally, a sustained sell-off might push XMR prices to support at $158.5, near the falling wedge’s price target.

The momentum oscillator MACD continues to forecast a strengthening upward momentum for the XMR token. Moreover, XMR’s MACD trendlines charted a bullish crossover on May 20. Traders usually consider the pattern a buy signal.
Also Read: Cardano stumbles after weekend run sees ADA jump 30%.In addition, positive bars on the MACD histogram have been expanding, indicating that the MACD line (difference between 12-day and 26-day EMA) is moving away from the MACD signal line (9-day EMA of MACD).
If bulls continue to push XMR prices, the privacy token could rise to the resistance zone between the 200-day MA ($209.3; green wave) and the 50-day MA ($198.7; blue wave). If XMR prices break above the resistance zone, Monero might rise nearly 18% to reach $226 before correction pare prices.
At the time of writing, XMR was trading at $188.7, up 0.75% on the day.

… [Trackback]
[…] Read More Info here on that Topic: coinchapter.com/monero-faces-downside-risks-after-jumping-nearly-77-in-two-weeks/ […]
… [Trackback]
[…] Information to that Topic: coinchapter.com/monero-faces-downside-risks-after-jumping-nearly-77-in-two-weeks/ […]
… [Trackback]
[…] Read More on that Topic: coinchapter.com/monero-faces-downside-risks-after-jumping-nearly-77-in-two-weeks/ […]
… [Trackback]
[…] Find More here on that Topic: coinchapter.com/monero-faces-downside-risks-after-jumping-nearly-77-in-two-weeks/ […]
… [Trackback]
[…] Read More on to that Topic: coinchapter.com/monero-faces-downside-risks-after-jumping-nearly-77-in-two-weeks/ […]