
Key Takeaways:
- Meme token Pepecoin is down 81% from its May 5 ATH.
- Increasing Bitcoin dominance could spell doom for PEPE prices.

PATNA (CoinChapter.com) — Meme token Pepecoin, which led April’s memecoin frenzy, has formed a bullish technical pattern called the ‘Falling Wedge.‘
The technical pattern forms when the price fluctuates inside a pair of falling trendlines that would converge down the slope. The outcome of such downside patterns is typically a price breakout to the upside.
One key feature of the pattern is that volumes usually decline as the trendlines converge.
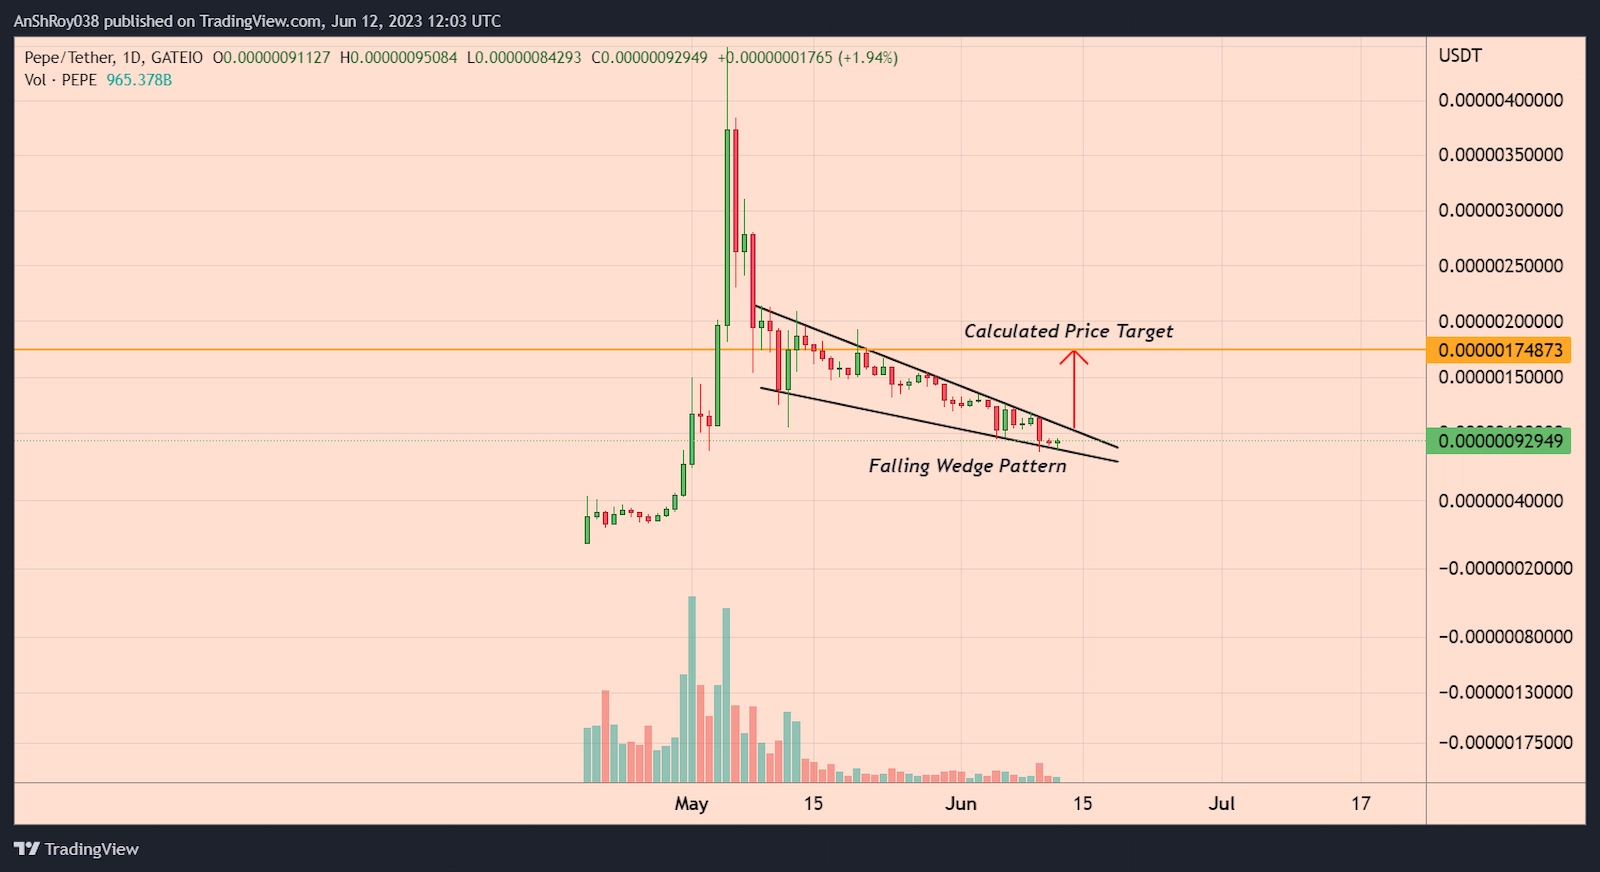
The upside target for the breakout is equal to the maximum distance between the falling wedge’s upper and lower trendlines. Thus, confirming the pattern could see the Pepecoin price rallying over 88% to $0.00000175.
However, assuming that the PEPE price breaks out, confirms the pattern, and reaches the calculated price target, the memecoin would still be down 61% from its ATH of $0.0000045.
Also Read: The Burisma bribery story: US President Joe Biden & his son Hunter received $10M from Ukraine gas company Moreover, Bitcoin’s (BTC) dominance, a metric that traders use to determine the performance of the altcoin market, is rising. Bitcoin dominance measures the ratio of the BTC market cap against the total crypto market cap.

Bitcoin dominance has been increasing despite BTC prices trending lower, suggesting that altcoins perform worse than BTC prices. As such, the market might soon become more bearish for altcoins, sparking a sell-off that the PEPE price might not survive.
The divergence between the Bitcoin dominance ratio (going up) and BTC price (going down) usually serves as a sell signal. With the PEPE price resting on the support line of the falling wedge, it seems likely the meme token would invalidate the wedge pattern.
PEPE Bulls Struggle To Hold Immediate Support
Meanwhile, zooming in on the four-hour (4H) charts shows PEPE struggling to hold on to the immediate support level near $0.0000008612. Failure of the immediate support level might result in the meme token dropping to its support level near $0.00000074.
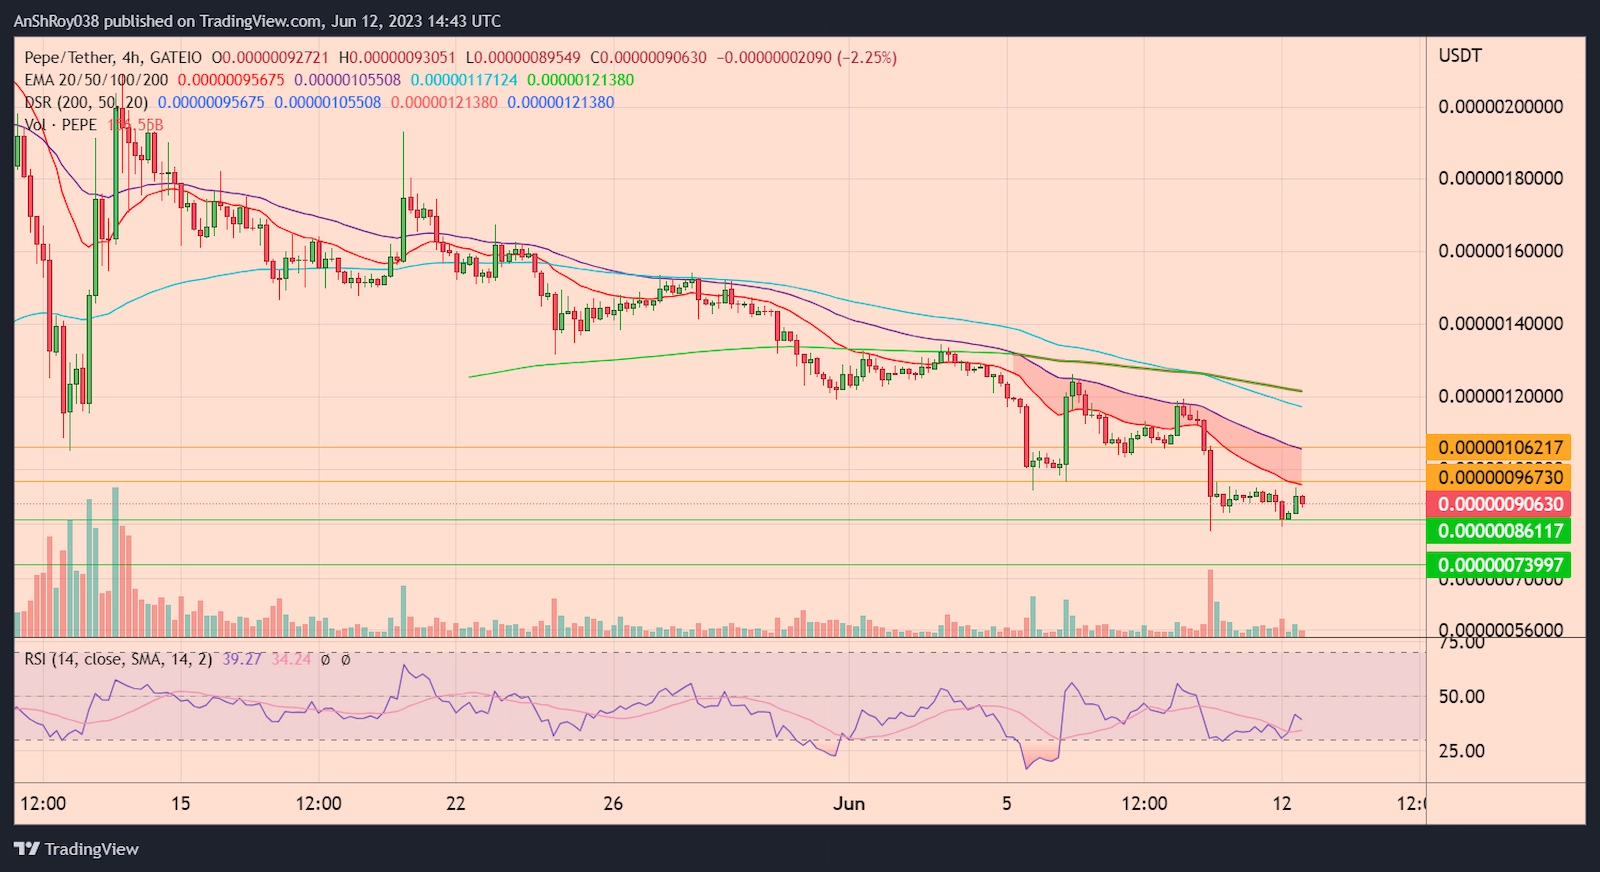
Conversely, an uptrend would require the PEPE price to cross above the 20-4H EMA (red wave) resistance near $0.00000097. Flipping the immediate resistance level could help the meme token target the 100-4H EMA (purple wave) resistance near $0.00000106 before downside corrections pare gains.
Meanwhile, the RSI for PEPE remained neutral, clocking at 39.27 on the four-hour chart.

… [Trackback]
[…] Here you can find 37712 more Info to that Topic: coinchapter.com/pepe-crashes-80-two-months-after-setting-record-highs/ […]
… [Trackback]
[…] Information on that Topic: coinchapter.com/pepe-crashes-80-two-months-after-setting-record-highs/ […]
… [Trackback]
[…] Read More Information here to that Topic: coinchapter.com/pepe-crashes-80-two-months-after-setting-record-highs/ […]
… [Trackback]
[…] Information on that Topic: coinchapter.com/pepe-crashes-80-two-months-after-setting-record-highs/ […]
… [Trackback]
[…] Read More on that Topic: coinchapter.com/pepe-crashes-80-two-months-after-setting-record-highs/ […]