
- Polkadot (DOT) extends prevailing bullish momentum on Wednesday amid a market-wide upside boom.
- The cryptocurrency’s uptrend remains capped by an upward sloping trendline acting as resistance.
- The price ceiling appears like a neckline of a bigger bullish technical setup, forming a potential inverse head and shoulder pattern.
- DOT/USD expects to undergo a breakout if it breaks above the structure.
Polkadot’s native cryptocurrency DOT established yet another record high on Wednesday, hitting roughly $32 this time. That pushed the digital asset’s cumulative gains up by almost 600 percent from its December 2020 nadir.
Meanwhile, DOT’s net market capitalization almost hit $28 billion, making it the fourth-largest cryptocurrency, falling just behind Tether’s stablecoin USDT.
Polkadot Fundamental Analysis
The latest spike in the Polkadot market coincided with similar upside moves elsewhere in the cryptocurrency space. On the whole, it was Bitcoin’s breakout above $51,000 that sparked alternative cryptocurrencies to tail the boom. So it appears, DOT/USD merely abided by the trend.
Nonetheless, Polkadot as a blockchain project was already a favorite among investors and traders alike. The protocol’s value grew exponentially after it introduced projects like Moonbeam and Acala, both focusing on interoperability with Ethereum.
In retrospect, Acala acts as as a Polkadot’s gateway into the decentralized finance (DeFi) sector. Meanwhile, Moonbeam is an Ethereum-compatible smart contract development toolkit.
Polkadot’s success story prompted Binance Labs, a startup incubation wing of the Binance exchange, to invest $2.4 million in Plasm Network, a smart contract platform build atop Polkadot’s blockchain. On the other hand, Manta Network closed a $1.1 million funding to create a DEX platform using Polkadot’s protocol.
That pushed the demand for DOT higher among investors and traders alike, causing a similar upside effect on its spot rates. Its volumes across exchanges surged to $700 million, the same as the one recorded by Chainlink and Litecoin.
Technical Setup: Breakout Anticipated
The latest DOT price action pushed it closer to testing its short-term ascending trendline resistance. Looking broadly, the trendline appears like a neckline of an inverse head and shoulder patter, confirmed by a three successive troughs with the middle one taller than the other two, which are shallower.
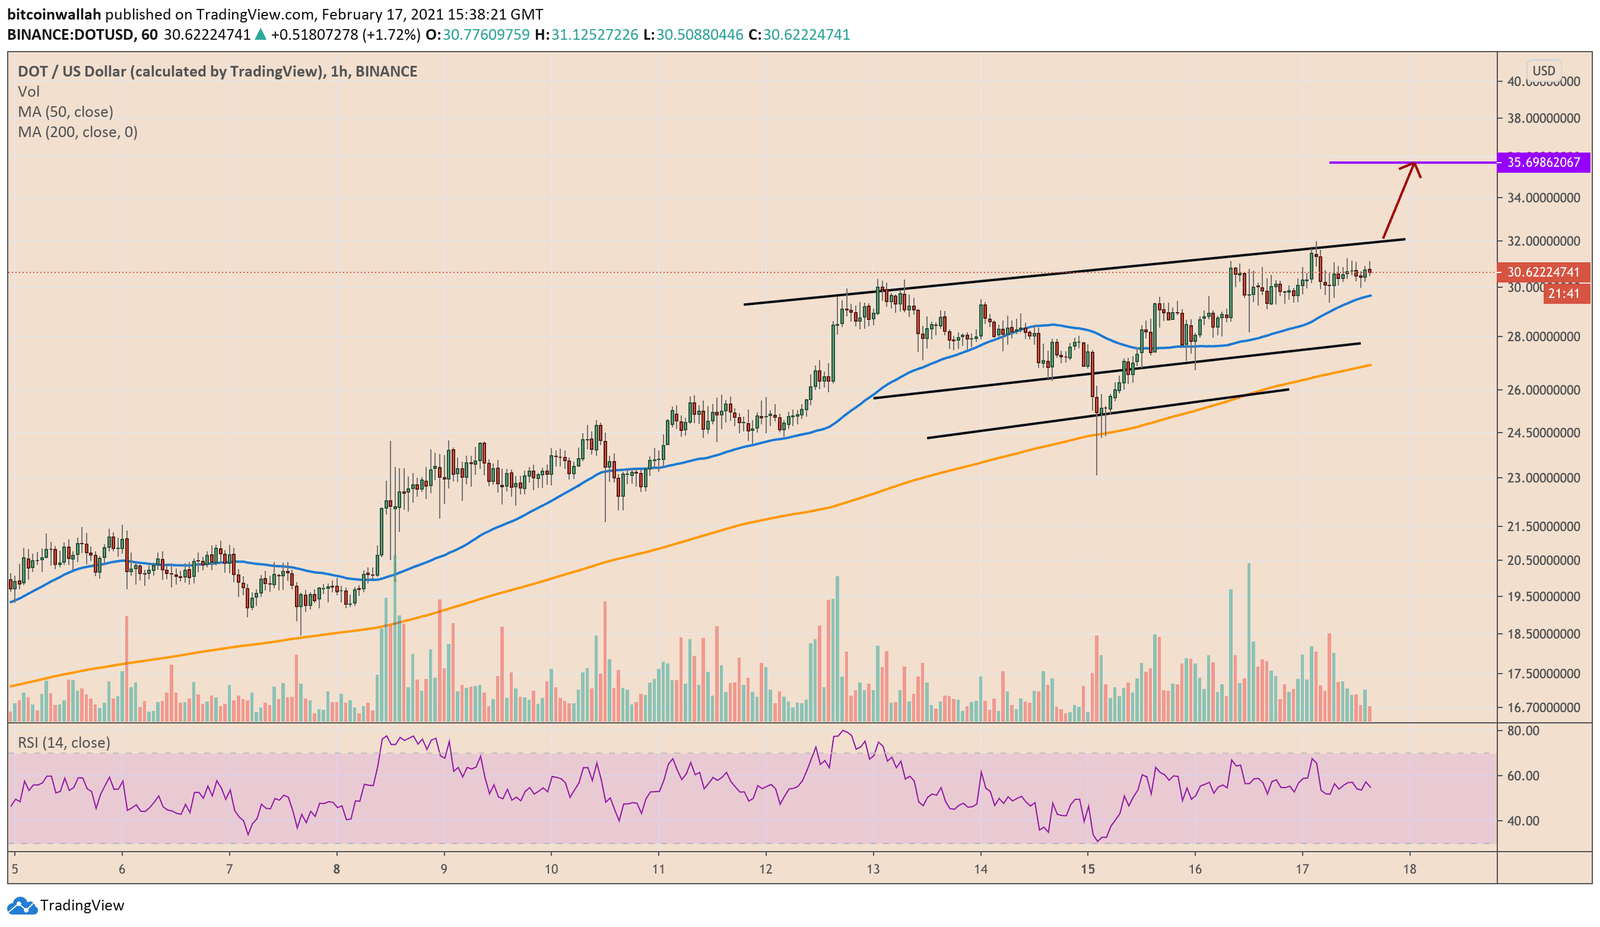
Typically, an asset breaks out bullish from an IH&S pattern. That means a successful close above the neckline resistance, accompanied by higher volume, and followed by a continuation move.
The price target in the IH&S pattern is equal to the distance between neckline and the middle trough’s bottom. That puts DOT en route to $35 in the short-term.

… [Trackback]
[…] Information to that Topic: coinchapter.com/polkadot-techinal-setup-put-dot-usd-en-route-to-35/ […]
… [Trackback]
[…] Information on that Topic: coinchapter.com/polkadot-techinal-setup-put-dot-usd-en-route-to-35/ […]
… [Trackback]
[…] Here you will find 49276 more Information to that Topic: coinchapter.com/polkadot-techinal-setup-put-dot-usd-en-route-to-35/ […]
… [Trackback]
[…] Find More here to that Topic: coinchapter.com/polkadot-techinal-setup-put-dot-usd-en-route-to-35/ […]