
- Technical analysis of the SAFEMOON 4h chart
- What’s in store for the token in the upcoming sessions?
- How is Safemoon protocol different from other tokens?
Yerevan (CoinChapter.com) – Safemoon, Decentralized Finance(DeFi) token, created on the Binance blockchain, traded at 0.00000331 against Tether USD Stablecoin (USDT) in the European session Monday.
The token formed in a descending triangle continuation pattern on the 4h chart. The horizontal support line assisted since late May, keeping Safemoon afloat. Since mid-June, the descending resistance line has proven its relevance, acting in confluence with two other trendlines at the 0.00000449 and 0.00000499 USDT price margins.
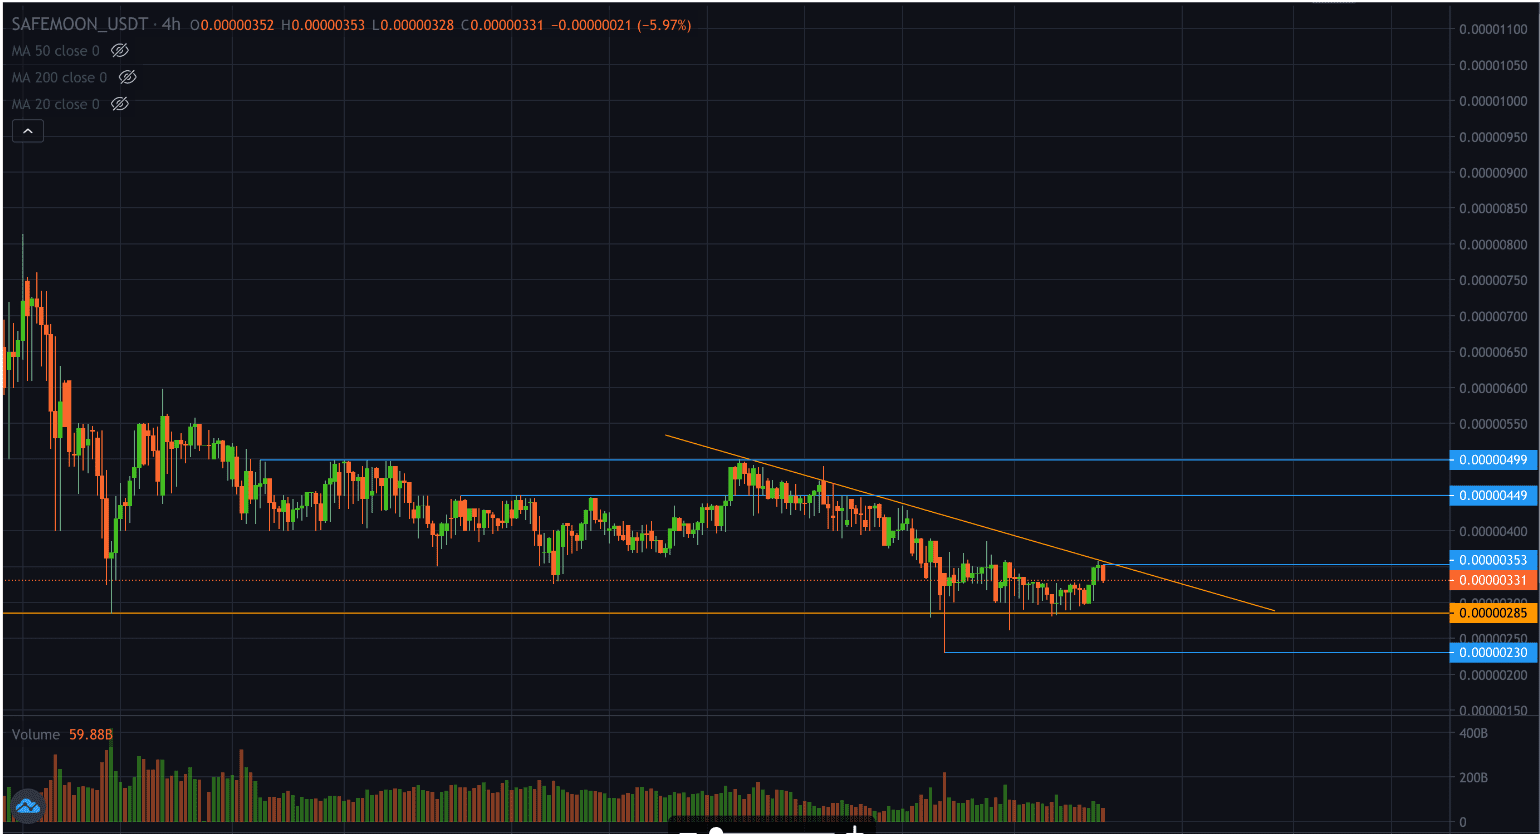
Safemoon consolidated after the May 19 market crash. It adopted no pronounced momentum vector since then. Hence, the descending triangle patterns can’t predict a continuation bias as of the moment. However, if the token stays in formation, it could face an additional 13 percent loss from the current 0.00000331 USDT and drop down to the lower horizontal trendline at 0.00000285 USDT.
Also read: Exit Scam Rumors Surround SafeMoon As Price Action Turns Bizarre
What to expect?
After SAFEMOON exhausts the descending triangle, both bullish and bearish outcomes could be valid. However, in case of further declines, the token has another life raft in store. The 0.00000230 line could provide additional support.
If Safemoon adopts a bullish bias, it could retest several resistance lines. The recently relevant 0.00000353 USDT margin, as well as the mentioned 0.00000449 and 0.00000499 values. The 50-4 hour simple moving average (SMA-50) also acted as resistance in the past few sessions.
In a spirited attempt to “pop-off” the price, Safemoon bulls organized a Reddit campaign, which miserably failed to do the trick on June 21. Moreover, the price fell by 25 percent. Unfortunately, Safemoon is still in the bottoming process, showing no strong vector at the moment.
Also read: Why Bitcoin is headed for a $10 trillion market cap within the next 5 years?
What’s Safemoon?
The rookie cryptocurrency was first introduced in March 2021. An explosive rally of 9,600 percent followed in April, bringing the price to the all-time high of 0.00001375 on April 21. It is not uncommon to see tokens flare-up in price right after launch, and often the price declines afterward. The rise and fall played out not only for Safemoon but for Internet Computer Protocol as well.
However, there is an uncommon detail about Safemoon. It has a selling penalty mechanism. In other words, buying the token is easier than selling it. The mechanism raised many eyebrows. Some Reddit users called Safemoon the “opposite of safe” and a clear scheme for inattentive traders.
Also read: What the Heck is SafeMoon and Why Its Price is Rocketing?
Despite the harsh opinions, the token held its price, albeit without a bullish incentive.
It traded in a descending triangle, which hinted at a further 13 percent loss in the upcoming sessions unless Safemoon breaks above the confluence of resistance. The latter consists of the descending trendline of the triangle, the SMA-50, and the 0.00000353, 0.00000449, and the 0.00000499 trendlines.

… [Trackback]
[…] Read More Information here to that Topic: coinchapter.com/safemoon-hits-troublesome-resistance-confluence-while-eyeing-13-decline/ […]
… [Trackback]
[…] There you can find 42604 more Information on that Topic: coinchapter.com/safemoon-hits-troublesome-resistance-confluence-while-eyeing-13-decline/ […]
… [Trackback]
[…] There you will find 64249 more Information on that Topic: coinchapter.com/safemoon-hits-troublesome-resistance-confluence-while-eyeing-13-decline/ […]
… [Trackback]
[…] Information to that Topic: coinchapter.com/safemoon-hits-troublesome-resistance-confluence-while-eyeing-13-decline/ […]
… [Trackback]
[…] Read More Info here on that Topic: coinchapter.com/safemoon-hits-troublesome-resistance-confluence-while-eyeing-13-decline/ […]