
Key Takeaways:
- Trust Wallet’s native token TWT jumped more than 83% in the week beginning Feb 28 before corrections pared gains.
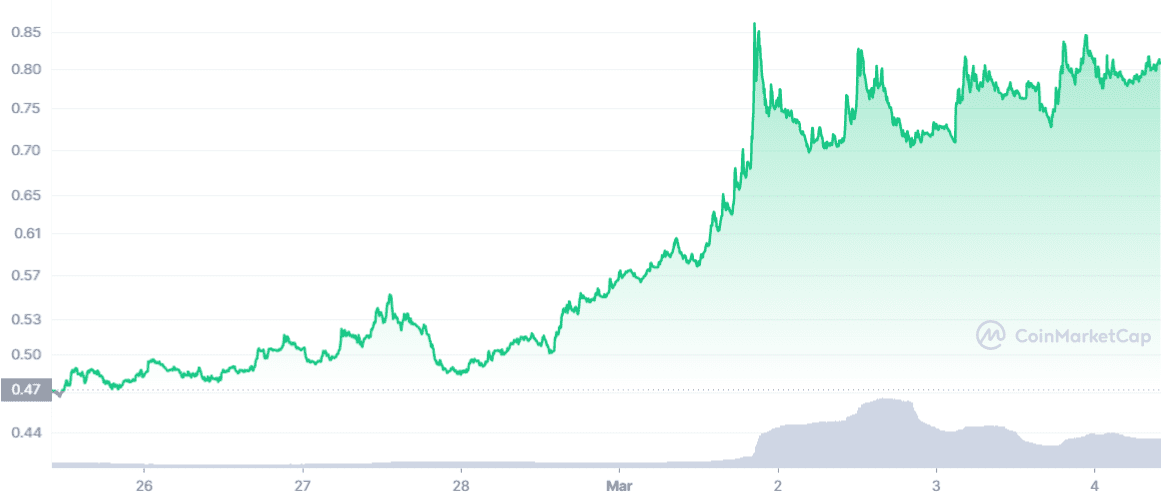
NEW DELHI (CoinChapter.com) — The Trust Wallet Token (TWT), a BEP-20 utility token that provides several benefits and incentives to Trust Wallet users, saw its prices rise by nearly 83% since Feb 28.
However, the massive uptrend attracted profit-seeking sentiments, resulting in a sell-off that pared gains. But, the Trust Wallet token is still up by nearly 74% on a week-to-day basis, going from Feb 26’s low of $0.478 to reach an intraday high of $0.829 on Mar 4.
The ongoing rally helped Trust Wallet break above a more than 3-months old descending trendline resistance on Feb 28. TWT had challenged the resistance multiple times since Nov, but the trendline rebuffed each attempt.
In addition, Trust Wallet moved above its 50-day (purple wave) and 100-day (yellow wave) moving average, making it bullish across the short-term and mid-term time horizons. However, the 200-day MA line continues to immediately resist the Trust Wallet token near the $0.877 price level.
Also Read: Cosmos defies the bloody trend as ATOM jumps 7% in 24 hours — what’s ahead?Once TWT moves above its 200-day MA resistance, Trust Wallet would then target resistance near $0.963 before moving to challenge resistance near $1.05. Meanwhile, TWT’s 26-day EMA (white wave) has moved above its 50-day MA (purple wave) to chart a golden cross on Mar 3.
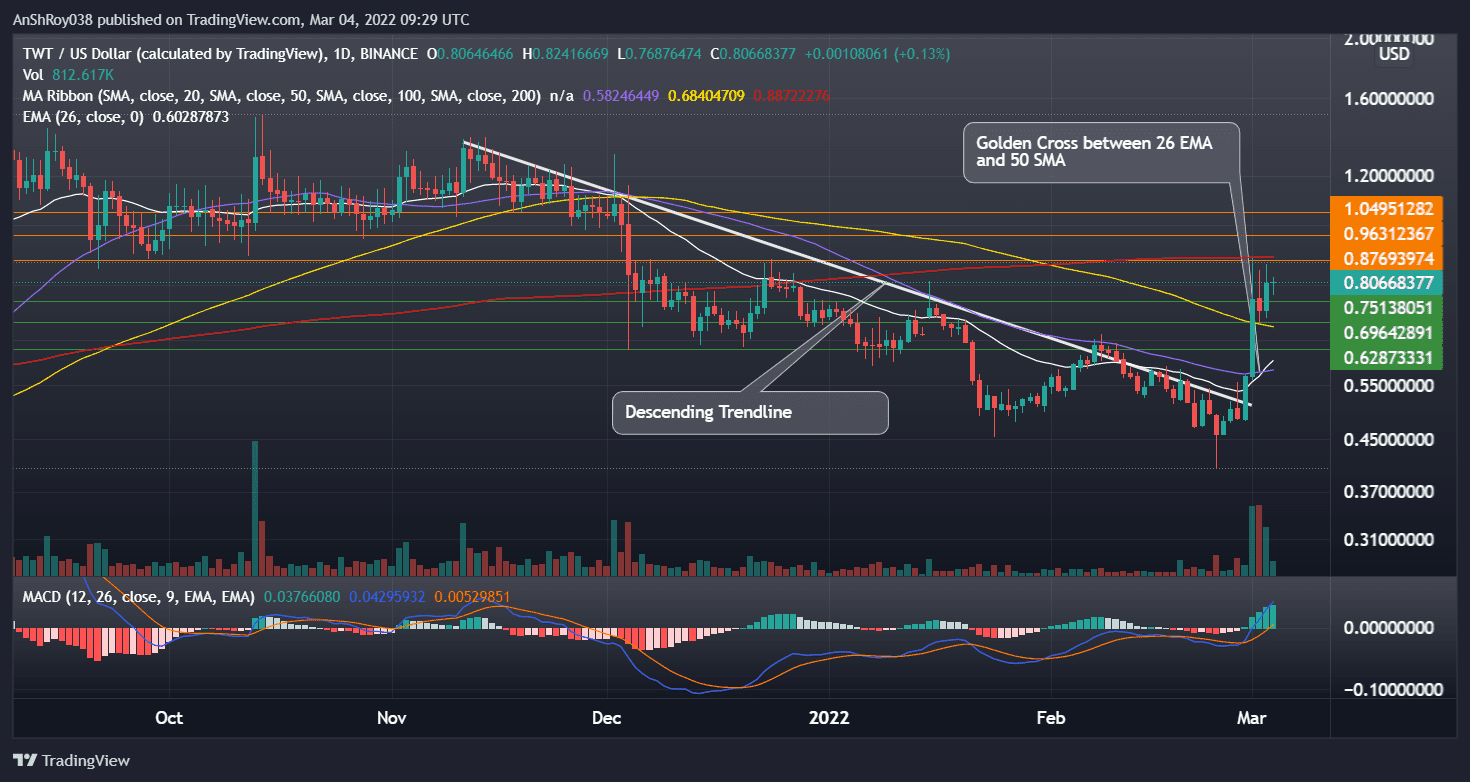
Traders often consider the technical pattern a buy signal. Meanwhile, momentum oscillator MACD continues to chart expanding bullish bars on the MACD histogram.
In detail, the histogram charts the difference between the MACD line (difference between 12-day and 26-day EMA) and the MACD signal line (9-day EMA of MACD). Expanding positive bars indicate increasing bullishness in the Trust Wallet token.
Trust Wallet Token’s RSI Hugging Overbought Borderline
The relative strength index for TWT has rebounded from the overbought border twice since Mar 1. Though the RSI is technically neutral at present, clocking 69.62 on the daily charts, the RSI is just a sliver away from becoming overbought.
Also Read: Blatant racism! OpenSea and MetaMask block Iranian users amid growing U.S. sanctions.To recap, traders often consider an overbought RSI as a bearish signal. An asset’s prices often undergo correction following an overbought RSI. If traders start selling after the RSI becomes overbought, TWT could seek support from $0.751.

Further price correction could see support from TWT’s 100-day MA line at $0.7 come into play. Finally, a sustained sell-off would likely pull prices down to $0.63 before a recovery rally begins.
At the time of writing, TWT was trading at $0.804, down 0.19% on the day.

… [Trackback]
[…] Find More on that Topic: coinchapter.com/selloff-risks-sustain-in-trust-wallet-market-even-as-twt-jumps-83-in-just-five-days/ […]
… [Trackback]
[…] Find More on that Topic: coinchapter.com/selloff-risks-sustain-in-trust-wallet-market-even-as-twt-jumps-83-in-just-five-days/ […]
… [Trackback]
[…] Read More here to that Topic: coinchapter.com/selloff-risks-sustain-in-trust-wallet-market-even-as-twt-jumps-83-in-just-five-days/ […]
… [Trackback]
[…] Find More on to that Topic: coinchapter.com/selloff-risks-sustain-in-trust-wallet-market-even-as-twt-jumps-83-in-just-five-days/ […]
… [Trackback]
[…] Find More on to that Topic: coinchapter.com/selloff-risks-sustain-in-trust-wallet-market-even-as-twt-jumps-83-in-just-five-days/ […]
… [Trackback]
[…] Find More Info here on that Topic: coinchapter.com/selloff-risks-sustain-in-trust-wallet-market-even-as-twt-jumps-83-in-just-five-days/ […]