
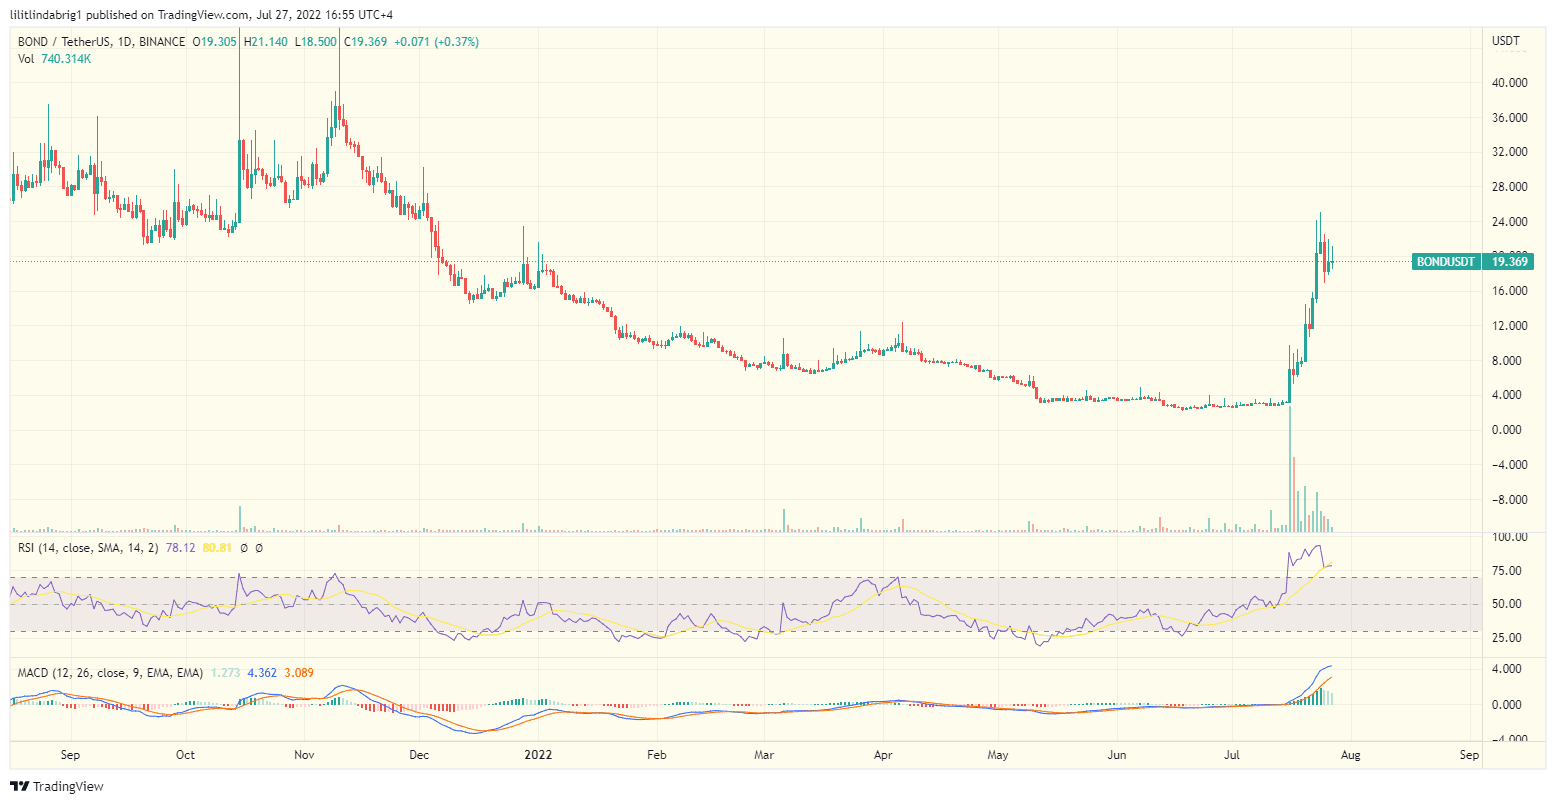
YEREVAN (CoinChapter.com) – BarnBridge crypto token BOND rallied 700% since July 16, briefly reaching a year-to-date high of $25 on July 23.
The rally has subsided since the token settled around $19 on July 27. BarnBridge is not a new player on the block, as it has been around since 2020. However, the latest rally had the community scratching their heads, given the overall bearish sentiment on the market.
BOND rallies 700%
Before the explosive rally, the token traded over 90% below its all-time high.
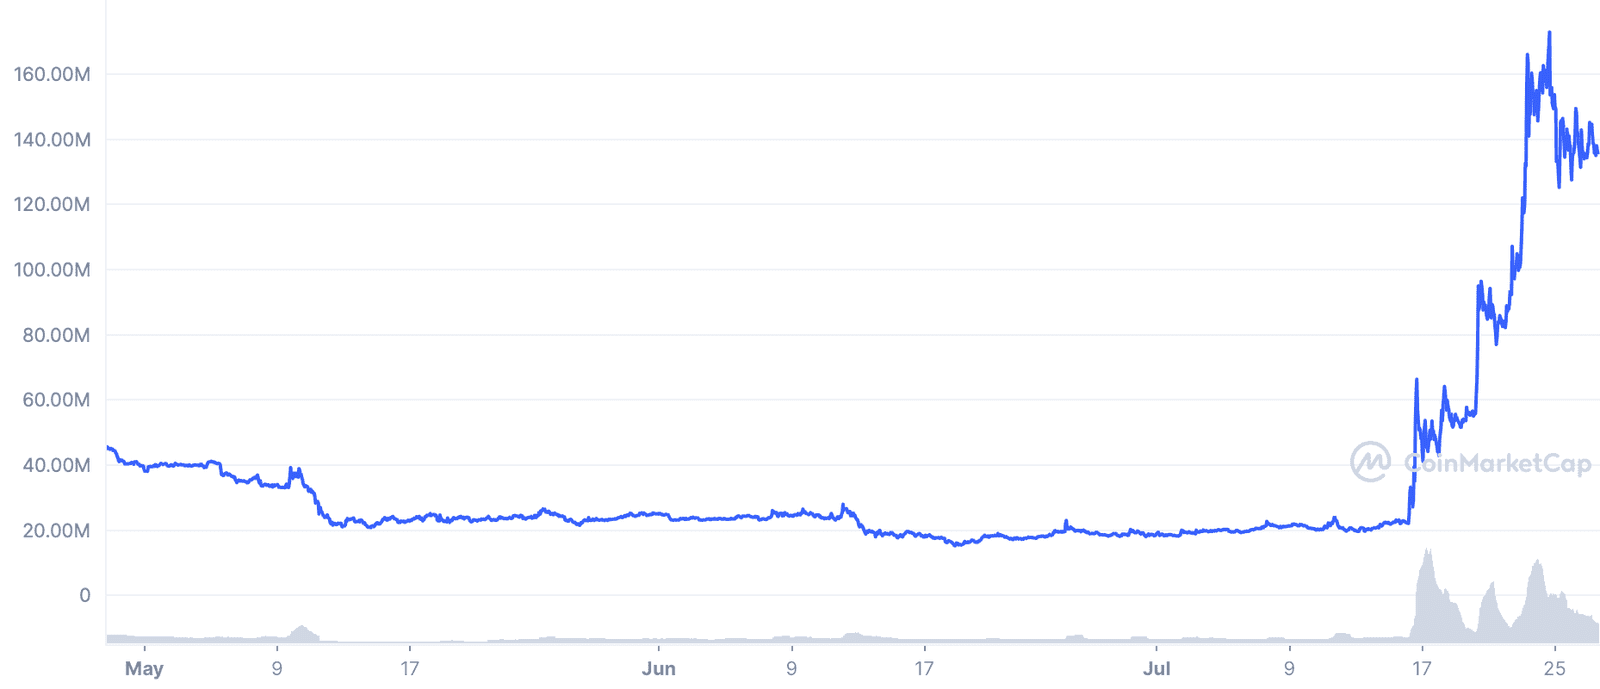
According to CoinMakretCap, BarnBridge’s market capitalization stood at just over $22.6 million on July 15. However, the rally added $131 million to that number, bringing the market cap to $153 million on July 24 and pumping BOND at least 100 ranking points.
Also read: Helium (HNT) price could drop 65% despite securing a $365M investment.
Additionally, BOND became one of the most-searched ERC-20 tokens in the week of July 18-25.
However, the total value locked (TVL) did not move much in the same period, staying around $3.3 million.

Why did BarnBridge surge?
Fundamental developments on the blockchain did not back the BarnBridge rally. Instead, the surge might have been a classic pump-and-dump, as it did not reflect a growing interest among investors, as evidenced by declining trading volumes.
In detail, the daily chart revealed a divergence between the price action vector and the trading volumes. BOND price shot up, while the trading volumes have declined since July 16. The deviation suggests a looming price dump.
Moreover, despite the reasonable release time, the project’s SMART Alpha epoch couldn’t have influenced the BOND price. The Project’s official Twitter handle advertised the SMART Alpha epoch on July 18.
SMART Alpha pools are two-sided, with users taking either a senior or junior position on a specific ERC-20-compatible asset, such as ETH, wrapped BTC, or UNI.
Also read: Bitcoin price risks massive dip below $20K amid FOMC rate hike scare.The SMART Alpha epoch was not the primary reason for BOND’s explosive rally. However, BarnBridge managed a whopping 700% surge in a bear market, albeit consolidating since July 25. As a result, BOND traded at approximately $19 on July 27 after what appears to be a pump-and-dump scenario.

… [Trackback]
[…] Info on that Topic: coinchapter.com/barnbridge-calm-after-bond-undergoes-a-700-rally-whats-next-for-this-defi-crypto/ […]
… [Trackback]
[…] Find More Information here to that Topic: coinchapter.com/barnbridge-calm-after-bond-undergoes-a-700-rally-whats-next-for-this-defi-crypto/ […]
… [Trackback]
[…] Read More on to that Topic: coinchapter.com/barnbridge-calm-after-bond-undergoes-a-700-rally-whats-next-for-this-defi-crypto/ […]
… [Trackback]
[…] Find More to that Topic: coinchapter.com/barnbridge-calm-after-bond-undergoes-a-700-rally-whats-next-for-this-defi-crypto/ […]