Key Takeaways:
- An analyst presented a Bitcoin chart, indicating that the alpha crypto is approaching the end of its bull cycle.
- Bitcoin lost over 48% since its all-time high on Nov 10, and still could lose more.
YEREVAN (CoinChapter.com) – Bitcoin (BTC) might soon face the end of its bull cycle, said Ki Young Ju, the founder and Chief Executive of the analytical platform CryptoQuant. The expert relied on a “classic indicator” dubbed the Market Value/Realized value, or MVRV Ratio.
The metric compares Bitcoin’s current Market Value to its ‘fair’ value. The latter is calculated using standard deviation, which pulls out the extremes in the data between Market Value and Realized Value.
In detail, the Market Value (MV) reflects the current price of Bitcoin multiplied by the number of coins in circulation.
Realized Value (RV) does not consider the current BTC price. Instead, RV takes the price of each Bitcoin when it was last moved, i.e., the last time it was sent from one wallet to another wallet. The indicator then adds up all those individual prices and calculates their average.
That average price, not the current price, is then multiplied by the total number of coins in circulation.
Also read: 4 Bitcoin indicators that show why BTC price won’t go back to $69K in 2022.
The price jumps and the MVRV spikes are correlated; thus, many analysts use MVRV to identify the bull market tops and bottoms. As Mr. Young Ju pointed out, the indicator stood at 1.50 on Jan 24, while the cycle bottom is typically at 1.0.
However, the analyst also asserted that MVRV’s bottoming at 1.0 or below does not mean Bitcoin will soar. Instead, it could still decline further as it did on multiple occasions in the past.
Even if MVRV reaches below 1, BTC price could go down more. Please don’t use this for margin trading.
Cyclic bottoms:
2020/03/12: 0.85 (-15% loss)
2018/12/14: 0.69 (-31% loss)
2015/01/14: 0.58 (-42% loss)
2012/02/18: 0.84 (-16% loss)
said the expert. Meanwhile Bitcoin…
… initiated a crypto sell-off wave that wiped out over $500 billion from the cryptocurrency market. The alpha coin not only crashed 48% since its all-time high of $69,000 on Nov 10 but dragged the altcoins into the bloodbath.
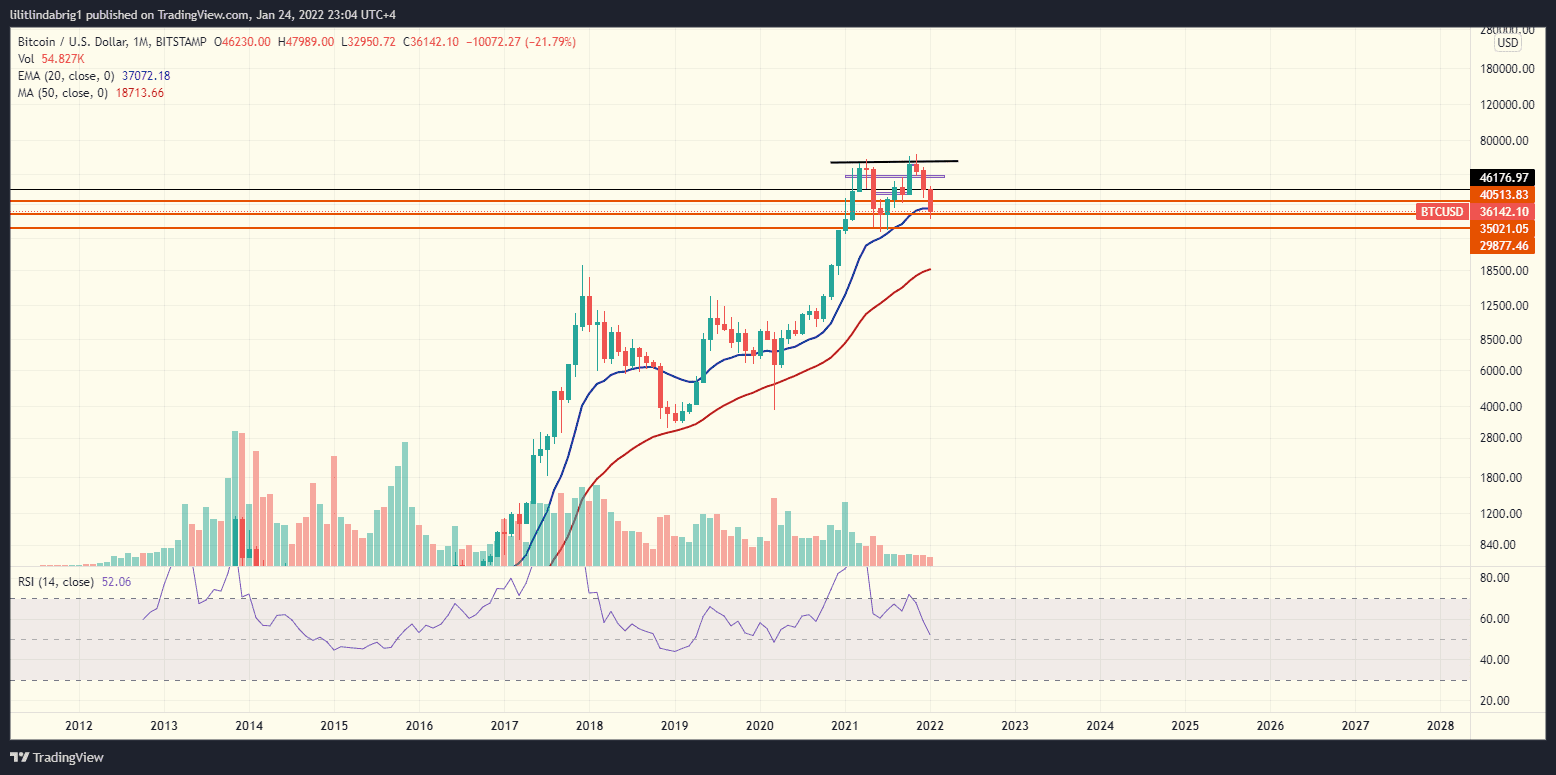
On Jan 24, Bitcoin held support at $35,000. The BTC/USD exchange rate stood at $35,597 in the New York session, after briefly dropping to a 7-month low of $32,950.

Also read: Will Fed rate hikes crash Bitcoin to $20K in 2022? Think again.
As CoinChapter suggested in a previous Bitcoin review, the leading cryptocurrency formed a Double Top setup on the monthly chart. The latter is a bearish formation that could take BTC lower than $35,000 in the upcoming months.

… [Trackback]
[…] There you can find 72618 more Info to that Topic: coinchapter.com/bitcoin-btc-ended-the-bull-cycle-mvrv-might-have-the-answer/ […]
… [Trackback]
[…] There you can find 95880 more Information on that Topic: coinchapter.com/bitcoin-btc-ended-the-bull-cycle-mvrv-might-have-the-answer/ […]
… [Trackback]
[…] Find More Info here to that Topic: coinchapter.com/bitcoin-btc-ended-the-bull-cycle-mvrv-might-have-the-answer/ […]