

- Upsides look limited for Cardano’s ADA.
- The coin is trading within a descending triangle formation and risks correcting by 10 – 15%.
Jaipur (CoinChapter.com) — Ever since the tide turned against ADA bulls after the crypto correction last month, upsides have been limited for Cardano’s native cryptocurrency token.
Cardano faces tough resistance
The ADA/USD pair has printed a series of lower highs for almost one and a half months. The coin has stayed firm above the multi-month $1 support. But an absence of significant buying pressure has kept it restricted within a descending triangle setup.
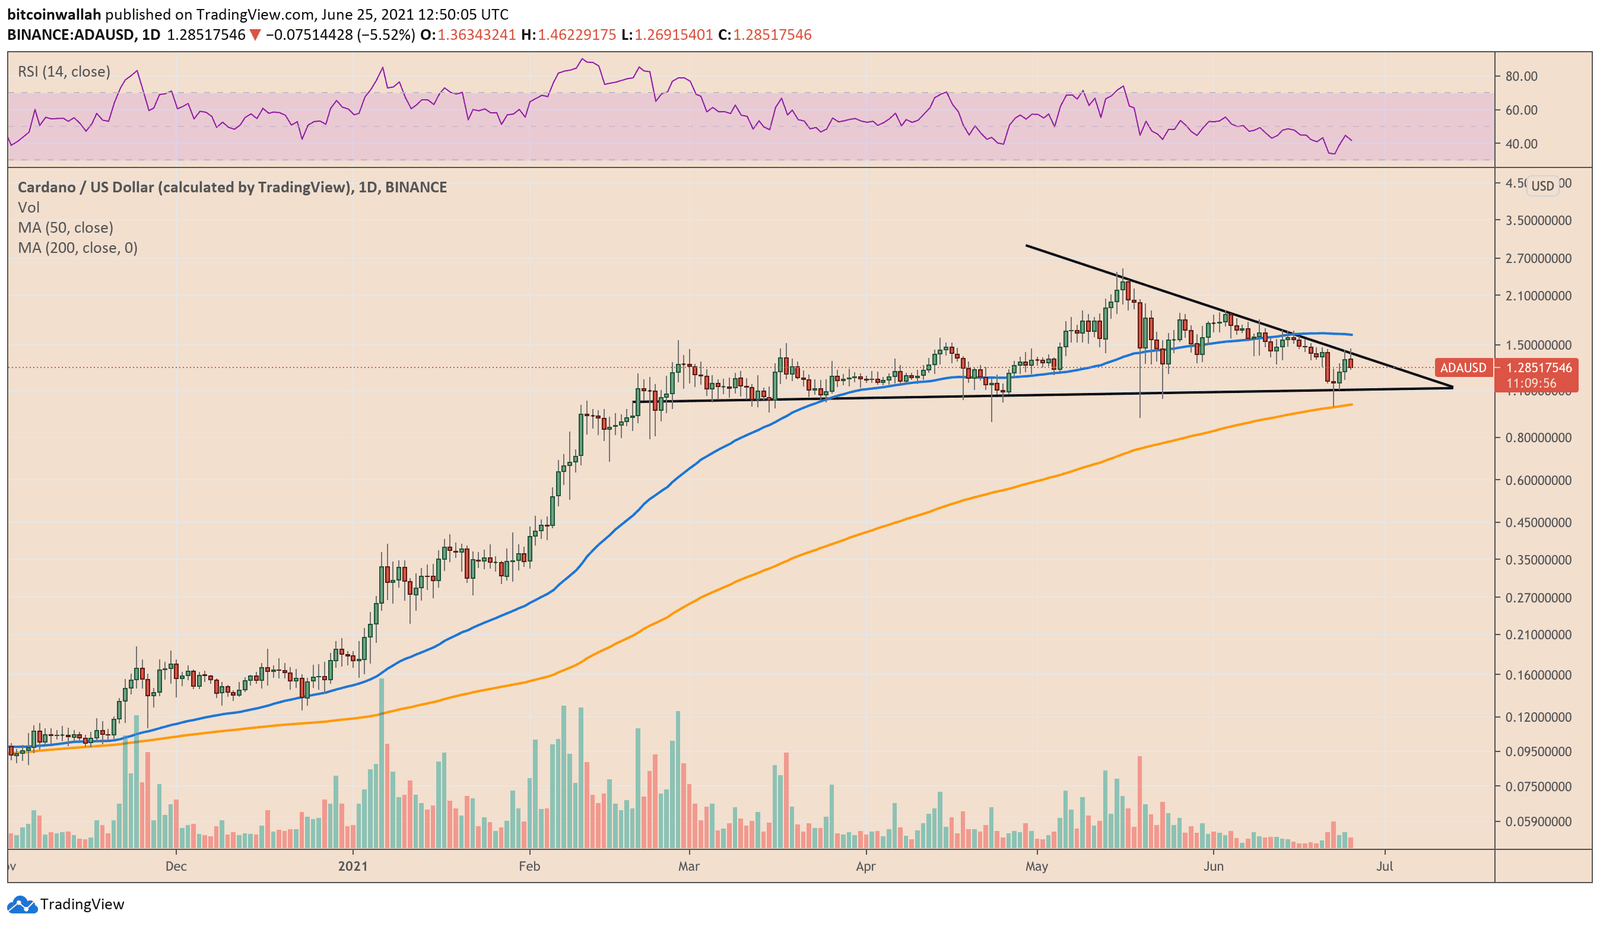
Buyers attempted a recovery after the recent price retracement on June 21. However, the momentum wasn’t enough for a full-blown breakout. All cryptocurrencies slipped down in unison, so this is nothing less than a snowball effect. ADA holds an 82% correlation with Bitcoin and copies almost all price moves of the benchmark cryptocurrency.
Due to the failure to surmount the multi-month trendline resistance, the token that underpins Cardano’s smart contract platform risks dropping significantly.
Also Read: Cardano’s ADA risks losing half its value if it breaks this support range
Decline Upto 15%
It’s not just about breaking past the descending triangle formation.
ADA/USD’s restricted trend beneath the 20-day exponential moving average (EMA) wave since the last 20 days also confirms that a dip is near. In the given scenario, the trading pair stands to retest the local support at $1.15, which acted as a launchpad for the recent recovery attempt. This would be a near 15% correction from the $1.35 top, flipped to resistance by bears.
Also Read: Cardano confers BTFD opportunity as ADA eyes 15% price crash
Any more selling pressure beyond that could result in the 5th largest crypto dropping all the way down to $1. The multi-month support also corresponds with the crucial 200-day moving average (MA) wave.
However, if the ADA/USD pair can maintain its strength above $1, bulls can still keep their hopes alive. The current bearish MACD (Moving Average Convergence Divergence) cycle seems on the verge of closing out. Intraday/swing traders could use this as an opportunity to prop prices back above the 20 EMA wave ($1.42).
For now, a decline is very much on the cards. Since the MACD bullish cycle on the 4-hour chart is nearing its end. Therefore, it’s recommended to either book profits or follow a wait-and-see approach to entering new buying positions.

… [Trackback]
[…] Here you will find 55758 more Info to that Topic: coinchapter.com/cardano-ada-could-face-significant-losses/ […]
… [Trackback]
[…] Read More to that Topic: coinchapter.com/cardano-ada-could-face-significant-losses/ […]
… [Trackback]
[…] Find More Info here on that Topic: coinchapter.com/cardano-ada-could-face-significant-losses/ […]
… [Trackback]
[…] Read More to that Topic: coinchapter.com/cardano-ada-could-face-significant-losses/ […]
… [Trackback]
[…] Find More on to that Topic: coinchapter.com/cardano-ada-could-face-significant-losses/ […]