
- A bearish rising wedge on the 4h chart might indicate a temporary setback in the bullish bias
- 1D chart looks much more optimistic, indicating an upcoming bullish phase ahead
- Greyscale investment also contributed to ADA’s bullish incentive
Yerevan (CoinChapter.com) – Cardano’s native token ADA hinted at a short-term bearish trend on the four-hour chart. However, the 1d chart paints a more optimistic picture. The graphs show wedges with an opposite vector.
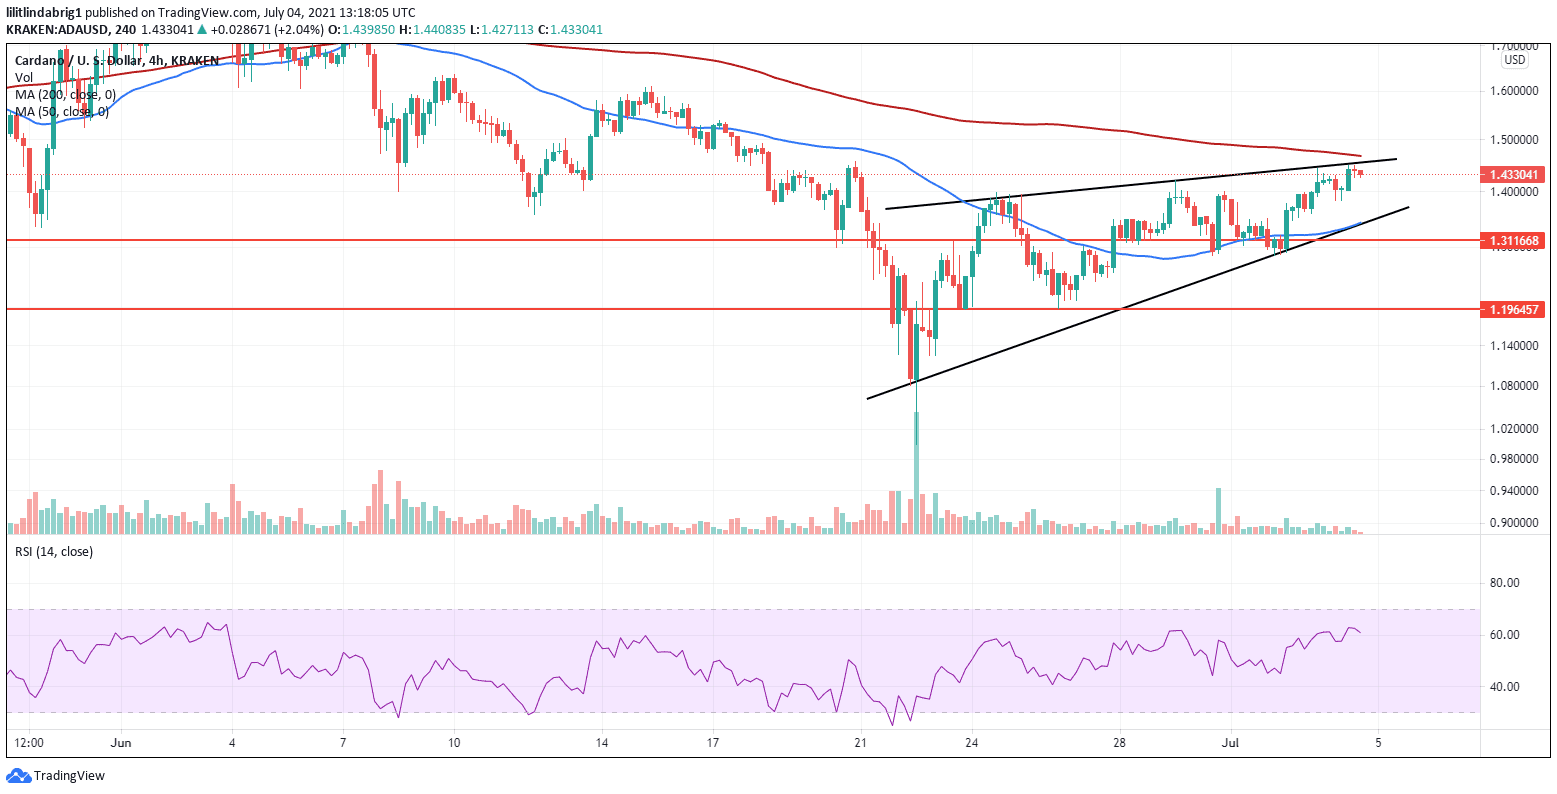
Cardano 4h chart
The token enjoyed a bullish week. The ADA/USD exchange rate stood at $1.43 in the European session, registering a 13 percent intraweek gain. However, ADA formed a rising wedge formation, a reversal pattern indicating a bearish phase ahead.
The lower trendline of the wedge supported the token since June 23, preventing sharp declines. However, the upper trendline has proven relevant on multiple occasions since June 25. Therefore, once ADA exhausts the wedge, it might shift its bias and take a short-term bearish route.
Also read: Bull market to Bitcoin: Wake me up when September ends
Bullish signs on the 1D chart
However, the prognosis looks increasingly optimistic on a larger scale of the 1D chart. ADA traded in a falling wedge throughout the past two months. The rising and falling wedges have opposite vectors and predict reverse outcomes. If the rising wedge on the four-hour chart indicates a bearish reversal, the falling wedge hints at a bullish phase ahead.
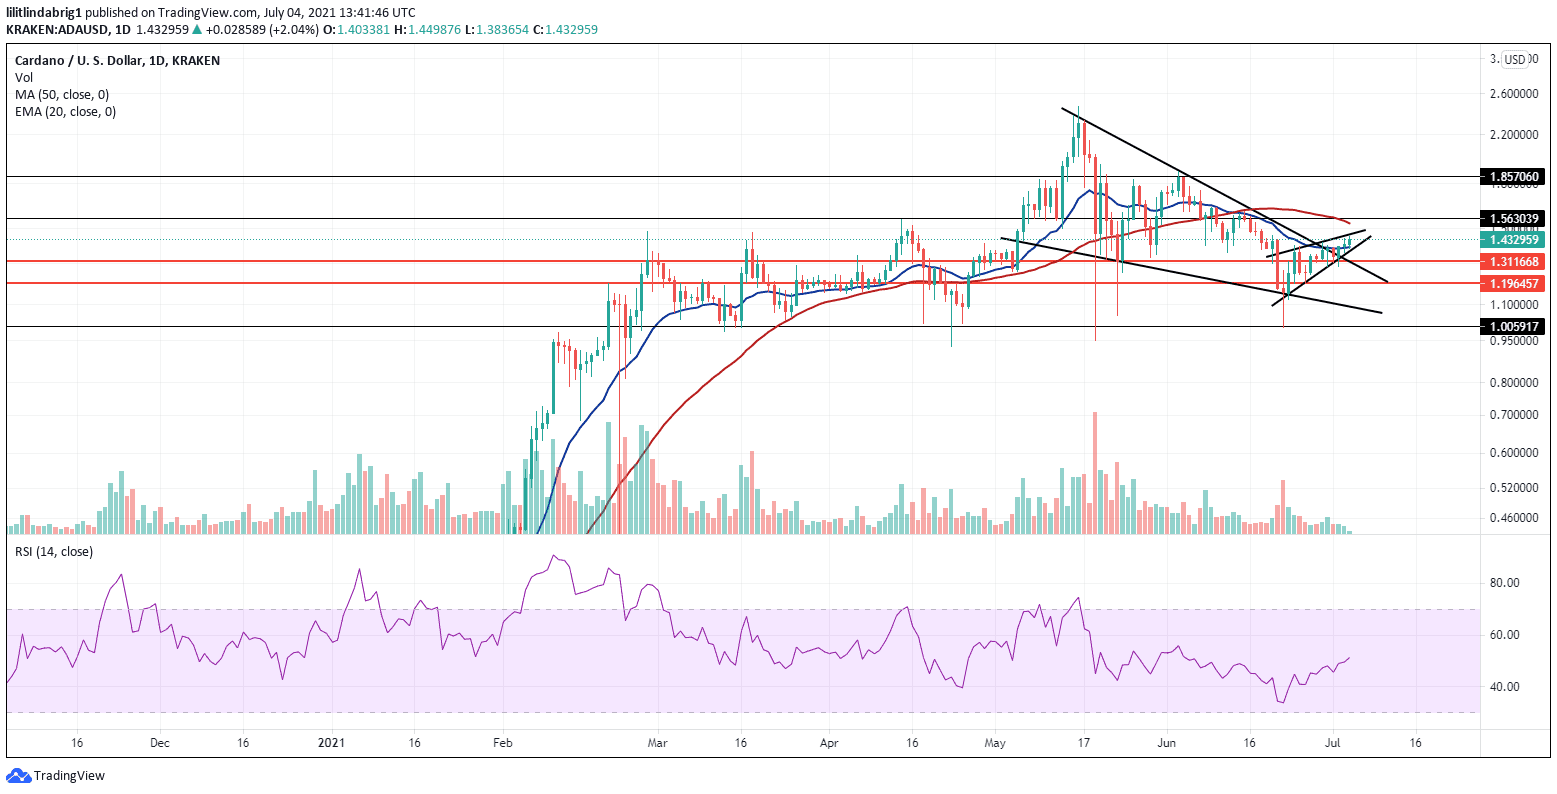
The small rising wedge is also indicated on the chart above. However, investigating the bigger perspective, the recent breakout from the falling wedge formation becomes evident. As a result, ADA managed to adopt a confident uptrend and broke the upper resistance trendline on July 2.
The two patterns can both fulfill themselves in the upcoming sessions. ADA could exhibit a bearish trend for a few sessions before retesting either red support lines in the chart above (at $1.19 and $1.31) and going bullish.
Moreover, the 20-day exponential moving average (EMA-20; blue wave) slightly corrected its course and hit at adopting an upward trajectory. However, if the bias continues, it could reach the 50-day moving average (MA-50; red wave), winning a golden cross for ADA.
In hindsight, a golden cross in a long-term bullish predictor occurs when a short-term MA crosses above a long-term MA.
Also read: Is Decentralized Finance (DeFi) the future, or a temp solution?
What else is driving ADA?
Greyscale Investments, a prominent cryptocurrency asset management company, added Cardano to its Digital Large Cap Fund. In addition, the company sold some existing constituents of the fund and used the proceeds to purchase ADA. The announcement of the portfolio adjustment came on Friday, pumping the ADA price even further by 11.7 percent. Edward McGee, the vice president of Greyscale Investments, commented on the development:
We are excited to welcome Cardano to our Digital Large Cap Fund’s portfolio as we work to ensure that our diversified Fund can safely hold assets that collectively comprise 70% of the entire digital asset market
said the VPThe news came at a reasonable time, giving ADA enough incentive to break out of the falling wedge formation. As a result, the 1D chart has a positive outlook for Cardano, albeit with a possible bearish setback.
Also read: ADA eyes significant pullback even as Cardano staking addresses cross 650K milestone.

… [Trackback]
[…] Here you will find 27955 additional Info to that Topic: coinchapter.com/cardano-flashes-conflicting-technicals-on-the-charts-whats-next-for-ada/ […]
… [Trackback]
[…] Read More to that Topic: coinchapter.com/cardano-flashes-conflicting-technicals-on-the-charts-whats-next-for-ada/ […]
… [Trackback]
[…] Information on that Topic: coinchapter.com/cardano-flashes-conflicting-technicals-on-the-charts-whats-next-for-ada/ […]
… [Trackback]
[…] There you will find 36262 more Information to that Topic: coinchapter.com/cardano-flashes-conflicting-technicals-on-the-charts-whats-next-for-ada/ […]