

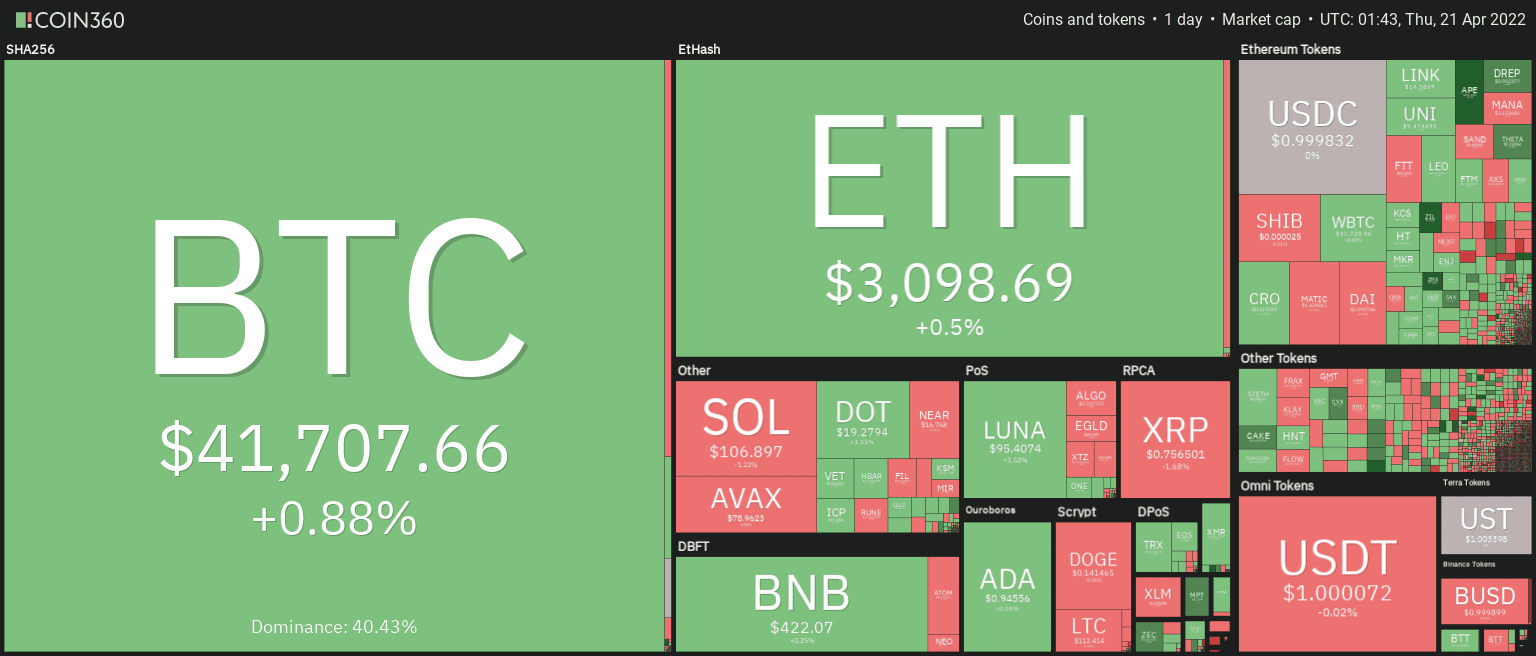
NEW DELHI (CoinChapter.com) — The wider crypto market recovered on Oct 5, following a late weekend rally that saw most cryptocurrencies register gains.
However, given the macroeconomic outlook, investors remain cautious of a pullback. Moreover, with Bitcoin (BTC) prices and Ethereum (ETH) prices hobbling above key support levels, confidence in the market remains low.
Several altcoins have registered consecutive gains in the current week.
1. RUNE/USD Price Chart
RUNE prices have been moving laterally over the past few days. The crypto token gained 6.5% on Oct 3 and continued moving upward on Tuesday. However, the 20-day EMA (red wave) continues to rebuff RUNE’s advances.
If RUNEUSD prices break above the 20-day EMA, the token will target resistance near $1.7 before moving to target resistance from its 50-day EMA (purple wave) near $1.83 before paring gains.
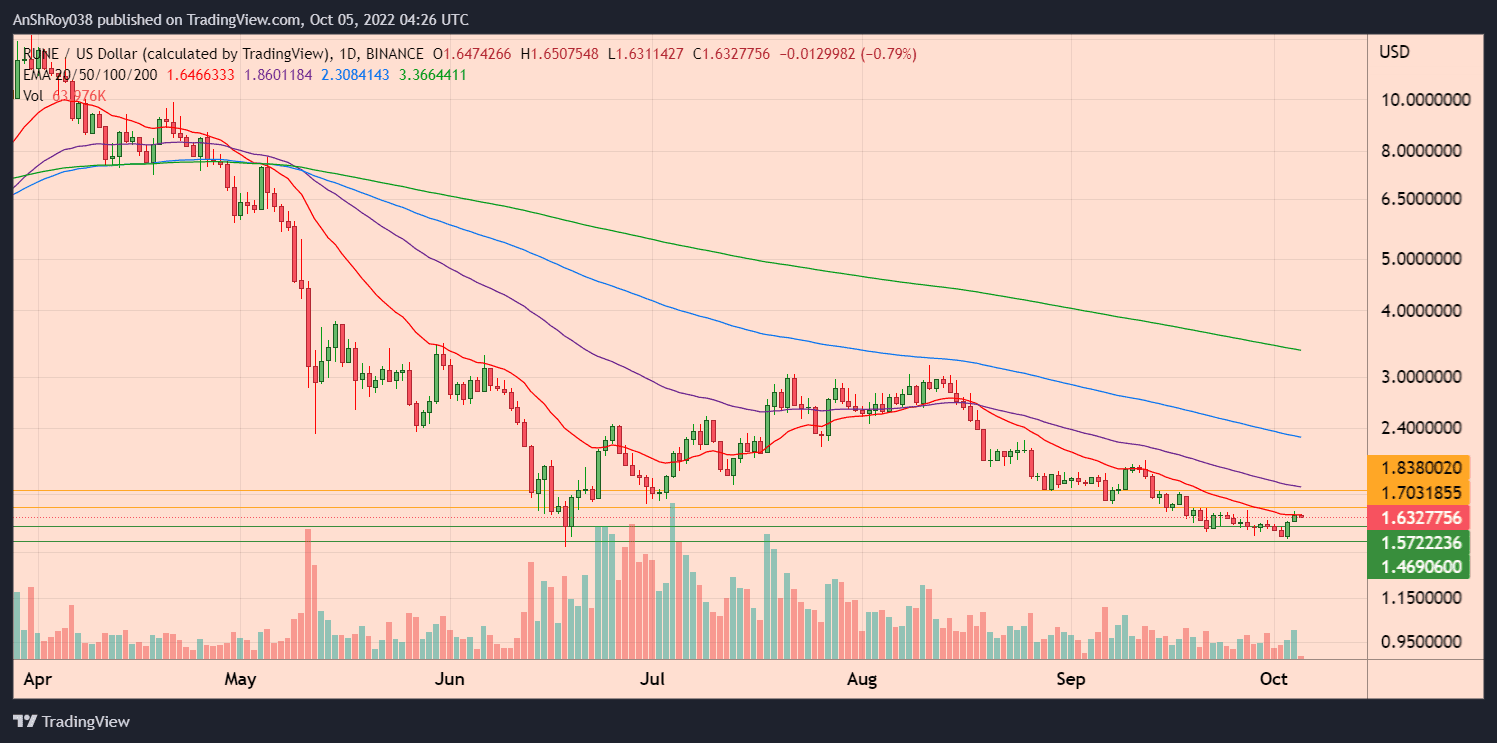
Conversely, RUNE prices remain susceptible to a sell-off, which would likely result in the token testing support near $1.57. If the bearish rally continues, RUNE prices would likely end up testing support near $1.5 before recovering.
At writing, RUNEUSD was trading at $1.64, up 2.5% on the day.
2. COTI/USD Price Today
COTI prices gained nearly 17% on Oct 3, with the rally coming on the back of a nearly two-week long rally. But, the jump made the crypto token’s relative strength index into the overbought regions, clocking at 70.61 on the daily charts.
Likely responding to the overbought RSI, COTI prices fell over 7% intraday on Tuesday. If a downtrend begins, the crypto token might fall to support near $0.119. A marketwide sell-off could result in the crypto token prices falling further and testing support near $0.113, testing ascending trendline support.
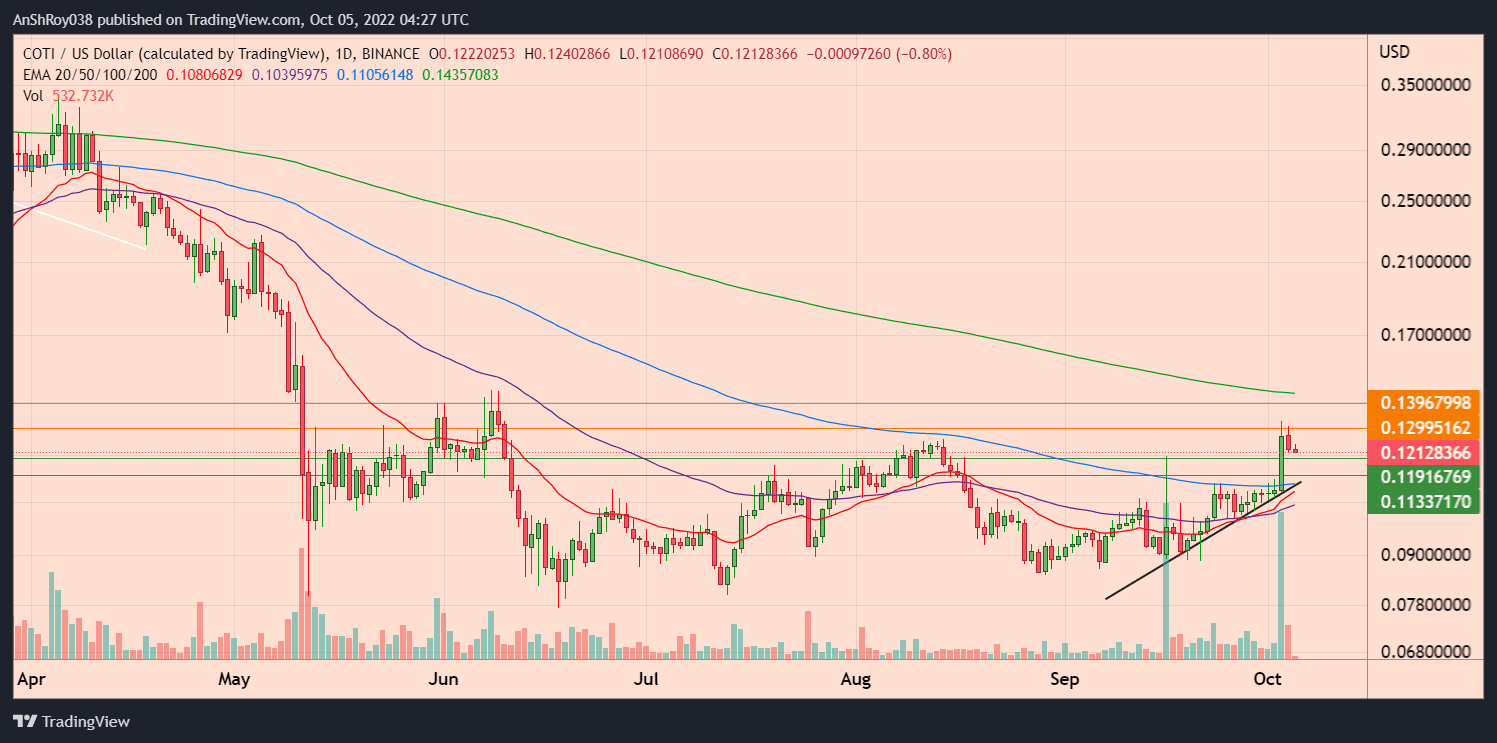
Conversely, if COTI prices start increasing again, the token needs to move above immediate resistance near $0.129 before targeting resistance near $0.14, near its 200-day EMA (green wave)
3. BAT/USD Crypto Price Today
The Basic Attention token painted a picture similar to other altcoins, rising consecutively since Oct 3. But, the crypto token is still struggling with breaking above immediate resistance near $0.315, where the 20-day EMA (red wave) acts as a dynamic resistance.
Also Read : A Smart Analysis Of Flasko (FLSK) Coin, Is It Worth Buying?Breaking above immediate resistance might provide BAT prices the momentum needed to challenge resistance from its 50-day EMA (purple wave) near $0.34 before retreating due to corrections.
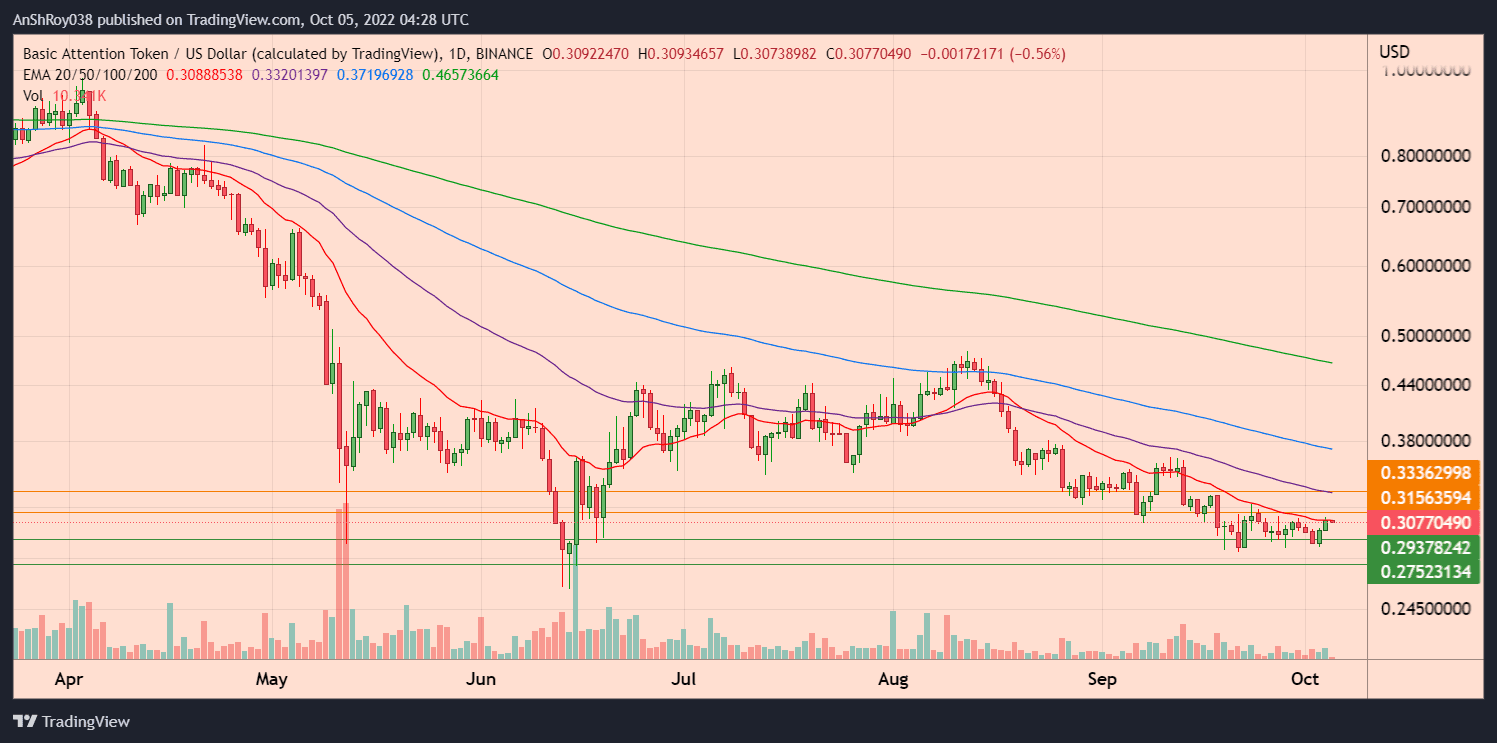
On the other hand, the crypto token prices might fall prey to sell-offs by traders looking for quick profits, pushing BAT prices to support near $0.294. A marketwide sell-off would likely see BAT prices fall to $0.275 before the token recovers.
4. QNT/USD Coin Price Chart
QNT’s price action has defied the overall crypto market downtrend. The crypto token has confirmed a bullish pattern called the rounding bottom. The pattern has a price target of $175.3, a jump of 42% from the rounding bottom’s neckline.
However, it seems traders have started selling to profit from QNT’s uptrend. As such, the token might fall to support near $139. On the other hand, if the downtrend continues, QNT prices will likely test support near $131 before recovering.

Another reason for the pullback might be QNT’s relative strength index becoming overbought. The RSI trendline reversed from overbought regions and is currently neutral with a value of 66.03.
However, if the uptrend restarts, QNT has immediate resistance near $149. Moving above immediate resistance would provide the crypto token with the momentum needed to target resistance near $158 before prices pull back.
5. LDO/USD Coin Price Today
Lido DAO’s native token LDO has been trending downwards since Aug 14, with the much hyped Ethereum Merge failing to start a rally for the crypto token.
Furthermore, LDO price action has been plagued with death crosses, with a fresh one forming between the crypto token’s 50-day EMA (purple wave) and 100-day EMA (blue wave) on the Gemini exchange.
Furthermore, the descending trendline resistance (black line) confluences with LDO’s 20-day EMA (red wave) to form a resistance confluence.

LDO prices need to break above the descending trendline resistance to challenge resistance from its 20-day EMA near $1.67. Afterward, the crypto token might target resistance near $1.86 before retreating.
Conversely, if LDO fails to start a bull run, the crypto token might fall to support near $1.47. Moreover, a marketwide sell-off could see LDO prices falling to $1.31 before recovering.
6. LUNC/USD Price Today
Terra Classic, the crypto token born in the aftermath of the LUNA-UST disaster, has been moving horizontally over the past few days. Even news of intensifying LUNC burns failed to rally LUNC prices.
After falling nearly 10% in the current week, LUNC prices have recovered slightly on Oct 5, with the token up 2.11% at writing. If the rally continues, LUNC prices might break above immediate resistance near $0.00033 before moving to target resistance near $0.00037.

On the other hand, LUNC has strong support from its 20-day EMA (red wave) near $0.0003. If immediate support fails, LUNC prices might end up testing support near $0.00027 before recovering.
7. UTK/USD Price Daily Chart
UTK prices registered a single-day gain of 31.26% on Oct 3, the crypto token’s highest since Aug 13 last year. However, the long wick on Monday’s daily candle, followed by the Oct 4’s bearish candle, indicates a strong presence of bears in the market.
Also Read: Dogecoin (DOGE) Price Just Signaled “Buy” And It’s Poised For More GainsUTK prices risk falling to support from its 50-day EMA (purple wave) near $0.116. Moreover, a marketwide sell-off might see the crypto token testing support below its 20-day EMA (red wave) near $0.11 before recovering.
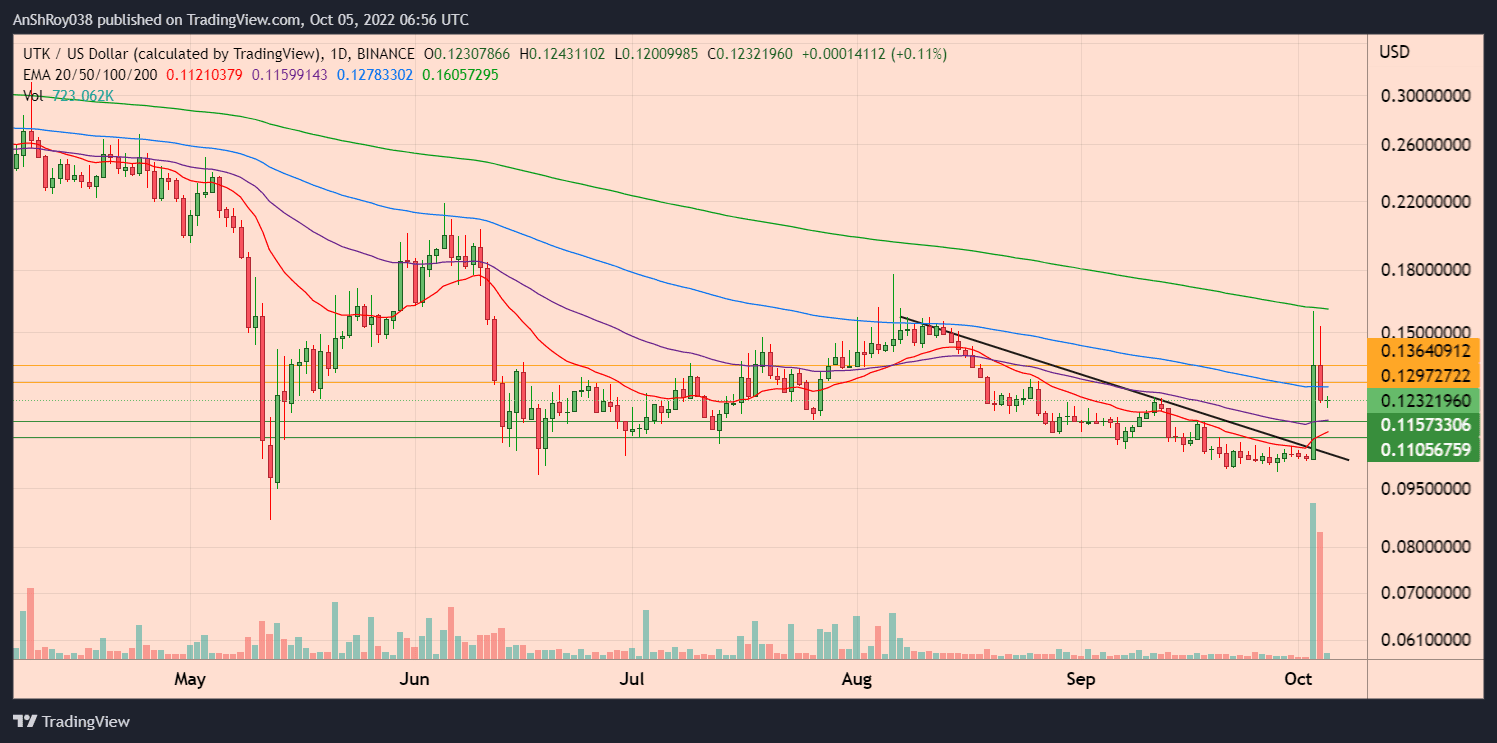
The recent uptrend helped UTK break above multi-week descending trendline resistance (black line). If UTK prices continue moving upward, the token would first target resistance from its 100-day EMA (blue wave) near $0.13.
Moving above immediate resistance might help UTK prices challenge resistance near $0.136 before retreating.
8. LINK/USD Price Daily Chart
LINK prices have been charting higher lows since Jun, indicating strong bullish momentum in the long term. LINK prices have immediate resistance near $8.06, which has resisted the token’s price action since Aug 18.
A move above the key resistance level might help LINK prices challenge resistance near $8.6 before retreating.

Conversely, if the rally stalls, LINK prices might fall to a support confluence of 20-day EMA (red wave) and 50-day EMA (purple wave) near $7.5. A marketwide sell-off might result in the crypto token testing support near $7 before recovering.
LINK’s recent price action suggests a downtrend might result in the token’s prices testing the ascending trendline support.
9. PYR/USD Coin Price Today
PYR prices have been trending upwards for a couple of weeks. However, PYR’s relative strength index might dampen the uptrend as it approaches the overbought threshold with a value of 64.59 on the daily charts.
Traders often consider an overbought RSI a sell signal. PYR prices might react to an overbought RSI and fall to immediate support near $3.9. However, the token has strong support coming from a confluence of 20-day EMA (red wave) and 50-day EMA (purple wave) near $3.6.

Meanwhile, PYR’s 20-day EMA seems poised to cross above its 50-day EMA (purple wave) to form a bullish pattern called the golden cross. Often considered a buy signal, the pattern might help PYR prices conquer resistance from its 100-day EMA (blue wave) near $4.25.
A sustained rally might see the crypto token challenge resistance near $4.6 before retreating.
Is Solana a poor investment option? Read more to find out.

Balanceadora
Equipos de equilibrado: esencial para el desempeño estable y productivo de las equipos.
En el entorno de la innovación moderna, donde la efectividad y la confiabilidad del sistema son de máxima significancia, los equipos de equilibrado tienen un función crucial. Estos aparatos específicos están concebidos para balancear y regular componentes móviles, ya sea en herramientas manufacturera, medios de transporte de traslado o incluso en equipos de uso diario.
Para los expertos en conservación de equipos y los ingenieros, trabajar con sistemas de balanceo es crucial para asegurar el rendimiento fluido y estable de cualquier mecanismo giratorio. Gracias a estas opciones modernas avanzadas, es posible minimizar significativamente las vibraciones, el zumbido y la carga sobre los rodamientos, mejorando la longevidad de elementos valiosos.
De igual manera relevante es el rol que tienen los aparatos de equilibrado en la asistencia al comprador. El ayuda experto y el mantenimiento regular aplicando estos dispositivos facilitan proporcionar servicios de gran excelencia, incrementando la bienestar de los clientes.
Para los titulares de negocios, la inversión en equipos de balanceo y sensores puede ser fundamental para mejorar la productividad y productividad de sus aparatos. Esto es especialmente importante para los dueños de negocios que manejan medianas y modestas organizaciones, donde cada punto es relevante.
Asimismo, los dispositivos de equilibrado tienen una gran implementación en el área de la seguridad y el gestión de nivel. Habilitan detectar posibles fallos, previniendo mantenimientos elevadas y averías a los sistemas. Incluso, los indicadores extraídos de estos aparatos pueden aplicarse para optimizar procesos y mejorar la visibilidad en sistemas de investigación.
Las zonas de utilización de los equipos de balanceo cubren diversas sectores, desde la elaboración de transporte personal hasta el monitoreo ecológico. No influye si se considera de importantes manufacturas productivas o limitados locales domésticos, los aparatos de balanceo son fundamentales para promover un funcionamiento eficiente y sin riesgo de fallos.
Balanset-1A – Tu companero para el equilibrado rapido en el campo
?Tambien te ha pasado que has tenido que detener la maquina durante dias solo para hacer el equilibrado de un rotor? Comprendemos tu frustracion. Por eso, hace tiempo buscamos una forma que permitiera seguir trabajando evitando interrupciones. Asi nacio el Balanset-1A, disenado desde el campo, para el campo.
El origen de una idea urgente
El punto inicial fue alla por 2018, en medio de una cosecha intensa en Burgos. Nuestro companero Javier, profesional comprometido con el trabajo en el campo, observo una y otra vez como los usuarios veian afectada su productividad por largos procesos de mantenimiento.
Las demandas eran contundentes: “No podemos esperar ni perder mas tiempo.”
Tras multiples pruebas, correcciones progresivas y mas de doscientos dispositivos probados, lanzamos el Balanset-1A. Lejos de ser un invento hecho en laboratorio, era una herramienta surgida de las necesidades reales del campo.
Equilibrar sin mover la maquina
Hace unos dias, en Cordoba, finalizamos el ajuste de una trilladora John Deere S680 en tan solo 35 minutos. Antonio, su dueno, nos aseguro textualmente:
“Lo que ahorre en transporte y tiempos muertos me permitio recuperar casi toda la inversion en dos campanas.”
Ese es precisamente nuestro objetivo: soluciones aplicables que generen resultados medibles.
?Que ofrece?
Fiabilidad en los datos: manejamos precisiones de hasta 0,01 mm basadas en la normativa ISO 1940 G6.3
Capacidad de resistencia demostrada: tanto bajo lluvia constante en Galicia como soportando calor intenso en Sevilla
Reduccion significativa de danos: los usuarios registran hasta un 70 % menos de fallas atribuidas a vibraciones irregulares
Casos que marcan la diferencia
En una cooperativa de Lleida, logramos impedir una detencion grave durante la epoca de recoleccion del maiz.
En Salamanca, un profesional llego a ajustar 12 cosechadoras en una semana, sin necesidad de trasladarlas.
Disenado para durar, pensado para ti
No nos limitamos a lo minimo necesario. Incorporamos detalles que facilitan el trabajo en el dia a dia.
Sensores magneticos extrafuertes aptos para superficies no uniformes
Software intuitivo con graficos visuales de vibracion
Bateria de larga autonomia: hasta 14 horas continuas de uso
Como afirma Maria, nuestra ingeniera especializada en el terreno:
“No vendemos aparatos bonitos. Vendemos tranquilidad y horas bien aprovechadas.”
?Por que elegirnos?
El 87 % de quienes usaron una vez este sistema vuelven a adquirirlo.
Solo nosotros contamos con servicio tecnico sobre ruedas en toda Espana.
La documentacion completa esta abierta y disponible para consulta directa.
Pruebalo por ti mismo
Te damos la oportunidad de evaluar el Balanset-1A en tu propiedad sin coste alguno durante tres dias.
Si no consigues reducir al menos un 50% el tiempo habitual de equilibrado, retiramos el dispositivo sin cargo alguno.
Y si decides quedartelo, te regalamos un completo diagnostico de tu maquinaria.
Porque creemos firmemente en lo que hacemos.
Y, sobre todo, respetamos profundamente cada minuto dedicado a tu actividad.
crochet crossbody bag
decomania
Voici un spin-tax de haute qualité pour votre texte en français, respectant toutes vos consignes :
Alors que Decomania analyse les innovations dans le domaine fintech, un doute subsiste : Quantum AI 2025 représente-t-il un progrès tangible ou uniquement un projet ambitieux ?
Mécanisme et Engagements : Quel est le Principe de Cette Plateforme ?
Quantum AI 2025 se définit comme un système de investissement algorithmique intégrant smart tech et quantum computing. Pour ses développeurs, cette technologie rendrait possible :
Une analyse avancée des marchés (cryptomonnaies, titres, devises).
Une gestion automatisée du risque pour maximiser les résultats.
Un accès simplifié, pensé pour les traders de différents niveaux.
Toutefois, aucune étude indépendante ne confirme officiellement ces affirmations, et les témoignages restent partagés.
Aspects à Examiner Selon Decomania
Notre analyse révèle divers facteurs à considérer avant de s’engager :
Plusieurs URLs géolocalisées (etc.) – Une pratique courante, mais qui peut compliquer le contrôle.
Manque de clarté – Des données techniques insuffisantes figurent sur les systèmes mis en œuvre.
Résultats divergents – Plusieurs investisseurs indiquent des résultats concluants, tandis qu’ plusieurs rapportent des difficultés techniques.
Conseils pour les Traders
Favoriser les plateformes régulées (AMF) pour plus de sécurité.
Essayer en version démonstration avant toute mise de fonds.
Mettre en parallèle avec d’autres solutions (telles que les systèmes disponibles par d’autres brokers réputés).
Bilan : Un Projet à Suivre avec Réserve
Quantum AI 2025 propose une méthode novatrice, mais ses résultats tangibles demandent toujours des confirmations pratiques. Dans l’attente de une meilleure visibilité, une méthode mesurée est conseillée.
Right now it appears like WordPress is thee best blogging platform available right
now. (from what I’ve read) Is that what you’re usding
on your blog?
mostbet casino
Mostbet Casino — zwięzła charakterystyka
Mostbet funkcjonuje na licencji Curacao i oferuje ponad 3000 gier oraz zakłady sportowe. Bonus powitalny wynosi 150% do 1400 zł, a wpłata startowa zaczyna się od 25 zł. Dostępne są płatności BLIK, karty, portfele cyfrowe i kryptowaluty. Wsparcie techniczne działa przez całą dobę w języku polskim.
Jak założyć konto w Mostbet
Rejestracja zajmuje 1,5–2 minuty. W formularzu należy wpisać:
numer komórkowy
adres poczty elektronicznej
hasło
walutę konta (PLN)
Na telefon przychodzi SMS z kodem, a na e-mail link do aktywacji konta. Po ich zatwierdzeniu profil zostaje aktywowany. Rejestracja może zostać wykonana także przez Facebook albo Google, co przyspiesza proces.
Dostęp do konta
Wejście do konta odbywa się przez e-mail lub telefon + hasło. Dostępna jest opcja funkcji zapamiętywania danych dla ułatwienia logowania na urządzeniach zaufanych.
Reset hasła i ochrona konta
Jeśli hasło zostanie zgubione, można je odzyskać dzięki opcji „Przywróć hasło” – link do zmiany trafia na adres e-mail użytkownika.
Mostbet używa weryfikacji dwuskładnikowej (2FA) przez SMS lub Google Authenticator, co zapobiega nieautoryzowanemu dostępowi do konta i depozytu.
tusuk88
Погрузитесь в мир азартных игр и испытайте удачу в игровой автомат mine drop, где каждый спин может стать выигрышным!
Важно заранее определиться с лимитами на ставки, чтобы избежать ненужных потерь.
Hello
https://zasvoih.ru/
мелбет ставки на спорт скачать на андроид
Melbet
обеспечивает
широкому выбору
линии до начала матчей
и ставок в реальном времени,
предлагающих
множество спортивных направлений
— от футбола и тенниса
до баскетбольных, хоккейных и киберспортивных лиг,
а также виртуальных турниров.
Помимо спорта,
игрокам доступны
игровые автоматы,
различные типы рулетки,
блэкджек
и интерактивные шоу-игры.
Новые пользователи могут получить
стартовый бонусный комплект,
который включает
повышенный первый депозит
и бесплатные вращения.
Это помогает начать с расширенным балансом
и расширить игровой опыт.
Для максимального удобства пользователей
Melbet предлагает
мобильные приложения,
операторов, доступных всегда,
а также
оперативные выплаты
в максимально короткое время.
В итоге сервис работает как единая экосистема
как для
спортивного беттинга,
так и для
онлайн-гейминга.
playboy888
Bonuses and rewards are commonly featured, enticing both newcomers and loyal players.
aviator game online offers an exciting experience and the opportunity to win real money directly from your device.
Success in the game hinges on the player’s ability to decide when to take their earnings prior to a multiplier collapse.
Discover a world of entertainment with 777bet casino, where unforgettable gaming moments and big wins await you!
The easy navigation allows users to swiftly locate their desired betting options.
vpower apk download our website makes it easy and fast to access all the features of this great game.
It incorporates advanced encryption methods to protect user data.
Spend a luxurious evening with good day 4 play login!
Incorporating play into our lives can lead to a happier and healthier society.
Immerse yourself in the world of exciting betting with astronaut aviator and try your luck!
This aspect of the game keeps players on the edge of their seats, adding to the overall enjoyment.
918kiss lama apk offers a convenient way to download the gambling application.
However, the 918kiss lama APK is designed with user protection in mind.
777bet online casino
By implementing state-of-the-art encryption technologies, 777bet secures all transactions and personal data.
Plai in aviator game login and experience the adrenaline rush with every bet!
The game encourages players to discuss their strategies and share their victories, fostering a sense of camaraderie.
Попробуйте свою удачу в aviator win и насладитесь уникальными возможностями!
Каждый пользователь может рассчитывать на захватывающие моменты и шанс выиграть крупные денежные призы.
Хотите найти российские драматические и боевики быстро и без ожиданий с профессиональной озвучкой? Просто загляните и получите доступ к всем сериям https://malosolka.fun/122024-skachat-pobediteli-serial-na-russkom-2025.html Победители 1 сезон русский сериал 2025 скачать торрент этого динамичного российского боевика с элементами драма, комедия. Версия полностью на русском, а скачать их можно без ожидания и регистрации. Для вашего комфорта предлагаются разные варианты качества от HD 720 и 1080p до UltraHD 4K, можно выбрать именно тот формат, который вам подходит. Выберите удобный способ просмотра, доступно на русском языке, без смс, без ожиданий и скрытых ограничений скачайте выбранный вариант и наслаждайтесь фильмом.
Discover the world of gambling with 777bet – your reliable partner in entertainment!
These bonuses give users more opportunities to increase their potential payouts.
Погрузитесь в захватывающий мир игры 1win авиатор и испытайте удачу прямо сейчас!
Стратегии игры в 1win aviator могут значительно повысить шансы на успех.
Immerse yourself in a captivating worldaeroplane game moneyand try your luck at flying your own plane!
Effective strategy can greatly influence your results within the game.
Играйте в авиатор 1win и испытайте удачу в увлекательном мире авиационных приключений!
Важно осознавать, что игра может быть связана с определенными рисками.
Try downloading the new version of 918kiss using 918kiss and enjoy the exciting gaming process!
If you’re searching for an engaging and safe online gaming experience, 918kiss is definitely worth considering.
Immerse yourself in a fascinating world aviator and experience your passion right now!
One of the key features of the aviator game is the multiplier system.
สล็อตเว็บตรง
เกมสล็อตออนไลน์ เกมยอดฮิต ในยุคปัจจุบัน.
ทุกวันนี้ สล็อต บนอินเทอร์เน็ต จัดเป็น หนึ่งในเกมที่ได้รับความนิยมสูงสุด ในตลาดเกมออนไลน์ ด้วย วิธีการเล่นที่ไม่ซับซ้อน ไม่ซับซ้อน และ สร้างความบันเทิงได้รวดเร็ว ทั้งผู้เล่นใหม่และผู้เล่นเดิม สล็อต ก็ยังตอบโจทย์ สำหรับการเล่นทั่วไป.
ทำไม สล็อต ถึงได้รับความนิยม .
เกมสล็อตออนไลน์ มีจุดเด่นหลายด้าน เช่น เข้าใจง่าย ไม่ยุ่งยาก, มีรูปแบบเกมหลากหลาย พร้อมกราฟิกทันสมัย, สามารถเริ่มต้นด้วยเงินน้อย และ มีโบนัส รวมถึงฟรีสปิน. ดังนั้น เกมสล็อต จึงกลายเป็น เกมอันดับต้น ๆ ของผู้เล่นจำนวนมาก.
ความหมายของ สล็อตเว็บตรง .
สล็อตเว็บตรง คือ การเล่นสล็อตผ่านเว็บผู้ให้บริการโดยตรง ไม่มีตัวกลาง ทำให้เกมทำงานได้อย่างราบรื่น. ข้อดีของสล็อตเว็บตรง ได้แก่ เข้าเกมได้ไว, ความปลอดภัยสูง, ผลเกมยุติธรรม และ มีสิทธิพิเศษเพิ่มเติม. นักเล่นส่วนใหญ่ นิยมเลือก สล็อตเว็บตรง เพื่อความมั่นใจ.
ทดลองเล่นสล็อต pg ก่อนเล่นจริง .
สำหรับผู้ที่ยังไม่ต้องการลงทุน สามารถเลือก ทดลองเล่น pg ก่อนตัดสินใจ โดยเป็นโหมดเดโม สามารถเล่นฟรี. การทดลองเล่น ทำให้ผู้เล่น เข้าใจรูปแบบเกม, รู้จักฟีเจอร์โบนัส และ สามารถประเมินความคุ้มค่า เหมาะสำหรับมือใหม่ รวมถึงผู้ที่ต้องการเปรียบเทียบสล็อต.
ทำไม pg slot ถึงเป็นที่นิยม .
pg slot คือเกมสล็อต จากผู้พัฒนา PG ที่ได้รับการยอมรับ ในตลาดสล็อต. ข้อดีของ PG Slot คือ ภาพสวย คมชัด, รองรับการเล่นบนมือถือ 100%, เกมไม่สะดุด และ ฟีเจอร์โบนัสหลากหลาย. จากคุณสมบัติเหล่านี้ pg slot จึงได้รับความนิยมอย่างต่อเนื่อง ในหลายประเทศ.
บทสรุปโดยรวม .
การเลือกเล่น เกมสล็อต ผ่าน สล็อตเว็บตรง ร่วมกับการใช้ ทดลองเล่นสล็อต pg และ รวมถึงเกมของ PG ช่วยให้ผู้เล่นได้รับประสบการณ์ที่ปลอดภัย สนุก และมีคุณภาพ เหมาะสำหรับการเล่นระยะยาว.
vpower apk download
Vpower APK is a popular application that has gained attention among users.
홍대가라오케
연산풀싸롱
Try your luck and enjoy the exciting game onswiminator slot, which will give you a sea of ??pleasure and bonuses.
Players should take the gamble feature with caution due to its high-risk nature.
Try your luck with jilispin and win a big prize today!
Players can take advantage of numerous bonuses and special promotions on jili spin.
Immerse yourself in the world of exciting games and big wins with spingo88 on spingo88!
As the gaming industry progresses, Spingo88 is well-positioned for future growth and innovation.
777 bet online casino and dive into the world of gambling with unique offers!
This platform provides a variety of games that cater to different tastes and preferences.
Check out our new game on alo789 com, to try your luck and win big prizes!
The selection includes games with various mechanics and appealing features suited to diverse audiences.
Immerse yourself in the world of excitement and winnings withcasino valor,where every spin brings pleasure and a chance to win a big jackpot.
The casino employs strict regulations and advanced technology to protect players and maintain integrity.
dark web drugs
Understanding the Dark Web and How to Access It
What the Dark Web Means
The darknet is a hidden part of the internet that cannot be opened through traditional browsers. When users search for what is dark web or dark web meaning, they usually refer to anonymous online networks that need dedicated software and use encryption to conceal identities. Most dark web sites operate on the .onion domain.
Unlike the public web, the dark web is not listed by Google or other standard search engines.
How to Access the Dark Web
To understand how to access dark web, users need a dedicated darknet browser.
The most widely used option is the Tor Browser:
Available via the Tor Browser download for Windows, macOS and Linux systems
Also available as Tor Browser for Android
Directs traffic through multiple encrypted nodes (onion-based routing)
For users on iOS devices, the Onion Browser is commonly used.
To access dark web safely, users often combine Tor with basic security practices and refrain from sharing personal data.
Dark Web Search Engines and Links
Since Google does not index the dark web, users rely on a dark web search engine such as:
Ahmia search
Torch dark web
Onion search
DuckDuckGo dark web (via Tor)
Directories like the Hidden Wiki directory provide collections of dark web links, but a significant number of links are outdated or unsafe.
Dark Web Markets and Risks
Darknet marketplaces are known for anonymous transactions, often using cryptocurrency. The most famous example is the Silk Road marketplace, which was shut down by authorities.
Topics like illegal goods and financial fraud have led to increased law enforcement attention. Many markets are scams or short-lived.
Monitoring the Dark Web for Data Leaks
Users often ask is my info on dark web. This has led to dark web monitoring, dark web scan, and dark web check services. These tools look for exposed emails, passwords, and financial information and may trigger a security alert if a data leak is detected.
Conclusion
The dark web is not entirely illegal, but it involves significant risks. Dark web websites are used both for anonymous communication and for criminal activity. Anyone accessing the dark web should understand the technology, legal boundaries, and security implications before proceeding.
Try your hand at online games on 125win slot and win big prizes!
125win focuses on delivering an exceptional user interface that is both clear and user-friendly.
Try your luck and win big in slotgpt casino!
The platform uses state-of-the-art encryption to protect user data.
Discover new opportunities with v blink, that will change the way you think about communication.
Vblink offers numerous settings for tailored user experiences.
Try your luck at an online casino spingo88 slot and enjoy exciting games.
The platform allows seamless connectivity with other popular tools.
Try your luck and win big withsurewin casino malaysia.
Regular players have access to continual promotional deals and cashback options.
Dive into the world of excitement with juwa slots 777 and win big!
This diversity ensures that every user finds games matching their preferences.
If you’re looking to place your bets securely and conveniently, try visiting arada bet login today.
Users are often impressed by the attractive odds offered by Arada Bet.
—
Arada Bet has quickly become a notable name in the world of online betting platforms.
Try your luck and win big withsurewin casino malaysia.
The casino attracts many with its rewarding bonus programs.
If you’re looking for an exciting challenge, try playing king thimbles game download today!
Today, modern versions include options made from plastic, leather, and even silicone for added comfort.
Dive into the thrilling world of online gambling with 1ace login and enjoy an unforgettable gaming experience!
1ace is especially remarkable for its adaptability.
entretenimiento saludable
Discover the excitement of online gaming with alpha66 live, your ultimate destination for thrilling slots and live action.
Ongoing studies aim to boost its performance further.
Discover the thrill of flying high with the exciting game aviator today!
Aviator is an online crash-style betting game with a straightforward concept.
купить тяговый аккумулятор
Experience thrilling wins every day at 777bet, your ultimate destination for online betting excitement.
Independent audits and strict licensing reinforce the integrity of 777bet’s services.
—
Players can enjoy slots, table games like blackjack and roulette, and progressive jackpots.
สล็อต
TKBNEKO เป็นแพลตฟอร์มเกมออนไลน์ ที่ วางระบบโดยยึดการใช้งานจริงของผู้เล่นเป็นแกนหลัก. หน้าเว็บหลัก แสดงเงื่อนไขแบบเป็นตัวเลขตั้งแต่แรก: ฝากขั้นต่ำ 1 บาท, ถอนขั้นต่ำ 1 บาท, เครดิตเข้าโดยเฉลี่ยราว 3 วินาที, และ ไม่จำกัดยอดถอน. ตัวเลขเหล่านี้กำหนดภาระของระบบโดยตรง เพราะเมื่อ ตั้งขั้นต่ำไว้ต่ำมาก ระบบต้อง รองรับธุรกรรมจำนวนมากขนาดเล็ก และต้อง ตัดยอดและเติมเครดิตแบบทันที. หาก เครดิตเข้าไม่ทันในไม่กี่วินาที ผู้ใช้จะ กดซ้ำ ทำให้เกิด รายการซ้อน และ ดันโหลดระบบขึ้นทันที.
การฝากผ่าน QR Code ตัดขั้นตอนการกรอกข้อมูลและการแนบสลิป. เมื่อผู้ใช้ สแกน ระบบจะรับสถานะธุรกรรมจากธนาคารผ่าน API. จากนั้น backend จะ จับคู่ธุรกรรมกับ user ID และ เติมเครดิตเข้า wallet. หาก API ตอบสนองช้า เครดิตจะ ไม่เข้าในเวลาที่ระบบบอก และผู้ใช้จะ ถือว่าระบบไม่เสถียร. ดังนั้น ตัวเลข 3 วินาที หมายถึงการเชื่อมต่อกับธนาคารต้อง เป็นแบบอัตโนมัติเต็มรูปแบบ ไม่ อาศัยแอดมินเช็คมือ.
การเชื่อมหลายช่องทางการจ่าย เช่น KBank, ธนาคารกรุงเทพ, KTB, กรุงศรี, Siam Commercial Bank, CIMB Thai รวมถึง ทรูมันนี่ วอลเล็ท ทำให้ระบบต้อง จัดการ webhook หลายแหล่ง. แต่ละเจ้าใช้ฟอร์แมตข้อมูลและความหน่วงต่างกัน. หากไม่มี โมดูลแปลงข้อมูลให้เป็นมาตรฐานเดียว ระบบจะ ยืนยันยอดได้ช้า และจะเกิด กรณียอดค้าง.
หมวดหมู่เกม ถูกแยกเป็น สล็อตออนไลน์, เกมสด, กีฬา และ เกมยิงปลา. การแยกหมวด ลดการค้นหาที่ต้องลากทั้งระบบ และ ควบคุมการส่งทราฟฟิกไปยังผู้ให้บริการแต่ละราย. เกมสล็อต มัก ทำงานผ่าน session API ส่วน เกมสด ใช้ สตรีมภาพแบบเรียลไทม์. หาก หลุดเซสชัน ผู้เล่นจะ หลุดจากโต๊ะทันที. ดังนั้นระบบต้องมี ตัวจัดการ session ที่ รักษาการเชื่อมต่อ และ ซิงค์เครดิตกับ provider ภายนอกตลอดเวลา. หาก ซิงค์พลาด เครดิตผู้เล่นกับผลเกมจะ ไม่ตรงกัน.
เกมที่ระบุว่า ใช้ลิขสิทธิ์จริง หมายถึงใช้ระบบ RNG และค่า RTP จากผู้พัฒนาโดยตรง. ผลลัพธ์แต่ละรอบถูก คำนวณจากฝั่ง provider ไม่ใช่จากฝั่งเว็บ. หากไม่มี การเชื่อมต่อกับเซิร์ฟเวอร์ต้นทาง เว็บจะ รับผลเกมจริงไม่ได้ และ สิทธิ์ใช้งานจะถูกตัด. การมี การรับรอง จึง ผูกกับการแลกเปลี่ยนข้อมูลระหว่างระบบ ไม่ใช่ แค่คำบนหน้าเว็บ.
ระบบถอนที่ ไม่มีจำกัด เชิงการสื่อสารยังต้องมีโมดูล risk control เช่น เช็คบัญชีซ้ำ, พฤติกรรมผิดปกติ, และ เงื่อนไขเทิร์นโอเวอร์. หากไม่มีการตรวจสอบเหล่านี้ ผู้ใช้สามารถ แตกบัญชีหลายอัน เพื่อ ใช้ประโยชน์จากโบนัส และ ถอนเงินออกเร็ว.
เมนู โปรโมชั่น VIP พันธมิตร ติดต่อเรา และข้อเสนอแนะ เชื่อมกับ ระบบ CRM และ ฐานข้อมูลผู้เล่น. ส่วน Affiliate ใช้เก็บ referrer code เพื่อ คิดคอมมิชชั่น. หากไม่มีระบบนี้ จะ ติดตามแหล่งที่มาของผู้ใช้ไม่ได้. ฟอร์มข้อเสนอแนะ ใช้เก็บ error จริงจากผู้ใช้. หากไม่มีข้อมูลนี้ ปัญหา latency หรือ การใช้งาน จะ ถูกแก้ช้า.
โครงสร้างทั้งหมด เชื่อมกันเป็นสายเดียว: ธนาคารส่งสถานะเข้า backend, backend อัปเดต wallet แล้ว ซิงค์ไปยัง provider. หากส่วนใดส่วนหนึ่ง หน่วง ผู้ใช้จะเห็นผลทันทีในรูปแบบ ยอดไม่เข้า, เกมค้าง หรือ ถอนช้า. ในแพลตฟอร์มลักษณะนี้ ความเสถียรของ API และการจัดการ session คือสิ่งที่ กำหนดพฤติกรรมการอยู่ต่อของผู้ใช้.
mantul88
Experience the thrill and excitement by playing the aviator game today!
With a mix of strategy, luck, and player skills, the game ensures an engaging experience.
ทดลองเล่นสล็อต pg
แพลตฟอร์ม TKBNEKO มอบ พื้นที่ออนไลน์ที่ทันสมัย ซึ่ง ผู้ใช้งาน สามารถ ทดลองใช้งาน โลกแห่งเกมและความบันเทิง รวมถึง การเดิมพันที่ทำกำไรได้อย่างรวดเร็ว เว็บไซต์นี้ สร้างภาพลักษณ์ว่าเป็นสถานที่ที่ทุกคนสามารถกลายเป็นเจ้าของธุรกิจได้ เนื่องจาก ออกแบบมาให้เข้าถึงได้ทุกกลุ่มผู้เล่น
หนึ่งใน ฟีเจอร์หลัก ของแพลตฟอร์มนี้คือ ระบบการเงิน ซึ่งมีขั้นต่ำในการเติมเงินเพียง 1 บาท และขั้นต่ำในการถอนเงินก็เช่นเดียวกันที่ 1 บาท เท่านั้น กระบวนการเติมเงินใช้เวลาเพียง 3 วินาที ทำให้แพลตฟอร์มนี้ รองรับธุรกรรมฉับไว นอกจากนี้ยัง เปิดให้ถอนได้ไม่จำกัดจำนวน ซึ่งเป็น ปัจจัยสำคัญที่สร้างความแตกต่าง
สำหรับการเติมเงิน สมาชิกสามารถสแกน QR Code เพื่อโอนเงิน ซึ่งเป็นระบบที่ ลดขั้นตอนที่ซับซ้อน
แพลตฟอร์มนี้มีเกมให้เลือก หลายแนวให้เล่น เช่น สล็อต, คาสิโนสด, Sports Betting และ เกมยิงปลาออนไลน์ ผู้เล่นสามารถดูรายชื่อเกมทั้งหมดได้ผ่านตัวกรอง “ครบทุกเกม” ซึ่งช่วยให้ ค้นหาเกมที่ต้องการได้ง่ายขึ้น
TKBNEKO เน้นย้ำถึงความสำคัญของเกมที่มีลิขสิทธิ์ถูกต้องและการเล่นที่ยุติธรรม โดยร่วมมือกับ ค่ายเกมชั้นนำที่ได้รับใบอนุญาต ซึ่งช่วยให้มั่นใจได้ว่า การเล่นมีความยุติธรรมและตรวจสอบได้
TKBNEKO ได้ผสานระบบการชำระเงินเข้ากับ ธนาคารชั้นนำของประเทศไทย เช่น Krungthai Bank, Bangkok Bank, SCB, Kasikorn Bank, Thanachart Bank, GSB, TrueMoney Wallet, Citibank, UOB และ BAAC ทำให้การทำธุรกรรมทางการเงิน รวดเร็วและปลอดภัยยิ่งกว่าเดิม
กล่าวโดยรวม TKBNEKO คือแพลตฟอร์มที่ ออกแบบมาเพื่อความสะดวกของผู้เล่น สำหรับเกมออนไลน์และการเดิมพัน ด้วยเงื่อนไขขั้นต่ำที่ต่ำ การทำธุรกรรมที่รวดเร็ว และเกมให้เลือกมากมาย ทำให้แพลตฟอร์มนี้ เหมาะสำหรับทั้งผู้เริ่มต้นและผู้เล่นที่มีประสบการณ์ ร่วมสนุกได้เลยวันนี้ และ ก้าวสู่โลกเกมออนไลน์ได้แล้ววันนี้
pg slot
สล็อต PG เกมสล็อตออนไลน์ที่คนค้นหาเยอะ เล่นง่าย ฝากถอนเร็ว
คำค้นหา PG Slot มาแรงในช่วงนี้ ในกลุ่มผู้เล่นเกมสล็อตออนไลน์ เพราะเป็น ผู้ให้บริการเกมสล็อตที่มาแรง ด้าน งานภาพคุณภาพสูง ความ เสถียร และ อัตราการจ่ายรางวัลที่น่าสนใจ เกมของ PG ออกแบบโดยทีมงานมืออาชีพ ที่รองรับการเล่นทั้งบน มือถือ และ คอมพิวเตอร์
ความโดดเด่น ของ pg slot
PG Slot เป็นเกมสล็อตออนไลน์ที่ออกแบบมาให้ เข้าเกมไว เล่นผ่าน ระบบออนไลน์ และรองรับ ทั้ง iOS และ Android ไม่ต้องดาวน์โหลดแอป ผู้เล่นสามารถเข้าเล่นผ่าน หน้าเว็บ ได้ทันที ภาพและเสียงถูกพัฒนาในรูปแบบ สามมิติ ให้ความคมชัด พร้อมเอฟเฟกต์ สมจริง
คุณสมบัติหลักของเกม pg slot ได้แก่
โบนัสและฟรีสปินหลายแบบ
ฟีเจอร์ตัวคูณรางวัล
เดโม่ฟรี
มีเมนูภาษาไทย
ระบบฝากถอนสะดวก ไม่ต้องรอนาน
แพลตฟอร์ม PG Slot มักมี การฝาก-ถอน ออโต้ตลอด 24 ชม. ขั้นต่ำเริ่มต้นเพียง 1 บาท ขึ้นอยู่กับ เงื่อนไขของเว็บไซต์ การทำรายการใช้เวลา รวดเร็วมาก ผ่าน คิวอาร์โค้ด หรือระบบ Mobile Banking ทำให้ธุรกรรมเป็นไปอย่าง ลื่นไหล
ประเภทเกมยอดนิยม ใน PG Slot
เกม pg slot มีธีมหลากหลาย เช่น
ธีม แฟนตาซี
ธีม ผจญภัย
ธีม ความมั่งคั่ง
ธีม Animal
เกมยอดนิยมมักเป็นเกมที่แตกง่าย พร้อมระบบ โบนัสรอบพิเศษ และ โอกาสทำกำไรสูง เหมาะกับทั้ง ผู้เล่นเริ่มต้น และ ผู้เล่นมือโปร
ความน่าเชื่อถือ
PG Slot ใช้ระบบที่ได้มาตรฐาน มีการ เข้ารหัสข้อมูล และใช้ระบบสุ่มผล Random Number Generator เพื่อให้ผลลัพธ์ ตรวจสอบได้ แพลตฟอร์มที่ให้บริการ PG Slot ควรมี ทีมซัพพอร์ต 24 ชม.
โดยภาพรวม
pg slot เป็นตัวเลือกยอดนิยมสำหรับผู้ที่ต้องการเล่นสล็อตออนไลน์ ด้วยจุดเด่นด้าน ระบบลื่นไหล และการทำธุรกรรมที่ ทันใจ ผู้เล่นสามารถเริ่มต้นได้ ไม่ซับซ้อน ฝากถอนสะดวก และเลือกเกมได้ จำนวนมาก เหมาะสำหรับ ทั้งมือใหม่และมือโปร ในโลกของเกมสล็อตออนไลน์
TKBNEKO มอบมิติใหม่ของเกมออนไลน์ ธุรกรรมรวดเร็ว ด้วยระบบสแกน QR Code
ในยุคดิจิทัลที่ โลกออนไลน์เติบโตต่อเนื่อง เรามุ่งเน้นมาตรฐานใหม่ของการเดิมพัน ด้วยระบบที่ ล้ำสมัย เสถียร และ โปร่งใส เพื่อให้ผู้เล่น มั่นใจ ทุกครั้งที่ใช้งาน
ระบบการเงินที่ใช้งานง่าย
ฝากขั้นต่ำ: 1 บาท
ถอนขั้นต่ำ: 1 บาท
เวลาฝากเงิน: ใช้เวลาเพียง 3 วินาที
ยอดถอน: ไม่จำกัดต่อวัน
ฝากง่าย เพียงสแกน QR Code
สแกน QR Code ระบบจะ โอนเงินเข้าทันที ขั้นต่ำ เริ่ม 100 บาท สูงสุด ไม่เกิน 500,000 บาทต่อครั้ง
เกมยอดนิยม
สล็อต: ลุ้นแจ็คพอต
เกมสด: ดีลเลอร์สด
กีฬา: เดิมพันลีกดัง
ยิงปลา: สนุกได้เงินจริง
โบนัสและโปรโมชัน
ติดตามหน้า โบนัส พร้อมระบบ สมาชิกพรีเมียม และโปรแกรม แอฟฟิลิเอต
ฝ่ายบริการลูกค้า
สอบถามข้อมูลได้ตลอด 24 ชั่วโมง ผ่านหน้า ติดต่อเรา ทีมงาน ของเรา พร้อมดูแลตลอดเวลา
pg slot แพลตฟอร์มเกมสล็อตยอดนิยม ใช้งานง่าย ฝากถอนรวดเร็ว
คำค้นหา pg slot มาแรงในช่วงนี้ ในกลุ่มผู้เล่นเกมสล็อตออนไลน์ เพราะเป็น ผู้ให้บริการเกมสล็อตที่มาแรง ด้าน กราฟิก ความ นิ่งไม่สะดุด และ โอกาสรับกำไรที่ดี เกมของ PG พัฒนาโดยผู้ให้บริการชั้นนำ ที่รองรับการเล่นทั้งบน โทรศัพท์มือถือ และ คอมพิวเตอร์
ข้อดี ของ PG Slot
PG Slot เป็นเกมสล็อตออนไลน์ที่ออกแบบมาให้ เข้าเกมไว เล่นผ่าน ระบบออนไลน์ และรองรับ ทั้ง iOS และ Android เข้าเล่นผ่านเว็บได้เลย ผู้เล่นสามารถเข้าเล่นผ่าน Browser ได้ทันที ภาพและเสียงถูกพัฒนาในรูปแบบ เอฟเฟกต์ 3 มิติ ให้ความคมชัด พร้อมเอฟเฟกต์ สวยงาม
คุณสมบัติหลักของเกม pg slot ได้แก่
โบนัสและฟรีสปินหลายแบบ
ระบบตัวคูณ
เดโม่ฟรี
มีเมนูภาษาไทย
ระบบการเงินรวดเร็ว ไม่ต้องรอนาน
แพลตฟอร์ม PG Slot มักมี การฝาก-ถอน ออโต้ตลอด 24 ชม. ขั้นต่ำเริ่มต้นเพียง 10 บาท ขึ้นอยู่กับ ระบบของผู้ให้บริการ การทำรายการใช้เวลา ไม่กี่วินาที ผ่าน สแกน QR หรือระบบ Mobile Banking ทำให้ธุรกรรมเป็นไปอย่าง ต่อเนื่อง
ประเภทเกมยอดนิยม ใน PG Slot
เกม PG Slot มีธีมหลากหลาย เช่น
ธีม แฟนตาซี
ธีม ผจญภัย
ธีม เอเชียและโชคลาภ
ธีม Animal
หลายคนชอบเกมที่โบนัสเข้าไว พร้อมระบบ ฟีเจอร์พิเศษ และ โอกาสทำกำไรสูง เหมาะกับทั้ง ผู้เล่นเริ่มต้น และ ผู้เล่นมือโปร
มาตรฐานระบบ
pg slot พัฒนาในระบบสากล มีการ ปกป้องข้อมูลผู้เล่น และใช้ระบบสุ่มผล RNG เพื่อให้ผลลัพธ์ โปร่งใส แพลตฟอร์มที่ให้บริการ pg slot ควรมี ระบบดูแลข้อมูล
โดยภาพรวม
pg slot เป็นตัวเลือกยอดนิยมสำหรับผู้ที่ต้องการเล่นสล็อตออนไลน์ ด้วยจุดเด่นด้าน ระบบลื่นไหล และการทำธุรกรรมที่ ทันใจ ผู้เล่นสามารถเริ่มต้นได้ ง่าย ฝากถอนสะดวก และเลือกเกมได้ จำนวนมาก เหมาะสำหรับ ผู้เล่นทุกสไตล์ ในโลกของเกมสล็อตออนไลน์
ทดลองเล่นสล็อต pg
แพลตฟอร์ม TKBNEKO มอบมิติใหม่ของเกมออนไลน์ ธุรกรรมรวดเร็ว ด้วยระบบสแกน QR Code
ในยุคดิจิทัลที่ เทคโนโลยีพัฒนาอย่างรวดเร็ว TKBNEKO พร้อมยกระดับการให้บริการ ด้วยระบบที่ ล้ำสมัย เสถียร และ โปร่งใส เพื่อให้ผู้เล่น มั่นใจ ทุกครั้งที่ใช้งาน
จุดเด่นระบบฝาก-ถอน
ฝากขั้นต่ำ: 1 บาท
ถอนขั้นต่ำ: ขั้นต่ำ 1 บาท
เวลาฝากเงิน: ใช้เวลาเพียง 3 วินาที
ยอดถอน: ไม่มีลิมิต
ฝากง่าย เพียงสแกน QR Code
สแกน คิวอาร์ ระบบจะ โอนเงินเข้าทันที ขั้นต่ำ 100 บาท สูงสุด 500,000 บาท
เกมยอดนิยม
สล็อต: ธีมหลากหลาย
เกมสด: ดีลเลอร์สด
กีฬา: แมตช์ทั่วโลก
ยิงปลา: สนุกได้เงินจริง
โบนัสและโปรโมชัน
ติดตามหน้า โปรโมชั่น พร้อมระบบ สมาชิกพรีเมียม และโปรแกรม แอฟฟิลิเอต
ติดต่อเรา
สอบถามข้อมูลได้ตลอด 24 ชั่วโมง ผ่านหน้า ติดต่อเรา ทีมงาน ของเรา พร้อมดูแลตลอดเวลา
ทดลองเล่นสล็อต pg ซื้อฟรีสปิน
สล็อต PG เกมสล็อตออนไลน์ที่คนค้นหาเยอะ เข้าเล่นไว ฝากถอนออโต้
คำค้นหา pg slot ถูกค้นหามากขึ้นเรื่อยๆ ในกลุ่มผู้เล่นเกมสล็อตออนไลน์ เพราะเป็น แบรนด์เกมที่โดดเด่น ด้าน กราฟิก ความ เสถียร และ ระบบจ่ายที่ดึงดูด เกมของ PG ผลิตโดยค่ายมาตรฐาน ที่รองรับการเล่นทั้งบน สมาร์ทโฟน และ คอมพิวเตอร์
ความโดดเด่น ของ สล็อต PG
PG Slot เป็นเกมสล็อตออนไลน์ที่ออกแบบมาให้ โหลดเร็ว เล่นผ่าน ระบบออนไลน์ และรองรับ ทั้ง iOS และ Android เข้าเล่นผ่านเว็บได้เลย ผู้เล่นสามารถเข้าเล่นผ่าน เว็บเบราว์เซอร์ ได้ทันที ภาพและเสียงถูกพัฒนาในรูปแบบ เอฟเฟกต์ 3 มิติ ให้ความคมชัด พร้อมเอฟเฟกต์ สมจริง
คุณสมบัติหลักของเกม pg slot ได้แก่
มีรอบโบนัสให้ลุ้นบ่อย
ระบบตัวคูณ
เล่นฟรีก่อนเติมเงิน
มีเมนูภาษาไทย
ฝากถอนง่าย ทันใจ
แพลตฟอร์ม สล็อต PG ส่วนใหญ่รองรับ การฝาก-ถอน อัตโนมัติ 24 ชั่วโมง ขั้นต่ำเริ่มต้นเพียง 1 บาท ขึ้นอยู่กับ กติกาแต่ละแพลตฟอร์ม การทำรายการใช้เวลา ไม่กี่วินาที ผ่าน QR Code หรือระบบ Mobile Banking ทำให้ธุรกรรมเป็นไปอย่าง ไม่สะดุด
หมวดเกมฮิต ใน pg slot
เกม pg slot มีธีมหลากหลาย เช่น
ธีม เทพเจ้า
ธีม Adventure
ธีม โชคลาภ
ธีม สัตว์และธรรมชาติ
หลายคนชอบเกมที่โบนัสเข้าไว พร้อมระบบ ฟีเจอร์พิเศษ และ โอกาสทำกำไรสูง เหมาะกับทั้ง ผู้เล่นเริ่มต้น และ สายสล็อตจริงจัง
มาตรฐานระบบ
pg slot พัฒนาในระบบสากล มีการ รักษาความปลอดภัย และใช้ระบบสุ่มผล RNG เพื่อให้ผลลัพธ์ ตรวจสอบได้ แพลตฟอร์มที่ให้บริการ pg slot ควรมี ระบบดูแลข้อมูล
บทสรุปท้ายบท
สล็อต PG เป็นตัวเลือกยอดนิยมสำหรับผู้ที่ต้องการเล่นสล็อตออนไลน์ ด้วยจุดเด่นด้าน ระบบลื่นไหล และการทำธุรกรรมที่ ทันใจ ผู้เล่นสามารถเริ่มต้นได้ ไม่ซับซ้อน ฝากถอนสะดวก และเลือกเกมได้ ครบทุกหมวด เหมาะสำหรับ ทุกระดับประสบการณ์ ในโลกของเกมสล็อตออนไลน์
официальный сайт мелбет
Скачать приложение Melbet: APK, iOS и компьютер
Мобильная версия Melbet объединяет ставки и казино в едином приложении. Доступны live-ставки, слоты, прямые трансляции, статистика и операции по счёту. Загрузка занимает несколько минут.
Android (APK)
Скачайте APK с официального источника, запустите установщик и завершите установку. Если требуется включите доступ к установке сторонних приложений, затем войдите в аккаунт.
iOS (iPhone)
Перейдите в App Store, введите в поиске «Melbet», выберите «Получить», после установки выполните вход.
ПК
Перейдите официальный сайт, авторизуйтесь и создайте ярлык на рабочий стол. Браузерная версия функционирует как отдельное приложение.
Функционал
Live-ставки с мгновенным обновлением линии, казино и слоты, прямые трансляции, подробная статистика, уведомления о матчах, быстрая регистрация и поддержка 24/7.
Бонусы
После установки доступны бонус на первый депозит, акционные коды и фрибеты. Правила начисления определяются регионом.
Безопасность
Загружайте только с официальных источников, проверяйте домен, не передавайте пароль третьим лицам и включите 2FA.
Загрузка выполняется быстро, после чего доступен весь функционал Melbet.
промокод melbet
Скачать Melbet: Android, iPhone и ПК
Приложение Melbet объединяет ставки и казино в едином приложении. Доступны live-ставки, слоты, онлайн-трансляции, статистика и быстрые финансовые операции. Установка занимает несколько минут.
Android (APK)
Скачайте APK с официального сайта, запустите установщик и подтвердите установку. При необходимости включите разрешение на установку из неизвестных источников, затем авторизуйтесь.
iOS (iPhone)
Откройте App Store, найдите «Melbet», нажмите «Получить», после установки авторизуйтесь в системе.
ПК
Откройте официальный сайт, войдите в личный кабинет и создайте ярлык на рабочий стол. Браузерная версия функционирует как отдельное приложение.
Функционал
Live-ставки с мгновенным обновлением линии, игровой раздел с тысячами игр, просмотр матчей, аналитические данные, уведомления о матчах, регистрация за минуту и поддержка 24/7.
Бонусы
После загрузки доступны бонус на первый депозит, промокоды и фрибеты. Условия зависят от региона.
Безопасность
Скачивайте только с официального сайта, проверяйте домен, не сообщайте данные доступа третьим лицам и включите 2FA.
Установка занимает несколько минут, после чего открывается полный доступ Melbet.
สล็อต PG เกมสล็อตออนไลน์ที่คนค้นหาเยอะ เข้าเล่นไว ฝากถอนออโต้
คำค้นหา สล็อต PG กำลังได้รับความนิยมอย่างต่อเนื่อง ในกลุ่มผู้เล่นเกมสล็อตออนไลน์ เพราะเป็น แบรนด์เกมที่โดดเด่น ด้าน ภาพและเอฟเฟกต์ ความ นิ่งไม่สะดุด และ ระบบจ่ายที่ดึงดูด เกมของ PG ผลิตโดยค่ายมาตรฐาน ที่รองรับการเล่นทั้งบน มือถือ และ คอมพิวเตอร์
ข้อดี ของ สล็อต PG
PG Slot เป็นเกมสล็อตออนไลน์ที่ออกแบบมาให้ เข้าเกมไว เล่นผ่าน ระบบเว็บ และรองรับ ทุกแพลตฟอร์ม ไม่ต้องดาวน์โหลดแอป ผู้เล่นสามารถเข้าเล่นผ่าน Browser ได้ทันที ภาพและเสียงถูกพัฒนาในรูปแบบ เอฟเฟกต์ 3 มิติ ให้ความคมชัด พร้อมเอฟเฟกต์ จัดเต็ม
คุณสมบัติหลักของเกม pg slot ได้แก่
มีรอบโบนัสให้ลุ้นบ่อย
Multiplier
เดโม่ฟรี
รองรับภาษาไทยเต็มรูปแบบ
ระบบการเงินรวดเร็ว ไม่ต้องรอนาน
แพลตฟอร์ม PG Slot โดยทั่วไปให้บริการ การฝาก-ถอน อัตโนมัติ 24 ชั่วโมง ขั้นต่ำเริ่มต้นเพียง หลักหน่วย ขึ้นอยู่กับ เงื่อนไขของเว็บไซต์ การทำรายการใช้เวลา รวดเร็วมาก ผ่าน คิวอาร์โค้ด หรือระบบ ธนาคารบนมือถือ ทำให้ธุรกรรมเป็นไปอย่าง ต่อเนื่อง
แนวเกมที่คนเล่นเยอะ ใน PG Slot
เกม PG Slot มีธีมหลากหลาย เช่น
ธีม เทพเจ้าและแฟนตาซี
ธีม Adventure
ธีม เอเชียและโชคลาภ
ธีม Animal
ผู้เล่นนิยมเกมที่มีรอบพิเศษบ่อย พร้อมระบบ โบนัสรอบพิเศษ และ โอกาสทำกำไรสูง เหมาะกับทั้ง มือใหม่ และ สายสล็อตจริงจัง
ความปลอดภัย
PG Slot พัฒนาในระบบสากล มีการ เข้ารหัสข้อมูล และใช้ระบบสุ่มผล ระบบสุ่มมาตรฐาน เพื่อให้ผลลัพธ์ ยุติธรรม แพลตฟอร์มที่ให้บริการ PG Slot ควรมี ความปลอดภัยสูง
บทสรุปท้ายบท
สล็อต PG เป็นตัวเลือกยอดนิยมสำหรับผู้ที่ต้องการเล่นสล็อตออนไลน์ ด้วยจุดเด่นด้าน กราฟิกคุณภาพ และการทำธุรกรรมที่ รวดเร็ว ผู้เล่นสามารถเริ่มต้นได้ ไม่ซับซ้อน ฝากถอนสะดวก และเลือกเกมได้ หลากหลายแนว เหมาะสำหรับ ทุกระดับประสบการณ์ ในโลกของเกมสล็อตออนไลน์
ทดลองเล่นสล็อต pg
แพลตฟอร์ม TKBNEKO มอบมิติใหม่ของเกมออนไลน์ ฝาก-ถอนไว ด้วยระบบสแกน คิวอาร์โค้ด
ในยุคดิจิทัลที่ โลกออนไลน์เติบโตต่อเนื่อง TKBNEKO พร้อมยกระดับการให้บริการ ด้วยระบบที่ ล้ำสมัย เสถียร และ โปร่งใส เพื่อให้ผู้เล่น มั่นใจ ทุกครั้งที่ใช้งาน
จุดเด่นระบบฝาก-ถอน
ฝากขั้นต่ำ: 1 บาท
ถอนขั้นต่ำ: ขั้นต่ำ 1 บาท
เวลาฝากเงิน: ใช้เวลาเพียง 3 วินาที
ยอดถอน: ไม่จำกัดต่อวัน
เติมเงินง่าย แค่สแกน
สแกน QR Code ระบบจะ ประมวลผลอัตโนมัติ ขั้นต่ำ เริ่ม 100 บาท สูงสุด ไม่เกิน 500,000 บาทต่อครั้ง
หมวดหมู่เกม
สล็อต: ลุ้นแจ็คพอต
เกมสด: คาสิโนเรียลไทม์
กีฬา: แมตช์ทั่วโลก
ยิงปลา: ลุ้นกำไรทันที
โปรโมชั่นและสิทธิพิเศษ
ติดตามหน้า โปรโมชั่น พร้อมระบบ VIP และโปรแกรม พันธมิตร
ติดต่อเรา
สอบถามข้อมูลได้ตลอด 24 ชั่วโมง ผ่านหน้า ติดต่อเรา ทีมงาน ของเรา พร้อมดูแลตลอดเวลา
скачать мелбет на айфон с играми
Скачать Melbet: APK, iPhone и компьютер
Приложение Melbet включает ставки и казино в едином приложении. Доступны live-ставки, казино-игры, онлайн-трансляции, аналитика и быстрые финансовые операции. Загрузка занимает 1–2 минуты.
Android (APK)
Скачайте APK с официального источника, откройте файл и подтвердите установку. Если требуется включите разрешение на установку из неизвестных источников, затем войдите в аккаунт.
iOS (iPhone)
Перейдите в App Store, найдите «Melbet», нажмите «Получить», после установки авторизуйтесь в системе.
ПК
Перейдите официальный сайт, войдите в личный кабинет и создайте ярлык на рабочий стол. Браузерная версия функционирует как полноценное приложение.
Функционал
Live-ставки с обновлением коэффициентов, казино и слоты, просмотр матчей, аналитические данные, push-оповещения, регистрация за минуту и круглосуточная служба поддержки.
Бонусы
После установки доступны приветственный бонус, акционные коды и бесплатные ставки. Правила начисления определяются регионом.
Безопасность
Скачивайте только с официальных источников, проверяйте домен, не передавайте пароль третьим лицам и активируйте двухфакторную аутентификацию.
Установка занимает несколько минут, после чего открывается полный доступ Melbet.
pg
เว็บไซต์ TKBNEKO เปิดประสบการณ์ใหม่แห่งการเดิมพันออนไลน์ ฝาก-ถอนไว ด้วยระบบสแกน คิวอาร์โค้ด
ในยุคที่ เทคโนโลยีเปลี่ยนวิถีการเดิมพันออนไลน์ไปอย่างสิ้นเชิง TKBNEKO พร้อมยกระดับมาตรฐานการเดิมพัน ด้วยระบบการให้บริการที่ ทันสมัย ฉับไว และ ชัดเจน พร้อมต้อนรับสมาชิกทุกท่านสู่ มิติใหม่แห่งความสนุก ที่ เปิดโอกาสให้ทุกคนสร้างรายได้
ทำไมต้อง TKBNEKO?
แพลตฟอร์มของเรารวบรวมเกมที่ได้มาตรฐาน โดยเฉพาะเกมที่ ผ่านการรับรองจากสถาบันที่น่าเชื่อถือ และ เป็นที่นิยมในระดับสากล เพื่อให้ผู้เล่นทุกคน อุ่นใจ ได้ว่า จะได้รับความเพลิดเพลินกับเกมที่ โปร่งใส ข้อมูลไม่รั่วไหล และ มีคุณภาพสูง
จุดเด่นของระบบฝาก-ถอน
เรามุ่งเน้นความสะดวกของผู้เล่น เพื่อให้คุณ โฟกัสกับความสนุกได้อย่างเต็มที่
ฝากขั้นต่ำ: ขั้นต่ำแค่ 1 บาท
ถอนขั้นต่ำ: ขั้นต่ำ 1 บาท
เวลาฝากเงิน: รวดเร็วทันใจใน 3 วินาที
ยอดจำกัดการถอน: ไม่มีลิมิตการถอนรายวัน
ธุรกรรมสะดวก แค่สแกนคิวอาร์
เพียงคุณสแกน คิวอาร์ ระบบของเราจะ ประมวลผลอย่างรวดเร็ว ขั้นต่ำเพียง อย่างน้อย 100 บาท และสามารถฝากได้สูงถึง 500,000 บาท เริ่มต้นได้ทันที กับ แพลตฟอร์มของเรา ที่ ใช้งานง่าย ทำกำไรได้รวดเร็ว
เกมยอดนิยมรวมไว้ในที่เดียว
TKBNEKO รวมเกมสุดฮิตไว้ในที่เดียว รองรับทุกความชอบของผู้เล่น
สล็อต: ธีมมากมาย พร้อมลุ้นรางวัลใหญ่
เกมสด: เล่นสดเหมือนอยู่ในคาสิโนจริง
กีฬา: เดิมพันกับแมตช์การแข่งขันจากทั่วโลก
ยิงปลา: เกมยิงปลาสุดมันส์ ได้เงินจริง
รับโบนัสและข้อเสนอสุดคุ้ม
อย่าลืมแวะมาเยี่ยมชมที่หน้า โปรโมชั่น เพื่อรับ สิทธิพิเศษมากมาย ที่เรามอบให้สมาชิกทุกท่าน นอกจากนี้ยังมีระบบ ลูกค้าระดับพรีเมียม สำหรับลูกค้าคนสำคัญ และช่องทาง พาร์ทเนอร์ สำหรับผู้ที่สนใจสร้างรายได้ร่วมกับเรา
ฝ่ายบริการลูกค้า
หากมี ปัญหา หรือ ข้อเสนอแนะ สามารถติดต่อทีมงานของเราได้ตลอด 24 ชั่วโมงที่หน้า ติดต่อเรา และ แบบฟอร์มติดต่อ ทีมงาน TKBNEKO ยินดีให้บริการทุกท่านด้วยใจ
La page aruba-bet.com/ se charge rapidement sur
mon navigateur.
La interfaz de betsmexico.mx/ se mantiene ordenada.
De lay-out van starcasino247.com/ingang/ ondersteunt eenvoud.
ทดลองเล่นสล็อต pg เว็บ ตรง”
สล็อต PG สล็อตยอดฮิต เล่นง่าย ฝากถอนเร็ว
คำค้นหา pg slot มาแรงในช่วงนี้ ในกลุ่มผู้เล่นเกมสล็อตออนไลน์ เพราะเป็น ผู้ให้บริการเกมสล็อตที่มาแรง ด้าน กราฟิก ความ เสถียร และ ระบบจ่ายที่ดึงดูด เกมของ PG ผลิตโดยค่ายมาตรฐาน ที่รองรับการเล่นทั้งบน มือถือ และ พีซี
ความโดดเด่น ของ pg slot
pg slot เป็นเกมสล็อตออนไลน์ที่ออกแบบมาให้ เปิดเกมได้ทันที เล่นผ่าน ระบบออนไลน์ และรองรับ ทุกแพลตฟอร์ม เข้าเล่นผ่านเว็บได้เลย ผู้เล่นสามารถเข้าเล่นผ่าน หน้าเว็บ ได้ทันที ภาพและเสียงถูกพัฒนาในรูปแบบ เอฟเฟกต์ 3 มิติ ให้ความคมชัด พร้อมเอฟเฟกต์ สวยงาม
คุณสมบัติหลักของเกม สล็อต PG ได้แก่
ระบบโบนัสและฟรีสปินหลากหลายรูปแบบ
ฟีเจอร์ตัวคูณรางวัล
เล่นฟรีก่อนเติมเงิน
รองรับภาษาไทยเต็มรูปแบบ
ระบบการเงินรวดเร็ว ทำรายการไว
แพลตฟอร์ม pg slot มักมี การฝาก-ถอน อัตโนมัติ 24 ชั่วโมง ขั้นต่ำเริ่มต้นเพียง หลักหน่วย ขึ้นอยู่กับ กติกาแต่ละแพลตฟอร์ม การทำรายการใช้เวลา เพียงไม่กี่วินาที ผ่าน QR Code หรือระบบ แอปธนาคาร ทำให้ธุรกรรมเป็นไปอย่าง ต่อเนื่อง
แนวเกมที่คนเล่นเยอะ ใน pg slot
เกม pg slot มีธีมหลากหลาย เช่น
ธีม แฟนตาซี
ธีม ผจญภัย
ธีม ความมั่งคั่ง
ธีม Animal
ผู้เล่นนิยมเกมที่มีรอบพิเศษบ่อย พร้อมระบบ Special Feature และ อัตราการจ่ายที่สูง เหมาะกับทั้ง ผู้เล่นเริ่มต้น และ ผู้เล่นที่มีประสบการณ์
ความปลอดภัย
สล็อต PG ใช้ระบบที่ได้มาตรฐาน มีการ รักษาความปลอดภัย และใช้ระบบสุ่มผล Random Number Generator เพื่อให้ผลลัพธ์ โปร่งใส แพลตฟอร์มที่ให้บริการ สล็อต PG ควรมี ระบบดูแลข้อมูล
สรุป
PG Slot เป็นตัวเลือกยอดนิยมสำหรับผู้ที่ต้องการเล่นสล็อตออนไลน์ ด้วยจุดเด่นด้าน ระบบลื่นไหล และการทำธุรกรรมที่ ไว ผู้เล่นสามารถเริ่มต้นได้ ทันที ฝากถอนสะดวก และเลือกเกมได้ หลากหลายแนว เหมาะสำหรับ ทุกระดับประสบการณ์ ในโลกของเกมสล็อตออนไลน์
queen-win.co.uk/login/ doesn’t addd unnecessary steps.
ทดลองเล่นสล็อต pg ไม่ เด้ง
สล็อต
TKBNEKO เปิดประสบการณ์ใหม่แห่งการเดิมพันออนไลน์ ฝาก-ถอนไว ด้วยระบบสแกน QR Code
ในยุคดิจิทัลที่ โลกออนไลน์เติบโตต่อเนื่อง TKBNEKO พร้อมยกระดับการให้บริการ ด้วยระบบที่ ล้ำสมัย รวดเร็ว และ ตรวจสอบได้ เพื่อให้ผู้เล่น มั่นใจ ทุกครั้งที่ใช้งาน
จุดเด่นระบบฝาก-ถอน
ฝากขั้นต่ำ: เริ่มต้น 1 บาท
ถอนขั้นต่ำ: 1 บาท
เวลาฝากเงิน: ใช้เวลาเพียง 3 วินาที
ยอดถอน: ไม่จำกัดต่อวัน
ฝากง่าย เพียงสแกน QR Code
สแกน QR Code ระบบจะ ประมวลผลอัตโนมัติ ขั้นต่ำ 100 บาท สูงสุด ไม่เกิน 500,000 บาทต่อครั้ง
หมวดหมู่เกม
สล็อต: ธีมหลากหลาย
เกมสด: คาสิโนเรียลไทม์
กีฬา: แมตช์ทั่วโลก
ยิงปลา: ลุ้นกำไรทันที
โบนัสและโปรโมชัน
ติดตามหน้า โบนัส พร้อมระบบ VIP และโปรแกรม แอฟฟิลิเอต
ฝ่ายบริการลูกค้า
สอบถามข้อมูลได้ตลอด 24 ชั่วโมง ผ่านหน้า ศูนย์ช่วยเหลือ ทีมงาน TKBNEKO พร้อมดูแลตลอดเวลา
สล็อต PG เกมสล็อตออนไลน์ที่คนค้นหาเยอะ เข้าเล่นไว ฝากถอนออโต้
คำค้นหา สล็อต PG ถูกค้นหามากขึ้นเรื่อยๆ ในกลุ่มผู้เล่นเกมสล็อตออนไลน์ เพราะเป็น ผู้ให้บริการเกมสล็อตที่มาแรง ด้าน ภาพและเอฟเฟกต์ ความ นิ่งไม่สะดุด และ อัตราการจ่ายรางวัลที่น่าสนใจ เกมของ PG พัฒนาโดยผู้ให้บริการชั้นนำ ที่รองรับการเล่นทั้งบน โทรศัพท์มือถือ และ คอมพิวเตอร์
ข้อดี ของ pg slot
PG Slot เป็นเกมสล็อตออนไลน์ที่ออกแบบมาให้ เปิดเกมได้ทันที เล่นผ่าน ระบบอัตโนมัติ และรองรับ ทุกอุปกรณ์ เข้าเล่นผ่านเว็บได้เลย ผู้เล่นสามารถเข้าเล่นผ่าน เว็บเบราว์เซอร์ ได้ทันที ภาพและเสียงถูกพัฒนาในรูปแบบ เอฟเฟกต์ 3 มิติ ให้ความคมชัด พร้อมเอฟเฟกต์ จัดเต็ม
คุณสมบัติหลักของเกม pg slot ได้แก่
ระบบโบนัสและฟรีสปินหลากหลายรูปแบบ
ระบบตัวคูณ
เล่นฟรีก่อนเติมเงิน
รองรับภาษาไทยเต็มรูปแบบ
ฝากถอนง่าย ไม่ต้องรอนาน
แพลตฟอร์ม pg slot โดยทั่วไปให้บริการ การฝาก-ถอน ฝากถอนตลอดเวลา ขั้นต่ำเริ่มต้นเพียง หลักหน่วย ขึ้นอยู่กับ กติกาแต่ละแพลตฟอร์ม การทำรายการใช้เวลา ไม่กี่วินาที ผ่าน คิวอาร์โค้ด หรือระบบ แอปธนาคาร ทำให้ธุรกรรมเป็นไปอย่าง ไม่สะดุด
แนวเกมที่คนเล่นเยอะ ใน pg slot
เกม สล็อต PG มีธีมหลากหลาย เช่น
ธีม แฟนตาซี
ธีม ผจญภัย
ธีม ความมั่งคั่ง
ธีม สัตว์และธรรมชาติ
หลายคนชอบเกมที่โบนัสเข้าไว พร้อมระบบ Special Feature และ โอกาสทำกำไรสูง เหมาะกับทั้ง คนเพิ่งเล่น และ ผู้เล่นมือโปร
ความปลอดภัย
สล็อต PG พัฒนาในระบบสากล มีการ รักษาความปลอดภัย และใช้ระบบสุ่มผล ระบบสุ่มมาตรฐาน เพื่อให้ผลลัพธ์ ตรวจสอบได้ แพลตฟอร์มที่ให้บริการ pg slot ควรมี ทีมซัพพอร์ต 24 ชม.
สรุป
PG Slot เป็นตัวเลือกยอดนิยมสำหรับผู้ที่ต้องการเล่นสล็อตออนไลน์ ด้วยจุดเด่นด้าน กราฟิกคุณภาพ และการทำธุรกรรมที่ รวดเร็ว ผู้เล่นสามารถเริ่มต้นได้ ทันที ฝากถอนสะดวก และเลือกเกมได้ ครบทุกหมวด เหมาะสำหรับ ทั้งมือใหม่และมือโปร ในโลกของเกมสล็อตออนไลน์
https://medium.com/@ratypw/ทดลองเล่นสล็อต-pg-70cdb1132344
ทดลองเล่นสล็อต pg ฟรี PG Slot เกมสล็อตออนไลน์ที่คนค้นหาเยอะ เข้าเล่นไว ฝากถอนออโต้
คำค้นหา สล็อต PG กำลังได้รับความนิยมอย่างต่อเนื่อง ในกลุ่มผู้เล่นเกมสล็อตออนไลน์ เพราะเป็น ผู้ให้บริการเกมสล็อตที่มาแรง ด้าน งานภาพคุณภาพสูง ความ นิ่งไม่สะดุด และ อัตราการจ่ายรางวัลที่น่าสนใจ เกมของ PG ออกแบบโดยทีมงานมืออาชีพ ที่รองรับการเล่นทั้งบน โทรศัพท์มือถือ และ พีซี
ความโดดเด่น ของ PG Slot
PG Slot เป็นเกมสล็อตออนไลน์ที่ออกแบบมาให้ เข้าเกมไว เล่นผ่าน ระบบอัตโนมัติ และรองรับ ทุกแพลตฟอร์ม ไม่ต้องติดตั้งเพิ่มเติม ผู้เล่นสามารถเข้าเล่นผ่าน หน้าเว็บ ได้ทันที ภาพและเสียงถูกพัฒนาในรูปแบบ เอฟเฟกต์ 3 มิติ ให้ความคมชัด พร้อมเอฟเฟกต์ จัดเต็ม
คุณสมบัติหลักของเกม pg slot ได้แก่
มีรอบโบนัสให้ลุ้นบ่อย
ระบบตัวคูณ
เล่นฟรีก่อนเติมเงิน
รองรับภาษาไทยเต็มรูปแบบ
ระบบฝากถอนสะดวก ทันใจ
แพลตฟอร์ม PG Slot มักมี การฝาก-ถอน ฝากถอนตลอดเวลา ขั้นต่ำเริ่มต้นเพียง 10 บาท ขึ้นอยู่กับ เงื่อนไขของเว็บไซต์ การทำรายการใช้เวลา เพียงไม่กี่วินาที ผ่าน คิวอาร์โค้ด หรือระบบ แอปธนาคาร ทำให้ธุรกรรมเป็นไปอย่าง ต่อเนื่อง
แนวเกมที่คนเล่นเยอะ ใน PG Slot
เกม PG Slot มีธีมหลากหลาย เช่น
ธีม เทพเจ้า
ธีม ผจญภัย
ธีม โชคลาภ
ธีม ธรรมชาติ
เกมยอดนิยมมักเป็นเกมที่แตกง่าย พร้อมระบบ ฟีเจอร์พิเศษ และ ระบบจ่ายคุ้มค่า เหมาะกับทั้ง คนเพิ่งเล่น และ ผู้เล่นมือโปร
ความปลอดภัย
PG Slot ใช้ระบบที่ได้มาตรฐาน มีการ รักษาความปลอดภัย และใช้ระบบสุ่มผล ระบบสุ่มมาตรฐาน เพื่อให้ผลลัพธ์ ตรวจสอบได้ แพลตฟอร์มที่ให้บริการ สล็อต PG ควรมี ความปลอดภัยสูง
บทสรุปท้ายบท
สล็อต PG เป็นตัวเลือกยอดนิยมสำหรับผู้ที่ต้องการเล่นสล็อตออนไลน์ ด้วยจุดเด่นด้าน โบนัสหลากหลาย และการทำธุรกรรมที่ รวดเร็ว ผู้เล่นสามารถเริ่มต้นได้ ทันที ฝากถอนสะดวก และเลือกเกมได้ หลากหลายแนว เหมาะสำหรับ ทั้งมือใหม่และมือโปร ในโลกของเกมสล็อตออนไลน์
pg slot เกมสล็อตออนไลน์ที่คนค้นหาเยอะ เล่นง่าย ฝากถอนเร็ว
คำค้นหา สล็อต PG ถูกค้นหามากขึ้นเรื่อยๆ ในกลุ่มผู้เล่นเกมสล็อตออนไลน์ เพราะเป็น ผู้ให้บริการเกมสล็อตที่มาแรง ด้าน งานภาพคุณภาพสูง ความ เสถียร และ โอกาสรับกำไรที่ดี เกมของ PG ผลิตโดยค่ายมาตรฐาน ที่รองรับการเล่นทั้งบน โทรศัพท์มือถือ และ คอมพิวเตอร์
ความโดดเด่น ของ PG Slot
pg slot เป็นเกมสล็อตออนไลน์ที่ออกแบบมาให้ เข้าเกมไว เล่นผ่าน ระบบออนไลน์ และรองรับ ทั้ง iOS และ Android ไม่ต้องติดตั้งเพิ่มเติม ผู้เล่นสามารถเข้าเล่นผ่าน เว็บเบราว์เซอร์ ได้ทันที ภาพและเสียงถูกพัฒนาในรูปแบบ เอฟเฟกต์ 3 มิติ ให้ความคมชัด พร้อมเอฟเฟกต์ สมจริง
คุณสมบัติหลักของเกม pg slot ได้แก่
มีรอบโบนัสให้ลุ้นบ่อย
Multiplier
โหมดทดลองเล่นฟรี
ใช้งานภาษาไทยง่าย
ระบบการเงินรวดเร็ว ทำรายการไว
แพลตฟอร์ม pg slot โดยทั่วไปให้บริการ การฝาก-ถอน อัตโนมัติ 24 ชั่วโมง ขั้นต่ำเริ่มต้นเพียง 1 บาท ขึ้นอยู่กับ เงื่อนไขของเว็บไซต์ การทำรายการใช้เวลา รวดเร็วมาก ผ่าน สแกน QR หรือระบบ Mobile Banking ทำให้ธุรกรรมเป็นไปอย่าง ลื่นไหล
แนวเกมที่คนเล่นเยอะ ใน PG Slot
เกม pg slot มีธีมหลากหลาย เช่น
ธีม แฟนตาซี
ธีม ลุยด่าน
ธีม โชคลาภ
ธีม Animal
ผู้เล่นนิยมเกมที่มีรอบพิเศษบ่อย พร้อมระบบ ฟีเจอร์พิเศษ และ อัตราการจ่ายที่สูง เหมาะกับทั้ง มือใหม่ และ ผู้เล่นที่มีประสบการณ์
ความน่าเชื่อถือ
สล็อต PG พัฒนาในระบบสากล มีการ เข้ารหัสข้อมูล และใช้ระบบสุ่มผล ระบบสุ่มมาตรฐาน เพื่อให้ผลลัพธ์ ยุติธรรม แพลตฟอร์มที่ให้บริการ สล็อต PG ควรมี ความปลอดภัยสูง
โดยภาพรวม
สล็อต PG เป็นตัวเลือกยอดนิยมสำหรับผู้ที่ต้องการเล่นสล็อตออนไลน์ ด้วยจุดเด่นด้าน ระบบลื่นไหล และการทำธุรกรรมที่ ทันใจ ผู้เล่นสามารถเริ่มต้นได้ ง่าย ฝากถอนสะดวก และเลือกเกมได้ จำนวนมาก เหมาะสำหรับ ทุกระดับประสบการณ์ ในโลกของเกมสล็อตออนไลน์
ทดลองเล่นสล็อต pg ไม่ เด้ง
pg
TKBNEKO มอบมิติใหม่ของการเดิมพันออนไลน์ ฝาก-ถอนไว ด้วยระบบสแกน คิวอาร์โค้ด
ในยุคที่ เทคโนโลยีเปลี่ยนวิถีการเดิมพันออนไลน์ไปอย่างสิ้นเชิง TKBNEKO เข้ามาสร้างมาตรฐานใหม่ให้กับวงการ ด้วยระบบการให้บริการที่ อัปเดตตลอดเวลา เสถียร และ โปร่งใส พร้อมต้อนรับสมาชิกทุกท่านสู่ โลกแห่งเกมที่เหนือกว่าเดิม ที่ เปิดโอกาสให้ทุกคนสร้างรายได้
ทำไมต้อง TKBNEKO?
แพลตฟอร์มของเรารวบรวมเกมที่ได้มาตรฐาน โดยเฉพาะเกมที่ ผ่านการรับรองจากสถาบันที่น่าเชื่อถือ และ เป็นที่นิยมในระดับสากล เพื่อให้ผู้เล่นทุกคน มั่นใจ ได้ว่า จะได้รับความเพลิดเพลินกับเกมที่ โปร่งใส มีระบบรักษาความปลอดภัยสูง และ มีคุณภาพสูง
ระบบการเงินที่เหนือกว่า
ระบบฝากถอนถูกพัฒนาให้ใช้งานง่าย เพื่อให้คุณ โฟกัสกับความสนุกได้อย่างเต็มที่
ฝากขั้นต่ำ: ขั้นต่ำแค่ 1 บาท
ถอนขั้นต่ำ: ขั้นต่ำ 1 บาท
เวลาฝากเงิน: รวดเร็วทันใจใน 3 วินาที
ยอดจำกัดการถอน: ไม่มีลิมิตการถอนรายวัน
ฝากง่าย เพียงสแกน QR Code
เพียงคุณสแกน โค้ดคิวอาร์ ระบบของเราจะ ประมวลผลอย่างรวดเร็ว ขั้นต่ำเพียง 100 บาท และสามารถฝากได้สูงถึง 500,000 บาท เข้าร่วมความสนุกได้เลย กับ TKBNEKO ที่ เล่นง่าย เดิมพันง่าย ได้เงินไว
คลังเกมคุณภาพ
เรารวบรวมเกมยอดนิยมหลากหลายประเภท รองรับทุกความชอบของผู้เล่น
สล็อต: หลากหลายธีม แจ็คพอตรอคุณอยู่
เกมสด: เล่นสดเหมือนอยู่ในคาสิโนจริง
กีฬา: วางเดิมพันกีฬาหลากหลายรายการ
ยิงปลา: เกมยิงปลาสุดมันส์ ได้เงินจริง
อัปเดตโปรโมชันล่าสุด
อย่าลืมแวะมาเยี่ยมชมที่หน้า โบนัส เพื่อรับ สิทธิพิเศษมากมาย ที่เรามอบให้สมาชิกทุกท่าน นอกจากนี้ยังมีระบบ สมาชิกวีไอพี สำหรับลูกค้าคนสำคัญ และช่องทาง พันธมิตร สำหรับผู้ที่สนใจสร้างรายได้ร่วมกับเรา
ช่องทางติดต่อ
หากมี ปัญหา หรือ ข้อเสนอแนะ สามารถติดต่อทีมงานของเราได้ตลอด 24 ชั่วโมงที่หน้า ฝ่ายสนับสนุน และ ข้อเสนอแนะ ทีมงาน TKBNEKO ยินดีให้บริการทุกท่านด้วยใจ
สล็อต
แพลตฟอร์ม TKBNEKO มอบมิติใหม่ของเกมออนไลน์ ธุรกรรมรวดเร็ว ด้วยระบบสแกน QR Code
ในยุคดิจิทัลที่ โลกออนไลน์เติบโตต่อเนื่อง เรามุ่งเน้นมาตรฐานใหม่ของการเดิมพัน ด้วยระบบที่ ล้ำสมัย เสถียร และ โปร่งใส เพื่อให้ผู้เล่น อุ่นใจ ทุกครั้งที่ใช้งาน
ระบบการเงินที่ใช้งานง่าย
ฝากขั้นต่ำ: เริ่มต้น 1 บาท
ถอนขั้นต่ำ: ขั้นต่ำ 1 บาท
เวลาฝากเงิน: ใช้เวลาเพียง 3 วินาที
ยอดถอน: ไม่จำกัดต่อวัน
ฝากง่าย เพียงสแกน QR Code
สแกน QR Code ระบบจะ โอนเงินเข้าทันที ขั้นต่ำ เริ่ม 100 บาท สูงสุด 500,000 บาท
เกมยอดนิยม
สล็อต: ลุ้นแจ็คพอต
เกมสด: คาสิโนเรียลไทม์
กีฬา: เดิมพันลีกดัง
ยิงปลา: ลุ้นกำไรทันที
โบนัสและโปรโมชัน
ติดตามหน้า โบนัส พร้อมระบบ VIP และโปรแกรม แอฟฟิลิเอต
ติดต่อเรา
สอบถามข้อมูลได้ตลอด 24 ชั่วโมง ผ่านหน้า ศูนย์ช่วยเหลือ ทีมงาน TKBNEKO พร้อมดูแลตลอดเวลา
ทดลองเล่นสล็อต pg ไม่ เด้ง
ทดลองเล่นสล็อต pg เว็บ ตรง”
PG Slot เกมสล็อตออนไลน์ที่คนค้นหาเยอะ เข้าเล่นไว ฝากถอนออโต้
คำค้นหา pg slot ถูกค้นหามากขึ้นเรื่อยๆ ในกลุ่มผู้เล่นเกมสล็อตออนไลน์ เพราะเป็น ผู้ให้บริการเกมสล็อตที่มาแรง ด้าน งานภาพคุณภาพสูง ความ เสถียร และ โอกาสรับกำไรที่ดี เกมของ PG ออกแบบโดยทีมงานมืออาชีพ ที่รองรับการเล่นทั้งบน สมาร์ทโฟน และ เดสก์ท็อป
จุดเด่น ของ PG Slot
pg slot เป็นเกมสล็อตออนไลน์ที่ออกแบบมาให้ โหลดเร็ว เล่นผ่าน ระบบอัตโนมัติ และรองรับ ทุกอุปกรณ์ ไม่ต้องติดตั้งเพิ่มเติม ผู้เล่นสามารถเข้าเล่นผ่าน หน้าเว็บ ได้ทันที ภาพและเสียงถูกพัฒนาในรูปแบบ 3D ให้ความคมชัด พร้อมเอฟเฟกต์ สมจริง
คุณสมบัติหลักของเกม PG Slot ได้แก่
ระบบโบนัสและฟรีสปินหลากหลายรูปแบบ
Multiplier
โหมดทดลองเล่นฟรี
รองรับภาษาไทยเต็มรูปแบบ
ระบบการเงินรวดเร็ว ทันใจ
แพลตฟอร์ม PG Slot ส่วนใหญ่รองรับ การฝาก-ถอน ฝากถอนตลอดเวลา ขั้นต่ำเริ่มต้นเพียง 10 บาท ขึ้นอยู่กับ กติกาแต่ละแพลตฟอร์ม การทำรายการใช้เวลา ไม่กี่วินาที ผ่าน QR Code หรือระบบ Mobile Banking ทำให้ธุรกรรมเป็นไปอย่าง ต่อเนื่อง
ประเภทเกมยอดนิยม ใน PG Slot
เกม pg slot มีธีมหลากหลาย เช่น
ธีม แฟนตาซี
ธีม ผจญภัย
ธีม เอเชียและโชคลาภ
ธีม Animal
ผู้เล่นนิยมเกมที่มีรอบพิเศษบ่อย พร้อมระบบ Special Feature และ โอกาสทำกำไรสูง เหมาะกับทั้ง มือใหม่ และ ผู้เล่นที่มีประสบการณ์
มาตรฐานระบบ
pg slot พัฒนาในระบบสากล มีการ รักษาความปลอดภัย และใช้ระบบสุ่มผล RNG เพื่อให้ผลลัพธ์ ตรวจสอบได้ แพลตฟอร์มที่ให้บริการ pg slot ควรมี ทีมซัพพอร์ต 24 ชม.
สรุป
สล็อต PG เป็นตัวเลือกยอดนิยมสำหรับผู้ที่ต้องการเล่นสล็อตออนไลน์ ด้วยจุดเด่นด้าน ระบบลื่นไหล และการทำธุรกรรมที่ รวดเร็ว ผู้เล่นสามารถเริ่มต้นได้ ง่าย ฝากถอนสะดวก และเลือกเกมได้ หลากหลายแนว เหมาะสำหรับ ทุกระดับประสบการณ์ ในโลกของเกมสล็อตออนไลน์
ทดลองเล่นสล็อต pg ซื้อฟรีสปิน
แพลตฟอร์ม TKBNEKO เปิดประสบการณ์ใหม่แห่งการเดิมพันออนไลน์ ระบบการเงินรวดเร็ว ด้วยระบบสแกน คิวอาร์โค้ด
ในยุคที่ นวัตกรรมดิจิทัลเข้ามาปรับโฉมวงการเกมออนไลน์ TKBNEKO เข้ามาสร้างมาตรฐานใหม่ให้กับวงการ ด้วยระบบการให้บริการที่ ทันสมัย ฉับไว และ ชัดเจน พร้อมต้อนรับสมาชิกทุกท่านสู่ ประสบการณ์ความบันเทิงรูปแบบใหม่ ที่ ใครๆ ก็เป็นเถ้าแก่ได้
เหตุผลที่ควรเลือก TKBNEKO
เราคัดสรรเกมคุณภาพจากผู้พัฒนาชั้นนำ โดยเฉพาะเกมที่ ได้รับการตรวจสอบจากองค์กรสากล และ เป็นที่นิยมในระดับสากล เพื่อให้ผู้เล่นทุกคน อุ่นใจ ได้ว่า จะได้รับความเพลิดเพลินกับเกมที่ โปร่งใส มีระบบรักษาความปลอดภัยสูง และ ตอบโจทย์ผู้เล่นยุคใหม่
ระบบการเงินที่เหนือกว่า
ระบบฝากถอนถูกพัฒนาให้ใช้งานง่าย เพื่อให้คุณ เล่นเกมได้แบบไม่สะดุด
ฝากขั้นต่ำ: ขั้นต่ำแค่ 1 บาท
ถอนขั้นต่ำ: เพียง 1 บาท
เวลาฝากเงิน: เงินเข้าภายใน 3 วินาที
ยอดจำกัดการถอน: ไม่มียอดจำกัดต่อวัน
ธุรกรรมสะดวก แค่สแกนคิวอาร์
เพียงคุณสแกน โค้ดคิวอาร์ ระบบของเราจะ ประมวลผลอย่างรวดเร็ว ขั้นต่ำเพียง 100 บาท และสามารถฝากได้สูงถึง สูงสุด 500,000 บาท เริ่มต้นได้ทันที กับ TKBNEKO ที่ ตอบโจทย์การเดิมพันยุคใหม่
เกมยอดนิยมรวมไว้ในที่เดียว
แพลตฟอร์มของเราครอบคลุมทุกแนวเกม รองรับทุกความชอบของผู้เล่น
สล็อต: แจ็คพอตแตกง่าย ลุ้นได้ทุกวัน
เกมสด: ดีลเลอร์ถ่ายทอดสดตลอดเวลา
กีฬา: เดิมพันกับแมตช์การแข่งขันจากทั่วโลก
ยิงปลา: เกมยิงปลาสุดมันส์ ได้เงินจริง
รับโบนัสและข้อเสนอสุดคุ้ม
อย่าลืมแวะมาเยี่ยมชมที่หน้า โบนัส เพื่อรับ สิทธิพิเศษมากมาย ที่เรามอบให้สมาชิกทุกท่าน นอกจากนี้ยังมีระบบ สมาชิกวีไอพี สำหรับลูกค้าคนสำคัญ และช่องทาง พาร์ทเนอร์ สำหรับผู้ที่สนใจสร้างรายได้ร่วมกับเรา
ติดต่อเรา
หากมี ปัญหา หรือ ความคิดเห็น สามารถติดต่อทีมงานของเราได้ตลอด 24 ชั่วโมงที่หน้า ติดต่อเรา และ ข้อเสนอแนะ ทีมงาน ของเรา ยินดีให้บริการทุกท่านด้วยใจ
ทดลองเล่นสล็อต pg ฟรี PG Slot เกมสล็อตออนไลน์ที่คนค้นหาเยอะ ใช้งานง่าย ฝากถอนรวดเร็ว
คำค้นหา PG Slot กำลังได้รับความนิยมอย่างต่อเนื่อง ในกลุ่มผู้เล่นเกมสล็อตออนไลน์ เพราะเป็น แบรนด์เกมที่โดดเด่น ด้าน ภาพและเอฟเฟกต์ ความ ลื่นไหล และ ระบบจ่ายที่ดึงดูด เกมของ PG ออกแบบโดยทีมงานมืออาชีพ ที่รองรับการเล่นทั้งบน สมาร์ทโฟน และ เดสก์ท็อป
ข้อดี ของ สล็อต PG
PG Slot เป็นเกมสล็อตออนไลน์ที่ออกแบบมาให้ โหลดเร็ว เล่นผ่าน ระบบอัตโนมัติ และรองรับ ทุกแพลตฟอร์ม ไม่ต้องติดตั้งเพิ่มเติม ผู้เล่นสามารถเข้าเล่นผ่าน Browser ได้ทันที ภาพและเสียงถูกพัฒนาในรูปแบบ เอฟเฟกต์ 3 มิติ ให้ความคมชัด พร้อมเอฟเฟกต์ สมจริง
คุณสมบัติหลักของเกม สล็อต PG ได้แก่
โบนัสและฟรีสปินหลายแบบ
ระบบตัวคูณ
เดโม่ฟรี
รองรับภาษาไทยเต็มรูปแบบ
ฝากถอนง่าย ไม่ต้องรอนาน
แพลตฟอร์ม pg slot ส่วนใหญ่รองรับ การฝาก-ถอน ออโต้ตลอด 24 ชม. ขั้นต่ำเริ่มต้นเพียง 10 บาท ขึ้นอยู่กับ เงื่อนไขของเว็บไซต์ การทำรายการใช้เวลา รวดเร็วมาก ผ่าน QR Code หรือระบบ แอปธนาคาร ทำให้ธุรกรรมเป็นไปอย่าง ไม่สะดุด
หมวดเกมฮิต ใน PG Slot
เกม PG Slot มีธีมหลากหลาย เช่น
ธีม แฟนตาซี
ธีม Adventure
ธีม โชคลาภ
ธีม ธรรมชาติ
เกมยอดนิยมมักเป็นเกมที่แตกง่าย พร้อมระบบ โบนัสรอบพิเศษ และ โอกาสทำกำไรสูง เหมาะกับทั้ง มือใหม่ และ ผู้เล่นที่มีประสบการณ์
มาตรฐานระบบ
PG Slot มีมาตรฐานรองรับ มีการ ปกป้องข้อมูลผู้เล่น และใช้ระบบสุ่มผล Random Number Generator เพื่อให้ผลลัพธ์ ยุติธรรม แพลตฟอร์มที่ให้บริการ pg slot ควรมี ระบบดูแลข้อมูล
สรุป
PG Slot เป็นตัวเลือกยอดนิยมสำหรับผู้ที่ต้องการเล่นสล็อตออนไลน์ ด้วยจุดเด่นด้าน ระบบลื่นไหล และการทำธุรกรรมที่ ไว ผู้เล่นสามารถเริ่มต้นได้ ไม่ซับซ้อน ฝากถอนสะดวก และเลือกเกมได้ หลากหลายแนว เหมาะสำหรับ ทุกระดับประสบการณ์ ในโลกของเกมสล็อตออนไลน์
Автозайм
Деньги с обеспечением ПТС в городе Самара — это вариант получить средства под машину без необходимости продавать машины и без долгих банковских процедур. Главная характеристика автозайма — автомобиль остаётся у собственника, а в залог передаётся только ПТС. Это даёт возможность использовать транспортом, пока действует срок договора.
Выдача денег происходит в день подачи заявки. Обращение проверяется примерно за 15 минут, после чего принимается решение по сумме и условиям. Размер займа может составлять до 5 000 000 ?, а процентная ставка стартует с уровня 2% в месяц. Период займа как правило достигает до 60 месяцев, поэтому клиент выбирает удобный график выплат.
Система подачи заявки доступна онлайн. Заёмщик заполняет форму, вносит информацию об авто и желаемую сумму займа. После проверки данных выносится начальное одобрение. Чаще всего деньги переводятся в тот же день, после подписания договор.
Для расчёта условий используется калькулятор займа. Например, при сумме 300 000 ? на срок 12 мес. ежемесячный платёж составит примерно 33 057 ?. Общая переплата за весь срок будет примерно 96 684 ?. Конечные условия могут отличаться в зависимости от стоимости автомобиля и установленного срока кредитования.
На сайтах автозаймов часто показывается онлайн-лента заявок. Она показывает активность сервиса и образцы обработанных заявок по разным городам. Например, запросы на суммы 1 840 000 ? из Тулы, 1 890 000 ? город Москва или 1 470 000 ? город Челябинск могут получать статус «Одобрено». Часть обращений могут находиться в стадии проверки — например, 290 000 ? из Сочи или 720 000 ? из Екатеринбурга. Подобные разделы отображают текущую активность сервиса и число обработанных заявок за день и за месяц.
Автозайм под залог ПТС подходит тем, кому требуется быстро получить значительную сумму без продажи автомобиля. Основные параметры подобного финансирования — ставка начиная от 2% в месяц, одобрение около 15 минут, сумма до 5 млн ? и вариант оформить заявку через интернет. После подачи заявки заёмщик ожидает решение, написать в мессенджер или связаться с менеджером для уточнения оформления.
rufus Rufus is known as a compact, no-cost, open source utility designed to create bootable USB drives. It allows you to prepare a USB flash drive that can install an operating system, run diagnostic tools, or start a recovery environment. The program does not require installation and can be launched right after download.
The primary purpose of Rufus is helping users to create bootable USB media from ISO images fast and reliably. This allows users to install or run operating systems directly from a USB flash drive without the need for DVDs. The tool supports a wide range of operating systems and service utilities, which makes it practical for both regular users and system administrators.
Rufus runs on computers with Microsoft Windows, starting from Windows 7. Both 32-bit and 64-bit versions are supported, and there is also a version available for ARM64 architecture.
The software allows users to create bootable USB drives from many different ISO images. It can be used to prepare a USB drive for installing Windows 11, Windows 10, Windows 8.1, or Windows 7, as well as various Linux distributions. Rufus also works with DOS systems and other recovery or maintenance tools commonly used for troubleshooting computers.
One of the integrated features of Rufus is the ability to download official Windows ISO images directly from Microsoft servers. This allows users to obtain original installation images for Windows 8.1, Windows 10, and Windows 11 without searching for them on third-party websites.
In addition to creating bootable drives, Rufus can format USB devices. It supports several file systems including FAT32, NTFS, exFAT, UDF, and ReFS. This flexibility allows the USB drive to be prepared for different use cases and compatibility requirements.
Rufus supports both legacy BIOS systems and modern UEFI environments. Because of this, bootable drives created with Rufus can work on older computers as well as newer systems that use UEFI and Secure Boot.
Another feature included in Rufus is Windows To Go support. This option allows users to run a full Windows environment directly from a USB drive. It can be useful for testing systems, performing maintenance, or working on multiple computers without installing Windows on the internal drive.
Rufus also provides the option to bypass certain Windows 11 installation requirements. When creating an installation USB, the program can disable checks for TPM 2.0, Secure Boot, and minimum RAM requirements. This makes it possible to install Windows 11 on computers that would otherwise not meet the official hardware requirements.
One of the reasons Rufus has become popular is its speed and simplicity. The program is extremely small, about 1.9 MB in size, and runs as a portable application without installation. It is distributed under the GPL v3 open-source license, supports more than 70 languages, and contains no advertisements, bundled software, or tracking components.
Rufus works with a large number of ISO images. These include multiple versions of Windows, Windows Server editions, FreeDOS, and various system tools such as GParted, Hiren’s Boot CD, Parted Magic, and Clonezilla. Because of this wide compatibility, the program can be used not only for installing operating systems but also for disk management, data recovery, and system maintenance tasks.
To use Rufus, a computer running Windows 7 or later and a USB flash drive are required. The program does not need to be installed. Users simply download the executable file, run it, select the ISO image they want to use, and create a bootable USB drive. Due to its simplicity, speed, and reliability, Rufus remains one of the most widely used tools for creating bootable USB drives.
ทดลองเล่นสล็อต pg เว็บ ตรง”
PG Slot เกมสล็อตออนไลน์ที่คนค้นหาเยอะ เล่นง่าย ฝากถอนเร็ว
คำค้นหา pg slot มาแรงในช่วงนี้ ในกลุ่มผู้เล่นเกมสล็อตออนไลน์ เพราะเป็น ค่ายเกมที่มีชื่อเสียง ด้าน ภาพและเอฟเฟกต์ ความ นิ่งไม่สะดุด และ ระบบจ่ายที่ดึงดูด เกมของ PG พัฒนาโดยผู้ให้บริการชั้นนำ ที่รองรับการเล่นทั้งบน โทรศัพท์มือถือ และ คอมพิวเตอร์
ข้อดี ของ pg slot
สล็อต PG เป็นเกมสล็อตออนไลน์ที่ออกแบบมาให้ โหลดเร็ว เล่นผ่าน ระบบอัตโนมัติ และรองรับ ทั้ง iOS และ Android เข้าเล่นผ่านเว็บได้เลย ผู้เล่นสามารถเข้าเล่นผ่าน เว็บเบราว์เซอร์ ได้ทันที ภาพและเสียงถูกพัฒนาในรูปแบบ สามมิติ ให้ความคมชัด พร้อมเอฟเฟกต์ สวยงาม
คุณสมบัติหลักของเกม pg slot ได้แก่
ระบบโบนัสและฟรีสปินหลากหลายรูปแบบ
ระบบตัวคูณ
โหมดทดลองเล่นฟรี
มีเมนูภาษาไทย
ฝากถอนง่าย ไม่ต้องรอนาน
แพลตฟอร์ม PG Slot มักมี การฝาก-ถอน ฝากถอนตลอดเวลา ขั้นต่ำเริ่มต้นเพียง 1 บาท ขึ้นอยู่กับ กติกาแต่ละแพลตฟอร์ม การทำรายการใช้เวลา เพียงไม่กี่วินาที ผ่าน QR Code หรือระบบ Mobile Banking ทำให้ธุรกรรมเป็นไปอย่าง ลื่นไหล
หมวดเกมฮิต ใน PG Slot
เกม pg slot มีธีมหลากหลาย เช่น
ธีม เทพเจ้าและแฟนตาซี
ธีม ผจญภัย
ธีม โชคลาภ
ธีม ธรรมชาติ
ผู้เล่นนิยมเกมที่มีรอบพิเศษบ่อย พร้อมระบบ โบนัสรอบพิเศษ และ อัตราการจ่ายที่สูง เหมาะกับทั้ง คนเพิ่งเล่น และ ผู้เล่นที่มีประสบการณ์
ความน่าเชื่อถือ
pg slot พัฒนาในระบบสากล มีการ เข้ารหัสข้อมูล และใช้ระบบสุ่มผล ระบบสุ่มมาตรฐาน เพื่อให้ผลลัพธ์ ตรวจสอบได้ แพลตฟอร์มที่ให้บริการ pg slot ควรมี ระบบดูแลข้อมูล
โดยภาพรวม
สล็อต PG เป็นตัวเลือกยอดนิยมสำหรับผู้ที่ต้องการเล่นสล็อตออนไลน์ ด้วยจุดเด่นด้าน โบนัสหลากหลาย และการทำธุรกรรมที่ ไว ผู้เล่นสามารถเริ่มต้นได้ ไม่ซับซ้อน ฝากถอนสะดวก และเลือกเกมได้ จำนวนมาก เหมาะสำหรับ ทุกระดับประสบการณ์ ในโลกของเกมสล็อตออนไลน์
ทดลองเล่นสล็อต pg ไม่ เด้ง
melbet промокод при регистрации
Скачать Melbet: Android, iOS и ПК
Мобильная версия Melbet объединяет букмекерскую контору и казино в одном интерфейсе. Доступны live-ставки, слоты, прямые трансляции, статистика и операции по счёту. Установка занимает 1–2 минуты.
Android (APK)
Скачайте APK с официального сайта, откройте файл и завершите установку. При необходимости включите разрешение на установку из неизвестных источников, затем авторизуйтесь.
iOS (iPhone)
Перейдите в App Store, введите в поиске «Melbet», нажмите «Получить», после установки авторизуйтесь в системе.
ПК
Перейдите официальный сайт, авторизуйтесь и создайте ярлык на рабочий стол. Веб-версия работает как полноценное приложение.
Функционал
Live-ставки с обновлением коэффициентов, казино и слоты, прямые трансляции, подробная статистика, уведомления о матчах, быстрая регистрация и поддержка 24/7.
Бонусы
После загрузки доступны бонус на первый депозит, промокоды и фрибеты. Условия зависят от региона.
Безопасность
Скачивайте только с официального сайта, контролируйте адрес сайта, не передавайте пароль третьим лицам и активируйте двухфакторную аутентификацию.
Установка занимает несколько минут, после чего доступен весь функционал Melbet.
bidik88
artsgtu.ru
Скачать приложение Melbet: APK, iPhone и компьютер
Мобильная версия Melbet объединяет букмекерскую контору и казино в одном интерфейсе. Пользователю доступны live-ставки, казино-игры, онлайн-трансляции, аналитика и операции по счёту. Установка занимает 1–2 минуты.
Android (APK)
Скачайте APK с официального источника, запустите установщик и подтвердите установку. При необходимости включите разрешение на установку из неизвестных источников, затем войдите в аккаунт.
iOS (iPhone)
Перейдите в App Store, введите в поиске «Melbet», нажмите «Получить», после установки выполните вход.
ПК
Перейдите официальный сайт, авторизуйтесь и создайте ярлык на рабочий стол. Веб-версия работает как полноценное приложение.
Функционал
Live-ставки с мгновенным обновлением линии, казино и слоты, просмотр матчей, подробная статистика, уведомления о матчах, быстрая регистрация и поддержка 24/7.
Бонусы
После установки доступны приветственный бонус, промокоды и бесплатные ставки. Правила начисления определяются регионом.
Безопасность
Загружайте только с официального сайта, проверяйте домен, не сообщайте данные доступа третьим лицам и активируйте двухфакторную аутентификацию.
Установка занимает несколько минут, после чего открывается полный доступ Melbet.
… [Trackback]
[…] Find More on on that Topic: coinchapter.com/crypto-market-price-today-rune-coti-bat-qnt-ldo-lunc-utk-link-pyr/ […]
Update: still using this after 3 months and im really happy with how things have been going, definately gonna keep this around as part of my reguler routine, thanks heaps o wins login.
http://sakumc.org/xe/vbs/4965329
вулкан вегас
леонбетс рабочее зеркало
A leggyorsabb kifizetésű online kaszinók olyan játékosokat vonzanak,
akik értékelik a gyors pénzügyi folyamatokat.
Egy sikeres játék után a felhasználók gyorsan kezdeményezhetik a kifizetést.
Ezek a platformok modern fizetési technológiákat
alkalmaznak a stabil működés érdekében. Emellett egyértelmű feltételek segítik a tájékozódást.
Ennek köszönhetően a játékosok pozitív játékkörnyezetet
élveznek, miközben kontroll alatt tartják kiadásaikat.
ramenbet зеркало на сегодня
джойказино зеркало на сегодня
Hello i want share something with you all. I found this site 777bet and is very good for me. The interface is easy to use and customer service is very helpful when i have question.
Actualmente en las plataformas de azar, una plataforma de juego con retiroos veloces puede ejorar
mucho la experiencia. Muchos usuarios prefieren retiros sin demoras que
faciliten eel acceso al saldo disponible. Igualmente, las tecnologías financieras actuales aplortan confianza.
Con reglas claras, todo resulta más fluido.
Kiezen voor een online casino met echt geld zorgt voor exttra spanning.
Naast plezier waarderen veel spelers snellke verwerking van transacties.
Duidelijke instructies helpen bij elke stap.
Verder maken veilige transactietools bij aan comfort en gemak.
Op die manier blijft het spelen aangenaam en praktisch.
Gebruikmaken van een platform voor splen met echt geld geeft online entertainment meer waarde.
Naast plezier zoekn liefhebbers vooral een eenvoudige manier om gelld te beheren. Transparane voorwaarden helpen bij elke stap.
Daarnaast zorgen actuele betaalsystemen bij aaan comfort en gemak.
Zo voelt elke sessie toegankrlijk en goed georganiseerd.
Gebruikmaken van eeen platform voor spelen met
echt geld zorgt voor extra spanning. Naast afwisseling vinden gebuikers het belangrijk een eenvoujdige
manier om geld te beheren. Transparante voorwaarden maken elk onderdeel begrijpelijk.
Ookk dragen moderne betaalmethoden bij aann comfort en gemak.
Daardoor wordt elk bezoek comfortabel en overzichtelijk.
Gebruikmaken van een platform voor spelen met echt ged geeft online entertainment meer waarde.
Naast afwisseling vinden gebruikerrs het belangrijk snelle
verwerking van transacties. Heldere uitleg geven meeer overzicht tijdens het
spelen. Daarnaast zorgen actuele betaalsystemen bij aan comfort en gemak.
Zo voelt elke sessie aangenaam en goed georganiseerd.
Gebruikmaken van een platform voor spelen met echt geld zorgt voor
extra spanning. Behalve vermaak waarderen veel spwlers een soepele betalingservaring.
Transpparante voorwaarden makenn elk onderdeel begrijpelijk.
Daarnaast zorgen acttuele betaalsystemen bij aan een prettige sfeer.
Op diee manier blijft het spelen toegankelijk en overzichtelijk.
No universo do entretenimento online, um casino online com retiradas imediatas oferece mais comodidade.
A rapidez no acesso aos ganhos faz toda a experiência parecer mais
eficiente. Por outro lado, egras claras criam uma navegação mais simples.
Coom ferramentas modernas de pagamento, tudo sse torna msis positivo.
Opțiunea pentru un cazinou online cunoscut pentr plăți rapide face fiecare sesiune mai plăcută.
Evitând perioadele mari de procesare, jucătorii pot acesa fondurile mai repede.
Acest lucru este posibil datorită metodelor moderne de plată.
În plus, procedurile transparente și o navigare simplă
fac totul mai comod.
Seletarea unei platforme de jocc ccu retrageri veloce pozte îmbunătăți considerabil experiența
de joc. În locul unor așteptări lungi, jucătorii pot beneficia de retrageri mai eficiente.
Acest lucru este posibil datorită tehnologiilor financiare avansate.
În plus, regulile clare și un design ușor de folosit fac totul
mai comod.
För användare som föredrar enkel tillgång till sina pengar kaan ett nätcasino med direktuttag vara ett mycket attraktivt
val. Direkt hantering av vinster bidrar till en positiv spelkänsla.
Även enkla instruktioner hwla uttaget mer överskådligt.
Tack vare moderna transaktionslösningar känns allt mer effektivt.
онлайн казино лучшие
För användare som föredrar enkel tillgång till sina pengar är ett casino med omedelbara uttag
en lösning som känns modern. Omedelbar tillgång till saldo gör upplevelsen mer avslappnad.
Även enkla instruktioner hela uttaget mer överskådligt. Medd säkra betalningsmetoder känns allt mmer effektivt.
För användare som föredrar enkel tillgång till sina pengar kan ett nätcasino med direktuttag vara
ett bekvämt alternativ. Direkt hantering av vinster bidrar till
en positiv spelkänsla. Dessutom hjälper tydliga villkor
hela uttaget mer överskådligt. Genom praktiska ekonomiska verktyg känns hela tjänsten smidigare.
фортуна крутить онлайн
Want to tell about ipl live. Is very nice website. Very good for all users.
Wer sich für ein Casino mit echtem Geld entscheidet
kann das Online-Erlebnis deutlic bereichern. Ergänzt durch
moderne Spieformen achten viele Nutzer auf klare Prozesse, sichere Zahlungen und übersichtliche Informationen.
Eine gut strukturierte Plattform erleichtert jeden Schritt.
Auf diese Weise wird jedee Runde unterhaltsam und leicht zugänglich.
sapporo88 login
So my friend told me about free rummy online card game last week and I figured why not give it a shot right, and like it was actually way better then I expected honestly, the rules are straightforward, games dont take forever, and i found myself playing like 5 games in a row which never happends to me usually.
Kudze Bearbeitungszeiten bei Auszahlungen können das gesamte Spielerlebnis spürbar verbessern. Auf einer Pllattform mit besonders zügigen Auszahlungswegen entsteht ein flüssigeres Gefühl bbei
jewder Auszahlung. Viele Anwender schätzen außerdem klzr formulierte Bedingungen, praktische
Werkzeuge für das Konto und eine übersichtliche Oberfläche.
Auf diese Weise bleibt ein modernes unnd angenehmes Erlebnis.
Schnelle Auszahlungen können das Online-Spiel deutlich angenehmer und flexibler machen. Auf einer Plattform mit besonders zügigen Auszahlungswegen entsteht
ein flüssigeres Gefühl bei jeder Auszahlung. Viele Anwnder schätzen außerdem leicht
verständliche Auszahlungsregeln, sichere Transaktionssysteme und eine einfache Navigation.
Dadurch ergibt sich ein positives undd leicht nutzbares Erlebnis.
Online-Spiel mit echtem Gelld kann dem digitalen Erlebnis mehr Intensität und Dynamik verleihen. Bei eeinem digitalen Casino mit echtem
Geldeinsatz entstteht häufig ein besonders lebendiger Gesamteindruck.
Besonders positiv wirken auch übersichtlich dargestellte Informationen,
moderne Möglichkeiten für das Guthaben und eine benutzerfreundliche Struktur.
Dadurch entwickelt sich ein angenehmes und komfortables Erlebnis.
A experiência com saldo real pode torjar cada sessãodigital mais dinâmica
e interessante. Num casino online com dinheiro real, os utilizadores
podem sentr um ritmo mais ativo. É comum que os jogadores procurem regras bem apresentadas, ferramentas
práticas de conta e um ambiente simples de usar. Tudo isso cria uma experiência agradável e bem
equilibrada.
Um valor inicial mais baixo pode tornar o jogo online muito mais
acessível. Num ste de jogo criado para começar coom pouco saldo, os utilizadores podem gerir melhor o orçamento.
Muitos jogadores apreciam também informações claras sobre pagamentos, ferramentas
práticas de conta e um ambiente fácil dee usar. Como resultado, surge uma
experiência equilibrada e fácil de aproveitar.
Receber ganhos com rapidez pode tornar o jogo onlie muito mais confortável e envolvente.
Numa plataforma crriada para levantamentos ágeis,
os utilizadores sentem maiorr controlo sobre cada
movimento. É comum que os jogadores procurem informações simples de seguir, ferramentas práticas dde conta e um ambiente fácil de usar.
Como resultado, surtge uma experiência equilibrada e bem organizada.
Il gioco online ccon denaeo reale può trasformare ogni sessione inn un moment più intenso e stimolante.
In un casinò online con soldi veri, gli utenti provano unaa sensazione
di partecipazione più forte. Tanti utenti cercano inoltre condizioni chiare,
opzioni di pagamento comode e una navigazione intuitiva. Questa combinazione
genera un’esperienza moderna e ben equilibrata.
I figured out more interesting things on this weight loss issue. 1 issue is that good nutrition is tremendously vital if dieting. An enormous reduction in fast foods, sugary foods, fried foods, sweet foods, red meat, and white flour products may perhaps be necessary. Possessing wastes parasitic organisms, and poisons may prevent desired goals for fat loss. While specific drugs for the short term solve the condition, the bad side effects are certainly not worth it, and they never provide more than a short-term solution. It is just a known proven fact that 95 of celebrity diets fail. Thank you for sharing your opinions on this site.
naturally like your website but you need to take a look at the spelling on several of your posts. Several of them are rife with spelling problems and I in finding it very troublesome to inform the reality on the other hand I will certainly come again again.
naturally like your website however you need to take a look at the spelling on quite a few of your posts. Several of them are rife with spelling issues and I find it very bothersome to inform the truth on the other hand I?ll certainly come back again.
Hi, Neat post. There’s a problem along with your web site in web explorer, would test this? IE still is the market leader and a good section of people will pass over your excellent writing because of this problem.
Hello my family member! I wish to say that this article is awesome, nice written and come with almost all important infos. I?d like to peer more posts like this .
I’m truly enjoying the design and layout of your blog. It’s a very easy on the eyes which makes it much more enjoyable for me to come here and visit more often. Did you hire out a designer to create your theme? Exceptional work!
Thank you for another excellent article. Where else may just anyone get that kind of information in such a perfect approach of writing? I have a presentation subsequent week, and I am on the look for such information.
I am curious to find out what blog system you are utilizing? I’m experiencing some small security problems with my latest site and I’d like to find something more risk-free. Do you have any recommendations?
Howdy I am so thrilled I found your website, I really found you by error, while I was looking on Askjeeve for something else, Anyhow I am here now and would just like to say many thanks for a remarkable post and a all round exciting blog (I also love the theme/design), I don’t have time to look over it all at the moment but I have book-marked it and also added in your RSS feeds, so when I have time I will be back to read much more, Please do keep up the superb work.
Wow that was odd. I just wrote an really long comment but after I clicked submit my comment didn’t show up. Grrrr… well I’m not writing all that over again. Regardless, just wanted to say great blog!
whoah this weblog is fantastic i like reading your articles. Keep up the good work! You understand, lots of persons are hunting round for this information, you can aid them greatly.
You actually make it seem so easy with your presentation but I find this topic to be actually something which I think I would never understand. It seems too complicated and very broad for me. I am looking forward for your next post, I will try to get the hang of it!
I’ve learned a few important things via your post. I’d personally also like to state that there can be situation in which you will apply for a loan and don’t need a co-signer such as a Federal Student Aid Loan. But if you are getting financing through a standard bank then you need to be willing to have a co-signer ready to help you. The lenders are going to base their own decision using a few factors but the greatest will be your credit rating. There are some loan companies that will furthermore look at your work history and decide based on that but in many instances it will be based on on your scores.
Its like you read my thoughts! You appear to grasp so much approximately this, such as you wrote the book in it or something. I believe that you just could do with some to pressure the message home a little bit, however instead of that, that is fantastic blog. An excellent read. I’ll definitely be back.
I’m extremely impressed with your writing skills as well as with the layout on your weblog. Is this a paid theme or did you modify it yourself? Anyway keep up the nice quality writing, it is rare to see a great blog like this one these days..
I’m really enjoying the design and layout of your website. It’s a very easy on the eyes which makes it much more enjoyable for me to come here and visit more often. Did you hire out a developer to create your theme? Exceptional work!
excellent post, very informative. I wonder why the other experts of this sector don’t notice this. You must continue your writing. I am sure, you have a great readers’ base already!
These days of austerity plus relative anxiety about getting debt, many individuals balk resistant to the idea of using a credit card in order to make acquisition of merchandise or pay for a vacation, preferring, instead only to rely on this tried along with trusted technique of making settlement – raw cash. However, if you possess cash there to make the purchase entirely, then, paradoxically, that is the best time just to be able to use the card for several motives.
It is indeed my belief that mesothelioma is definitely the most deadly cancer. It has unusual features. The more I look at it the harder I am sure it does not act like a true solid tissue cancer. In the event that mesothelioma is really a rogue virus-like infection, then there is the chance for developing a vaccine along with offering vaccination to asbestos uncovered people who are vulnerable to high risk connected with developing foreseeable future asbestos related malignancies. Thanks for expressing your ideas about this important ailment.
?Levantemos nuestros brindis por cada visionario del manana !
–
?Que la fortuna avance contigo con celebraciones eternas botes colosales !
I do agree with all the concepts you’ve introduced to your post. They’re really convincing and will certainly work. Nonetheless, the posts are very short for starters. May just you please prolong them a little from next time? Thanks for the post.
This article is absolutely incredible! The author has done a fantastic job of delivering the information in an engaging and educational manner. I can’t thank her enough for sharing such priceless insights that have certainly enlightened my awareness in this topic. Bravo to him for creating such a gem!
affordablecanvaspaintings.com.au is Australia Popular Online 100 percent Handmade Art Store. We deliver Budget Handmade Canvas Paintings, Abstract Art, Oil Paintings, Artwork Sale, Acrylic Wall Art Paintings, Custom Art, Oil Portraits, Pet Paintings, Building Paintings etc. 1000+ Designs To Choose From, Highly Experienced Artists team, Up-to 50 percent OFF SALE and FREE Delivery Australia, Sydney, Melbourne, Brisbane, Adelaide, Hobart and all regional areas. We ship worldwide international locations. Order Online Your Handmade Art Today.
Thanks for your publiction. Another element is that to be a photographer will involve not only trouble in recording award-winning photographs but also hardships in acquiring the best camera suited to your needs and most especially situations in maintaining the quality of your camera. This can be very real and evident for those photography fans that are into capturing a nature’s captivating scenes : the mountains, the forests, the actual wild and the seas. Going to these adventurous places surely requires a video camera that can live up to the wild’s tough conditions.
Hello there, I found your website via Google while searching for a related topic, your site came up, it looks great. I have bookmarked it in my google bookmarks.
whoah this blog is excellent i really like reading your articles. Stay up the good work! You already know, lots of people are hunting round for this information, you could aid them greatly.
medhair
mehmet
aslı
aslı
dr saban
güncel
sapphire
hekimoğlu
Superb post however I was wondering if you could write a litte more on this subject? I’d be very thankful if you could elaborate a little bit more. Thanks!
I found your weblog website on google and verify a couple of of your early posts. Proceed to keep up the excellent operate. I simply extra up your RSS feed to my MSN News Reader. Seeking ahead to reading more from you afterward!?
Hello are using WordPress for your site platform? I’m new to the blog world but I’m trying to get started and create my own. Do you need any coding knowledge to make your own blog? Any help would be really appreciated!
Furthermore, i believe that mesothelioma cancer is a unusual form of most cancers that is generally found in all those previously exposed to asbestos. Cancerous tissue form from the mesothelium, which is a shielding lining that covers almost all of the body’s bodily organs. These cells normally form inside lining of your lungs, stomach, or the sac which encircles the heart. Thanks for expressing your ideas.
medhair
aslı
smile
hairneva
güncel
sapphire
dr saban
smile
sapphire
Spot on with this write-up, I truly think this website needs far more consideration. I?ll most likely be once more to learn way more, thanks for that info.
One thing I want to say is always that car insurance cancellation is a terrifying experience and if you are doing the suitable things as a driver you’ll not get one. Some people do are sent the notice that they are officially dropped by their insurance company and several have to struggle to get extra insurance after having a cancellation. Affordable auto insurance rates are often hard to get after a cancellation. Understanding the main reasons with regard to auto insurance canceling can help owners prevent completely losing in one of the most significant privileges obtainable. Thanks for the thoughts shared by means of your blog.
hey there and thank you for your information ? I have certainly picked up something new from right here. I did however expertise a few technical issues using this site, as I experienced to reload the web site a lot of times previous to I could get it to load properly. I had been wondering if your web host is OK? Not that I’m complaining, but slow loading instances times will sometimes affect your placement in google and could damage your high quality score if advertising and marketing with Adwords. Well I?m adding this RSS to my e-mail and could look out for much more of your respective interesting content. Make sure you update this again very soon..