
Key Takeaways:
- Stellar Lumens native token XLM is moving in an ascending triangle pattern on the daily charts.
- Moneygram and Stellar Development Foundation launched a live cash-in cash-out pilot in the US on Nov 17
NEW DELHI (CoinChapter.com) — Blockchain-based fintech firm Stellar Lumen’s native token, XLM, is currently moving in an ascending triangle pattern on the daily charts.
A horizontal trendline that connects swing highs and an ascending trendline connecting swing lows forms an ascending triangle pattern. Although breakout usually appears on the upside, it is possible to have a downside breakout from an ascending triangle pattern.
If prices break above the pattern, investors will set up a long position. However, if prices break below the lower tradeline, traders would set up a short trade. Volume helps determine if a breakout is strong. A breakout on the upside with low volume is very likely to fail, resulting in a pullback.
The height of the triangle helps calculate the price target from the point of the breakout.
Meanwhile, MoneyGram International, one of the largest international remittance services globally, launched a pilot project after partnering with Stellar Lumens in Oct. The partnership helps MoneyGram users to convert cash to USDC and vice versa.
XLM Price Charts
XLM is currently bearish across all time horizons, trading below its 50-day and 200-day moving average trendlines. Moreover, the Stellar Lumens token lost 8.88% last week. Thus, XLM prices are dangerously close to the lower trendline of the ascending triangle pattern.
Recommended: Stellar Lumens (XLM) adds 12% intraday gains buoyed by Stellar Next-Gen initiative launch.If XLM manages to reverse its current downtrend and breaks above the triangle pattern, it would likely result in an upside that would see XLM prices move to $0.6902, gaining 102%. However, given XLM’s current bearish outlook, a break below the ascending trendline is possible.
Such a downside move would result in a 76% loss from current prices, with prices moving to $0.081. XLM last touched this price level in late Nov 2020. As a result, a decline to this level would effectively pare XLM’s 2021 gains. XLM bulls would try to arrest the downfall before it reaches the downside target.
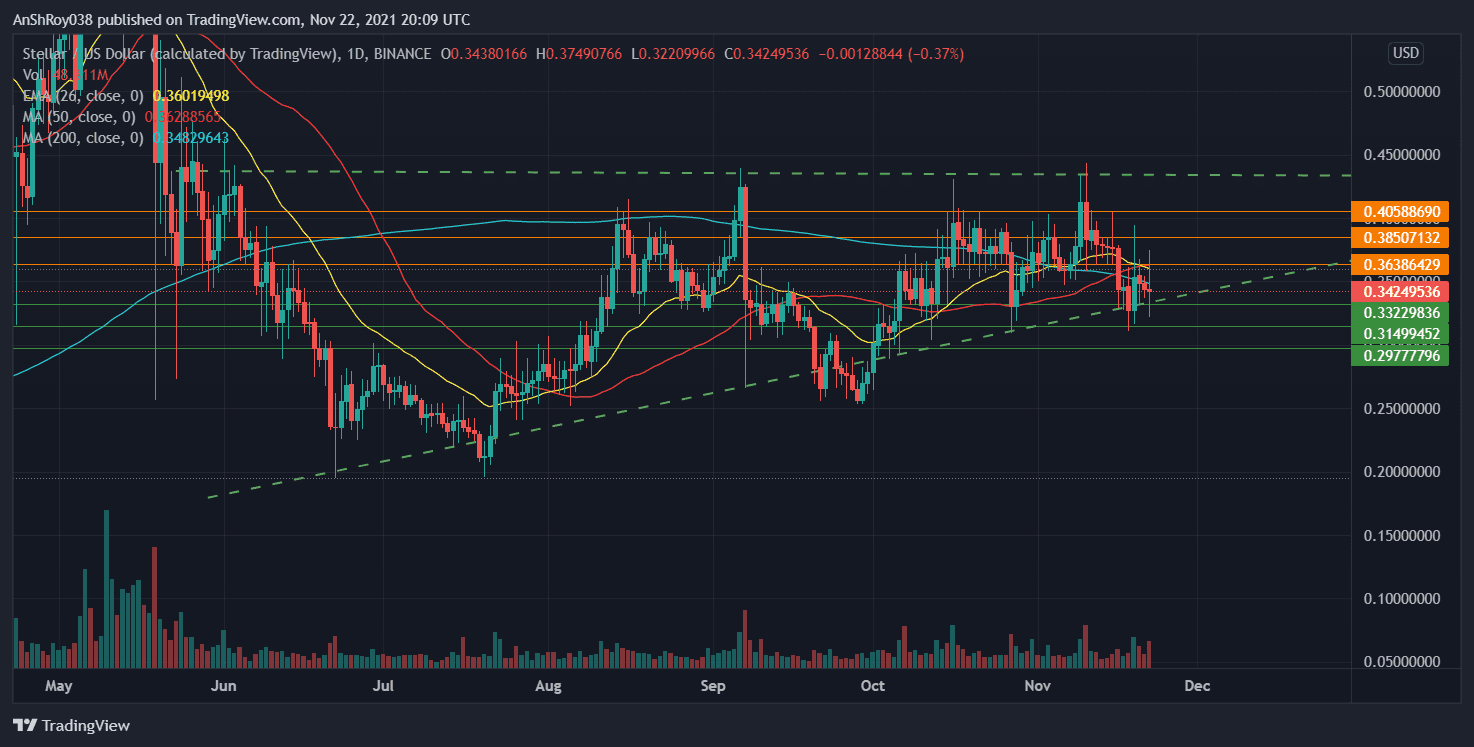
Currently, immediate resistance for XLM comes from a confluence of the token’s 50-day MA and 26-day EMA trendlines, near $0.3638. Thus, a clear break above immediate resistance might jump-start the bull run that XLM needs to break out of the chart pattern.
Further resistance for XLM’s upside movement is at $0.385. A sustained uptrend might bring prices to $0.405 before corrections pull prices down. On the other hand, immediate support for the Stellar Lumen’s token is at $0.332. A move below immediate support would result in XLM breaking below the chart pattern’s lower trendline.
As such, it could result in panic selling by retail traders, pushing prices down to $0.314. Marketwide sell-off could see the support at $0.2977 coming into play.
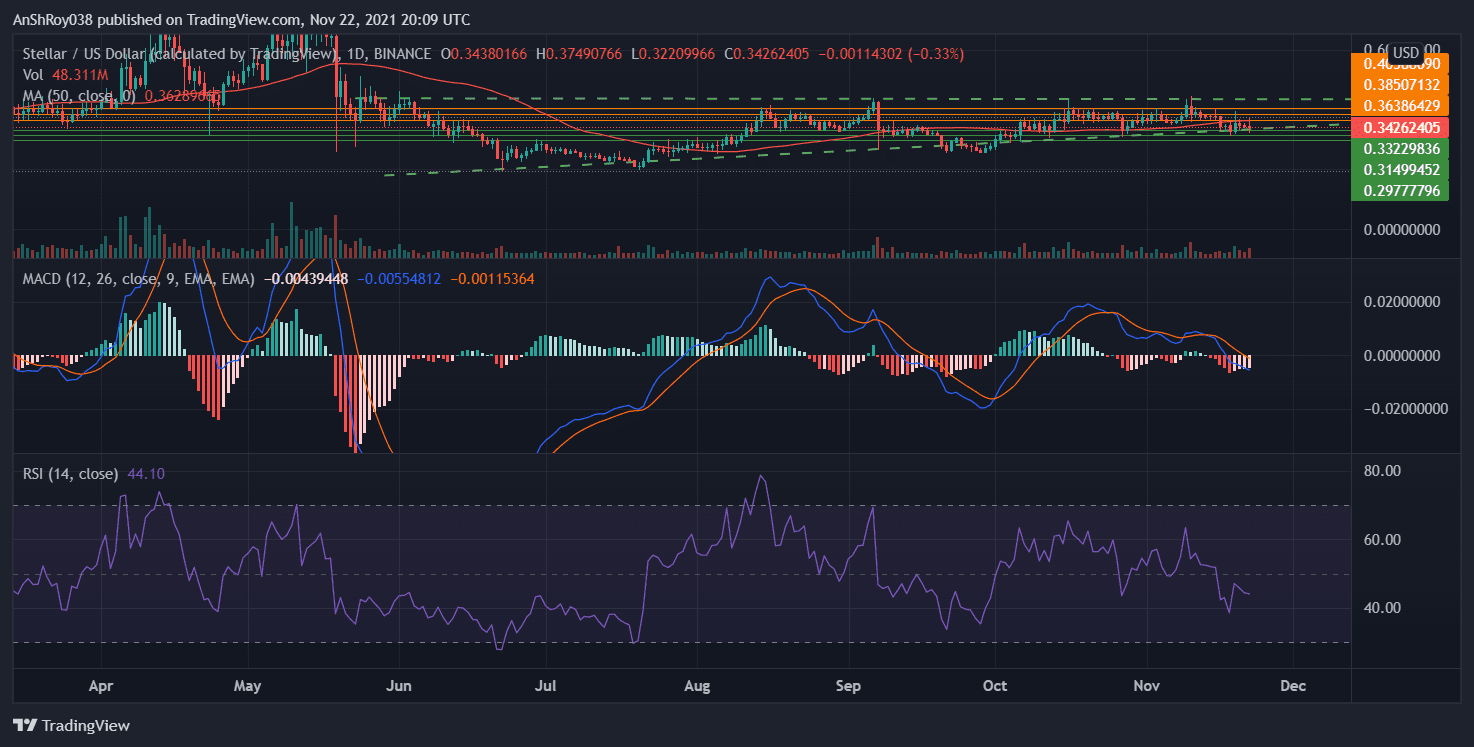
Trend-based momentum oscillator MACD continues to be bearish for XLM. However, MACD histogram bars indicate that the MACD line (difference of 12-day and 26-day EMA) is moving upwards towards the MACD signal line (9-day EMA of MACD). Thus, the histogram plots the difference between the MACD and its signal line.
In addition, the relative strength index for XLM is neutral, clocking 44.10, with the trendline moving downwards.
Stellar Lumens Fundamentals
Stellar Lumens’ USP lies in its ability to improve cross-border payments. Existing payment infrastructure takes up to a week to validate and settle any cross-border payments.
With Stellar, transaction times decrease drastically, with its developers claiming the network can handle 3,000 transactions per second (TPS). For perspective, Ethereum can handle 13 TPS at present. Furthermore, stellar converts fiat currency to XLM, transfers it to the desired location, and turns the XLM back into fiat currency.
Also Read: Goodbye Ripple, Hello Stellar: MoneyGram partners with XRP competitor to offer blockchain-based payments.Furthermore, the transaction takes 4-5 seconds and costs 0.00001 XLM.
In Oct this year, MoneyGram partnered with the Stellar Development Foundation to develop a payments bridge. Then, on Nov 17, the remittance firm launched a live cash-in cash-out pilot in the US.
As per Stellar’s announcement, participants can deposit cash into their digital wallets at select MoneyGram locations. In addition, the pilot project would also allow international payments via Stellar USDC.
Moreover, users can also exchange Stellar USDC for any fiat currency available on MoneyGram’s platform.
By integrating with Stellar, MoneyGram is offering its millions of users a local fiat entry into blockchain, providing those in emerging markets easier access to digital assets than ever before. This pilot is just the first of many steps to create greater access to the world’s financial system for everyone, regardless of where they are
Excerpt from Stellar’s announcementAt the time of writing, Stellar was trading at $0.3403, down 0.99% on the day.

… [Trackback]
[…] Read More on that Topic: coinchapter.com/downside-risks-mount-over-stellar-lumens-as-xlm-paints-bearish-continuation-pattern/ […]