

- Previously published MATIC technical setup playing out as discussed
- MATICUSDT pair extended declines below the $0.8 support
- Risks correcting down to $0.4
JAIPUR (Coinchapter.com) – Fears of high delta variant transmissibility proved accurate, with stocks and cryptocurrency markets incurring significant losses. MATIC, the native blockchain asset of the Ethereum layer 2 scaling solution Polygon, was not spared either.
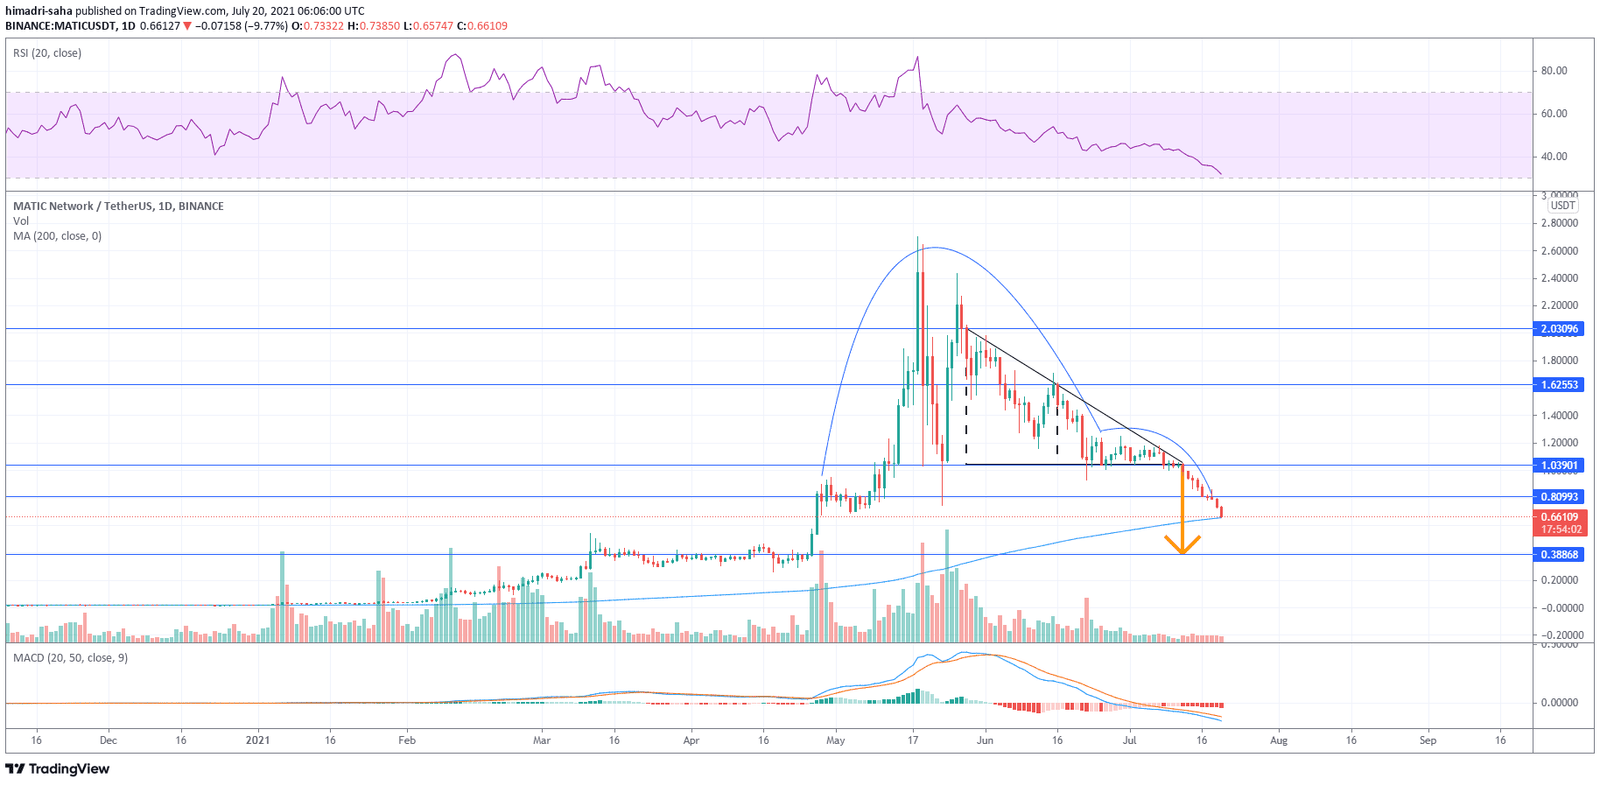
Owing to MATICUSDT’s drop below the $1 support, we delineated a bearish technical setup for the pair yesterday. One that predicts the Polygon native cryptocurrency dropping further below the $0.81 support. As of today, the structure is playing out as we forecasted.
Also Read: Polygon (MATIC) slips 23% below key support, more pain ahead if bulls don’t act soon
In the week spanning July 12 – July 18, MATIC corrected downwards by 23% from $1.05 to $0.81. After yesterday’s selling rout, the crypto asset has lost another 17% and fell below $0.67. It remains supported above the 200-day moving average (MA), but sell orders are piling up, indicating that another round of correction is round the corner.
The MATICUSDT pair has already extended declines to the tune of 40% below the $1 support. An extrapolation of the technical setup based on yesterday’s analysis points to MATIC spot rates declining to $0.4. The same points to another 22% correction from current spot rates. Which is roughly equivalent to the length of the perpendicular side of the descending triangle setup.
Also Read: Polygon bulls take a nap as a triangle setup threatens 50% MATIC price crash
MATIC’s Bearish Cycle
Apart from the technical setup discussed above, few other technical indicators point to MATIC’s ongoing bearish cycle. The most conspicuous one is the plunging RSI (Relative Strength Indicator) wave closely following the asset’s price action. Since May 26, MATIC’s RSI has been following a downward trajectory. It now looks to tap 30, the lowest level on the RSI band. It implies that investors do not have confidence in the crypto asset at the moment. And are looking to offload the majority of their holdings.
Also, the MACD indicator’s bearish wave is still on, which further points to aggressive downside pressure superseding upside attempts. There is a visible uptick in traders going short (with leverage) on MATIC at the moment. According to trading activity on the exchange FTX, MATICBULL, a 3X Long Matic token, has lost 27% on the day against the US dollar. While MATICBEAR2021, a 3X Short Matic token, has gained 27%.

… [Trackback]
[…] There you can find 36964 additional Information on that Topic: coinchapter.com/matic-risks-dropping-down-to-4-cents/ […]
… [Trackback]
[…] Here you can find 10350 additional Info on that Topic: coinchapter.com/matic-risks-dropping-down-to-4-cents/ […]
… [Trackback]
[…] Find More on that Topic: coinchapter.com/matic-risks-dropping-down-to-4-cents/ […]