
Yerevan (CoinChpater.com) – Quant Network (QNT), a distributed ledger technology (DLT) interoperability system, jumped in price by 57 percent, establishing a new all-time high of $150.4, before correcting down. QNT/USD exchange rate slid to $129.1 ahead of the New York session Thursday. The Binance exchange listing Quant news on July 29 fueled the uptrend and boosted the price significantly.
QNT’s new listing
Binance tweeted the news, providing a few details for its users concerning Quant and Clover Finance, which was listed the same day.
Binance is the largest crypto exchange to date, with a daily trading volume of approximately $18 billion. The news is much welcome for Quant, as a significant listing brings the 59th token by market cap ($1.5 billion) closer to the users to purchase and trade. The exposure subsequently boosts the price, as the QNT daily chart displayed.
Also read: Clover Finance’s CLV swells 60% following high-profile crypto exchange listings.
Daily chart technicals
QNT traded in a rising wedge formation from mid-May to mid-July. The construction consisted of two converging trendlines, enclosing the price action and driving it up. However, the rising wedge is a reversal pattern that shifts the momentum after it is exhausted. Fulfilling the prediction, QNT left the pattern on July 12 only to go into a bearish correction.
The digital asset retested the 50-day simple moving average (SMA-50; red wave) as support and took off in an uptrend, possibly following Bitcoin’s example. The copycat rally initiated on July 21, the day the alpha crypto shot towards the $40,000 benchmark.
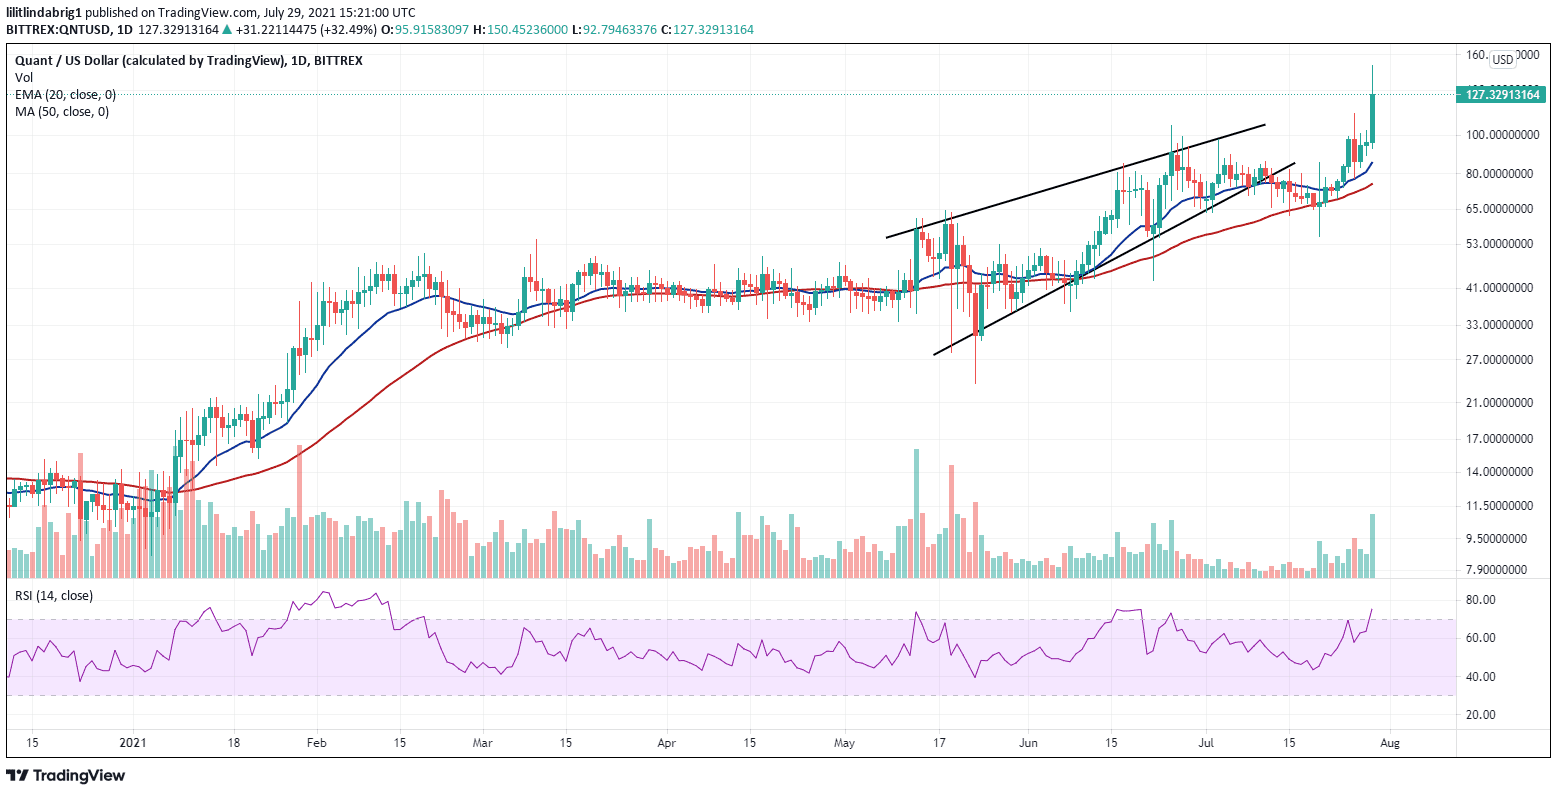
Although the QNT rally halted for a while, the Binance listing news came in time to save the Quant bulls. It drove the price to an all-time high, way above the 20-day exponential moving average (EMA-20; blue wave).
The buying spree also drove the relative strength index (RSI; purple graph at the bottom of the chart) to 76. Generally, an RSI north of 70 could be a red flag for traders as they start to consider the token overbought and choose to pull back to secure their assets.
Also read: 3 crypto assets that beat Dogecoin in 2021 without Elon Musk’s help.
What’s next for Quant?
While the largest crypto exchange helped considerably boost QNT, the bullish price action was initiated before the listing, following a ubiquitous recovery led by Bitcoin. Should this correlation prove relevant in the future, Quant could face further gains through the recently gained exposure and riding the recovery wave.
There are no resistance/support lines anywhere near the current value, as Quant has a newly conquered peak. However, should the price slide south, it will retest the EMA-20 and the SMA-50. Both those indicators could provide additional support for the cryptocurrency. The high RSI is also indicative of a possible bearish correction.
Also read: Biden administration wants to tax crypto investors to fund $550B infrastructure project.

… [Trackback]
[…] Here you will find 75434 more Info to that Topic: coinchapter.com/quant-network-jumps-57-after-binance-lists-qnt/ […]
… [Trackback]
[…] Information on that Topic: coinchapter.com/quant-network-jumps-57-after-binance-lists-qnt/ […]