
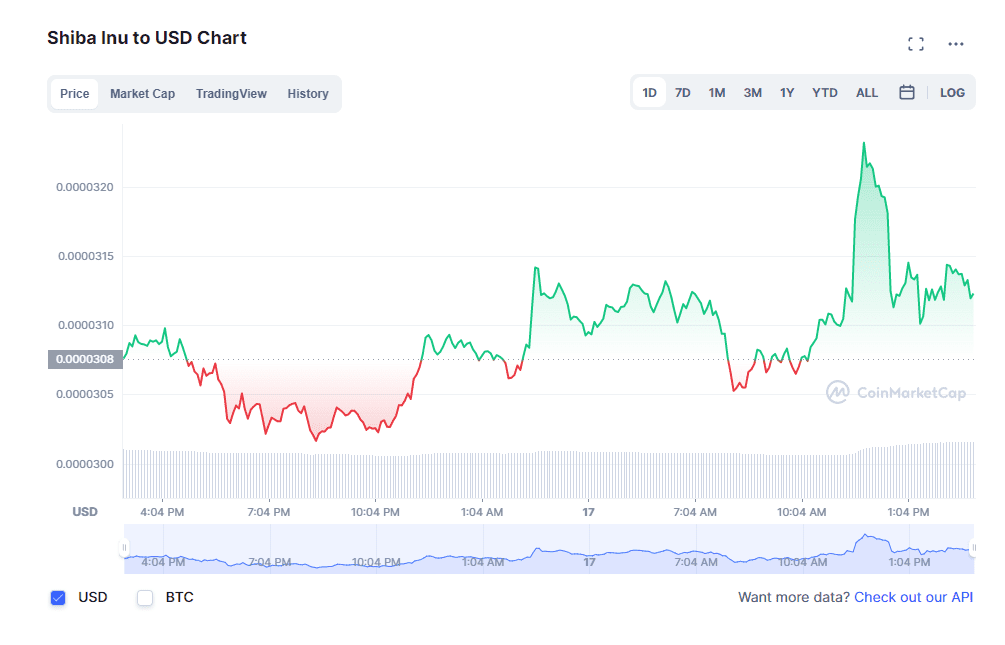
YEREVAN (CoinChapter.com) – Meme coin Shiba Inu’s native token SHIB traded at $0.00001658 on May 9, after catching the Bitcoin-led sell-off wave four days prior. The digital asset crashed through significant support near $0.000020 and threatened the SHIB bulls with a bearish continuation.
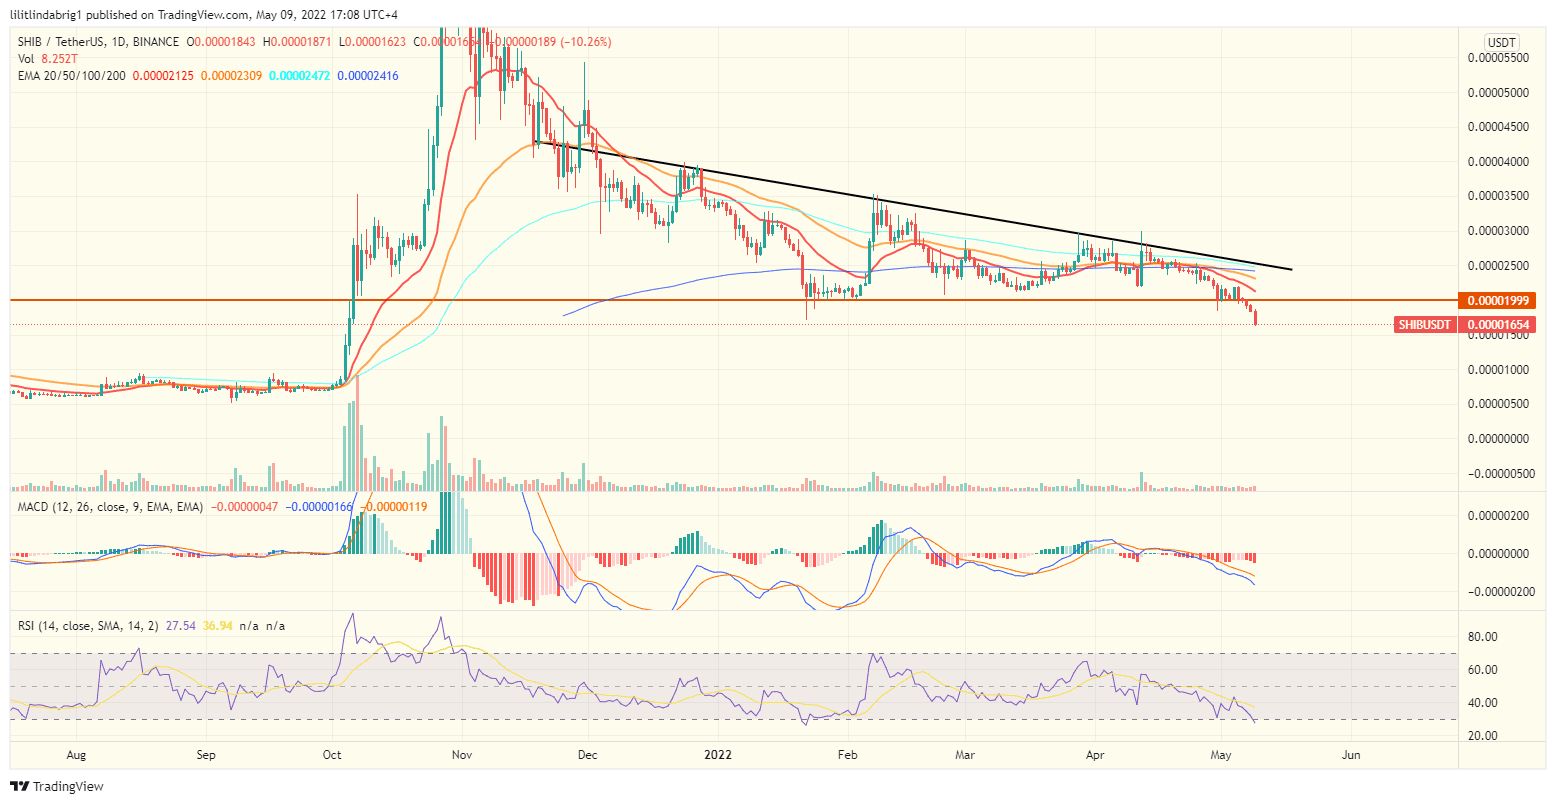
In detail, the SHIB/USD exchange rate formed a setup dubbed the Falling Triangle. The pattern consists of a resistance trendline with a negative slope and flat support that prevents breakdowns.
Also read: Ethereum Whales Stockpiling Shiba Inu, Apecoin, and other altcoins – On-Chain Data.
Shiba Inu’s daily chart bearish
Shiba Inu token exhausted the bearish setup and dropped to its lowest value since Oct. 2021, confirming the forecast. However, technicals suggest that a drop beyond 80% below the all-time high could be in the books.
For example, the trend-based oscillator MACD (red/green histogram at the bottom) hinted at a red continuation. Additionally, SHIB/USD price action witnessed a Death Cross between the 50-day exponential moving average (EMA-50; orange wave) and the EMA-200 (blue wave).
Also read: Terra makes ‘fishy’ attempts to maintain UST’s dollar peg as LUNA dips 25%.
The Death Cross occurs any time a short-term MA drops below a long-term MA. The formation results from the price action rather than a reason for it. However, the Death Cross typically signifies a bearish phase ahead as long as the formation persists.
Hope after all?
Conversely, SHIB’s relative strength index (RSI; the purple graph on the chart above) could boost the token as it entered the ‘oversold’ territory.
In detail, the RSI reflects traders’ expectations of a given asset. When it charts lower than 30, investors could see the fallen price as an opportunity to ‘buy the dip,’ subsequently boosting the value. Thus, SHIB bulls could take action and stabilize the decline.
Also read: Bitcoin (BTC) loses support and falls below $36K; where are the whales?
Despite the relatively good news from the RSI, SHIB’s price action bias remained bearish. However, Shiba Inu strived to evolve beyond its meme-coin status by introducing its Metaverse platform in the previous months. The latter announced a bid event for the land last month, but the token dropped despite the hype.

I am really impressed along with your writing abilities and also with the layout for your blog. Is this a paid subject or did you customize it your self? Either way stay up the nice quality writing, it’s rare to look a great blog like this one nowadays!
… [Trackback]
[…] Find More Information here to that Topic: coinchapter.com/shiba-inu-carnage-continues-as-shib-plunges-80-from-record-high-whats-next/ […]
… [Trackback]
[…] Here you can find 78829 more Info on that Topic: coinchapter.com/shiba-inu-carnage-continues-as-shib-plunges-80-from-record-high-whats-next/ […]
… [Trackback]
[…] Read More on on that Topic: coinchapter.com/shiba-inu-carnage-continues-as-shib-plunges-80-from-record-high-whats-next/ […]
… [Trackback]
[…] Info to that Topic: coinchapter.com/shiba-inu-carnage-continues-as-shib-plunges-80-from-record-high-whats-next/ […]
… [Trackback]
[…] Information on that Topic: coinchapter.com/shiba-inu-carnage-continues-as-shib-plunges-80-from-record-high-whats-next/ […]
… [Trackback]
[…] Read More on that Topic: coinchapter.com/shiba-inu-carnage-continues-as-shib-plunges-80-from-record-high-whats-next/ […]