

- Stellar’s XLM declined by 24% and is testing crucial support
- Trend bound within a descending channel pattern since May crash
- Renewed buying pressure could push prices up by 25% to $0.324 and beyond
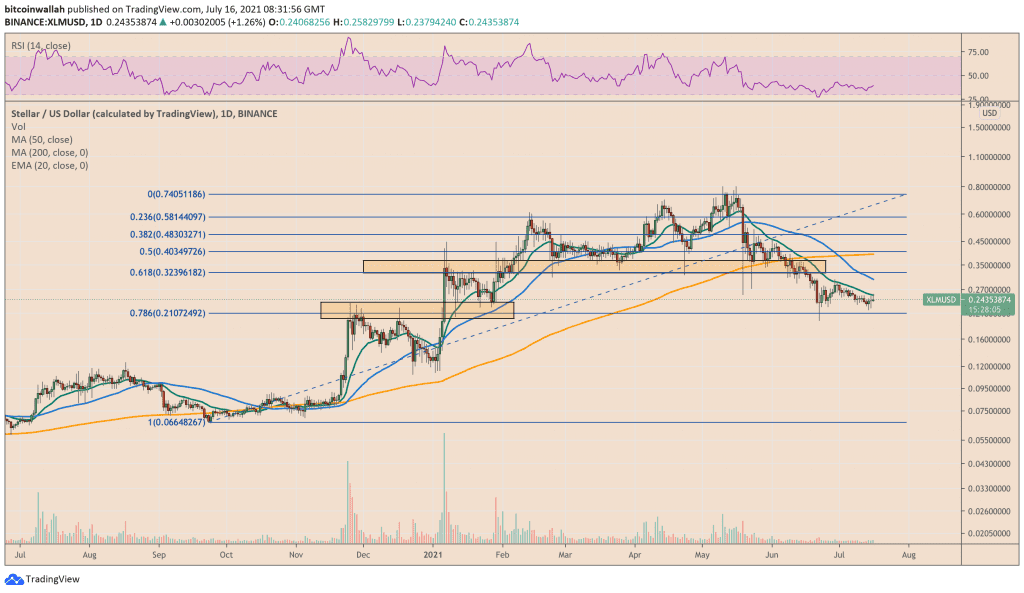
JAIPUR (Coinchapter.com) – Recurring selloffs have pushed down Stellar (XLM) prices to nearly $0.24. The level has acted as crucial support. Meanwhile, XLM has been trading within a descending channel pattern ever since prices dropped by 63% from an all-time high near $0.8 to $0.3 in the event of May 19’s market crash.
The latest restest of yearly support happened in the light of bears limiting XLM’s recovery post-June 22. After testing the lower bound of the channel at $0.235, the crypto asset posted a near 20% rally to $0.29. But owing to the death cross set up on July 1, sellers played spoilsport with the asset’s prevailing bullish momentum.
Also Read: Stellar sinks as native token XLM drops 9%—more losses ahead?
The XLM/USD rate broke out from the upper bound of the descending channel on July 11. But even after the breakout, bearish forces have remained firm.
4-Hour XLM Chart And Bollinger Magic
The 4-hour XLMUSD chart shows another round of selloff dragging prices from $0.25 to $0.219 (near the 78.6% Fibonacci retracement level on the daily chart).
However, bulls took control of the situation in the early hours of the London trading session on July 14. Since then, Stellar’s native cryptocurrency has printed higher highs rising to $0.26 at the London opening bell today.
The price action is still limited near the yearly support, and sellers have gathered again. But the momentum is now following the classic Bollinger Band squeeze. Breakouts always follow Bolinger squeezes. An earlier scenario this year in January propelled XLM prices higher in an almost 62% rally from the same yearly support at $0.23 to $0.6.
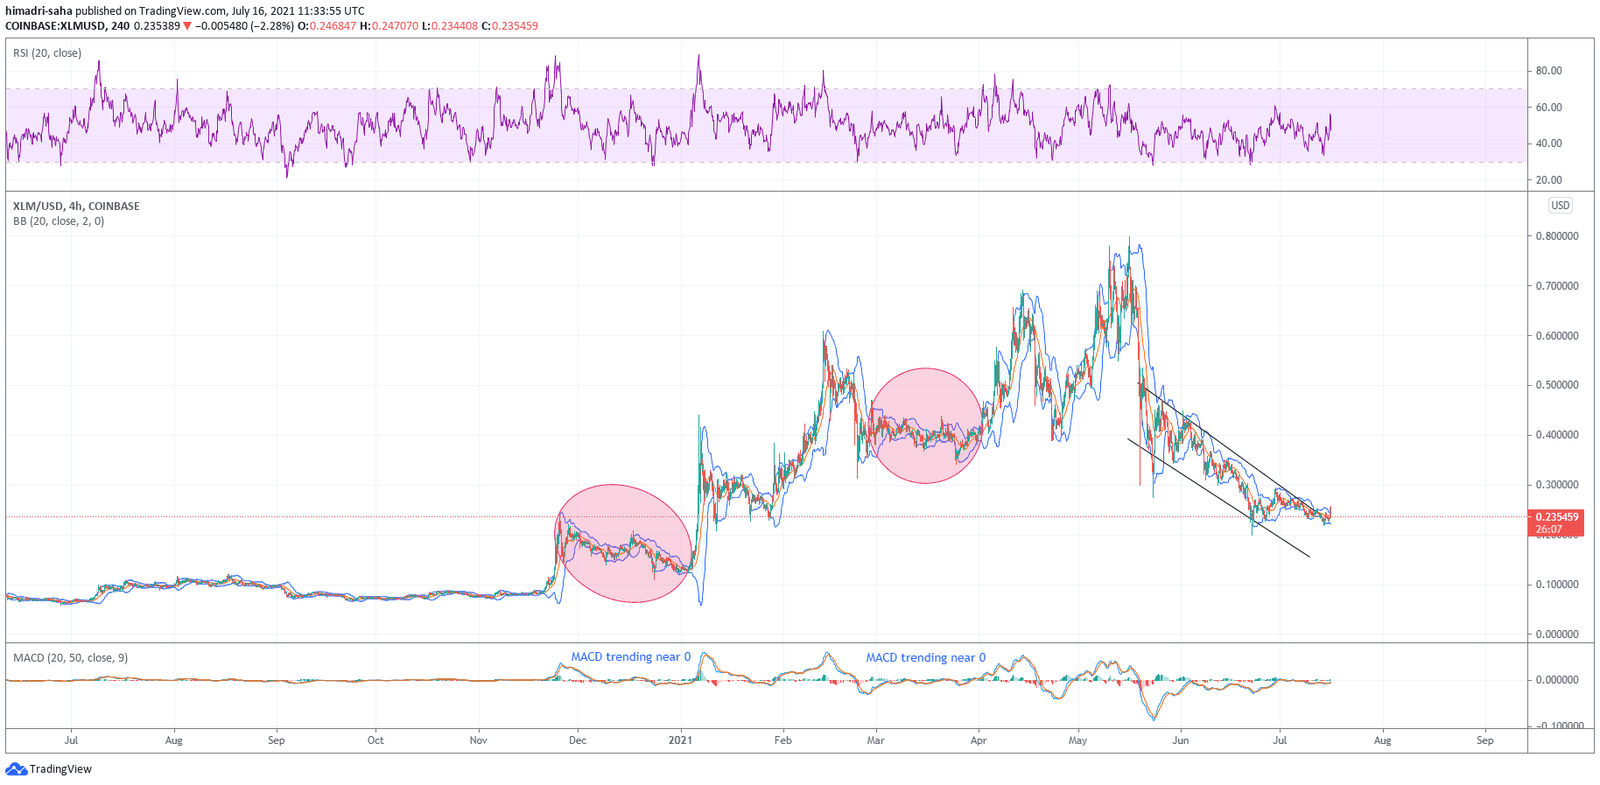
And not just January, a Bollinger squeeze scenario towards March-end led to XLMUSD spot rates rocketing (by 51%) to yearly highs around $0.7. In both breakout setups, the MACD (Moving Average Convergence Divergence Indicator) values were trending near 0, similar to the current situation.
An upward trending RSI (Relative Strength Indicator) wave further confirms the bullish bias. Thus, in the event of a positive breakout (similar to previous instances), a 26% rally from current levels to the 61.8% Fibonacci extension level ($0.323 price) is imminent. Furthermore, if the bullish action continues, a 40% price spike to $0.4 (50% Fibonacci extension) and a 50% upside to $0.483 (38.2% Fibonacci extension) is quite possible as well.
Also Read: Stellar Eyes Strong Rebound This Weekend as XLM Tests Dependable Support Range
Futures traders looking to place long trades on XLM will find themselves in a comfortable position.

… [Trackback]
[…] There you will find 61618 additional Info on that Topic: coinchapter.com/stellar-xlm-down-to-yearly-support/ […]
… [Trackback]
[…] Here you will find 15277 additional Info on that Topic: coinchapter.com/stellar-xlm-down-to-yearly-support/ […]
… [Trackback]
[…] There you can find 92079 additional Info to that Topic: coinchapter.com/stellar-xlm-down-to-yearly-support/ […]
… [Trackback]
[…] Find More here to that Topic: coinchapter.com/stellar-xlm-down-to-yearly-support/ […]