
Key Takeaways:
- Chainlink and Solana tokens rallied more than other top 20 coins.
- MATIC technicals point to another 90% uptrend, which is not likely without a ‘Bitcoin backup.’
- BTC and ADA broke the above key resistances.

YEREVAN (CoinChapter.com) – The crypto market rally started on Oct 19, spurred by the possible approval of BlackRock’s Bitcoin spot ETF. Here are the biggest ETF buzz gainers in the previous 7 days among the top 20 cryptos: Chainlink (LINK), Solana (SOL), Polygon (MATIC), Bitcoin (BTC), and Cardano (ADA).
#1 Chainlink (LINK) led the gainers at over 35%
Chainlink’s token dropped 11% to just below $10 on Oct 24. But despite the intraday loss LINK still emerged as the biggest gainer in the top 20 bunch at 35%. As CoinChapter reported previously, the coin broke out of a consolidation channel, relevant since May 2022.

The chart above also demonstrates that the token’s relative strength index (RSI) charted at approximately 75, which could indicate a profitable market exit point for traders. Thus, the price could correct further in the coming sessions, a previous resistance of $9.45 being the likely target. However, if Bitcoin rallies further, LINK could follow the lead with another leg up after hitting the said line.
#2 Solana (SOL) out of a rising triangle
Solana (SOL) corrected 6% south to $30.7 on Oct 24, after a near-40% rally since Oct 19. After the correction, Solana’s week-over-week gains amounted to 28%.
Notably, the token broke out of a formation known as the “rising triangle.” The latter featured a flat resistance bar and a rising support line that prevented sharp moves in either direction. Generally, the rising triangle is a bearish reversal formation. However, SOL broke to the upside.
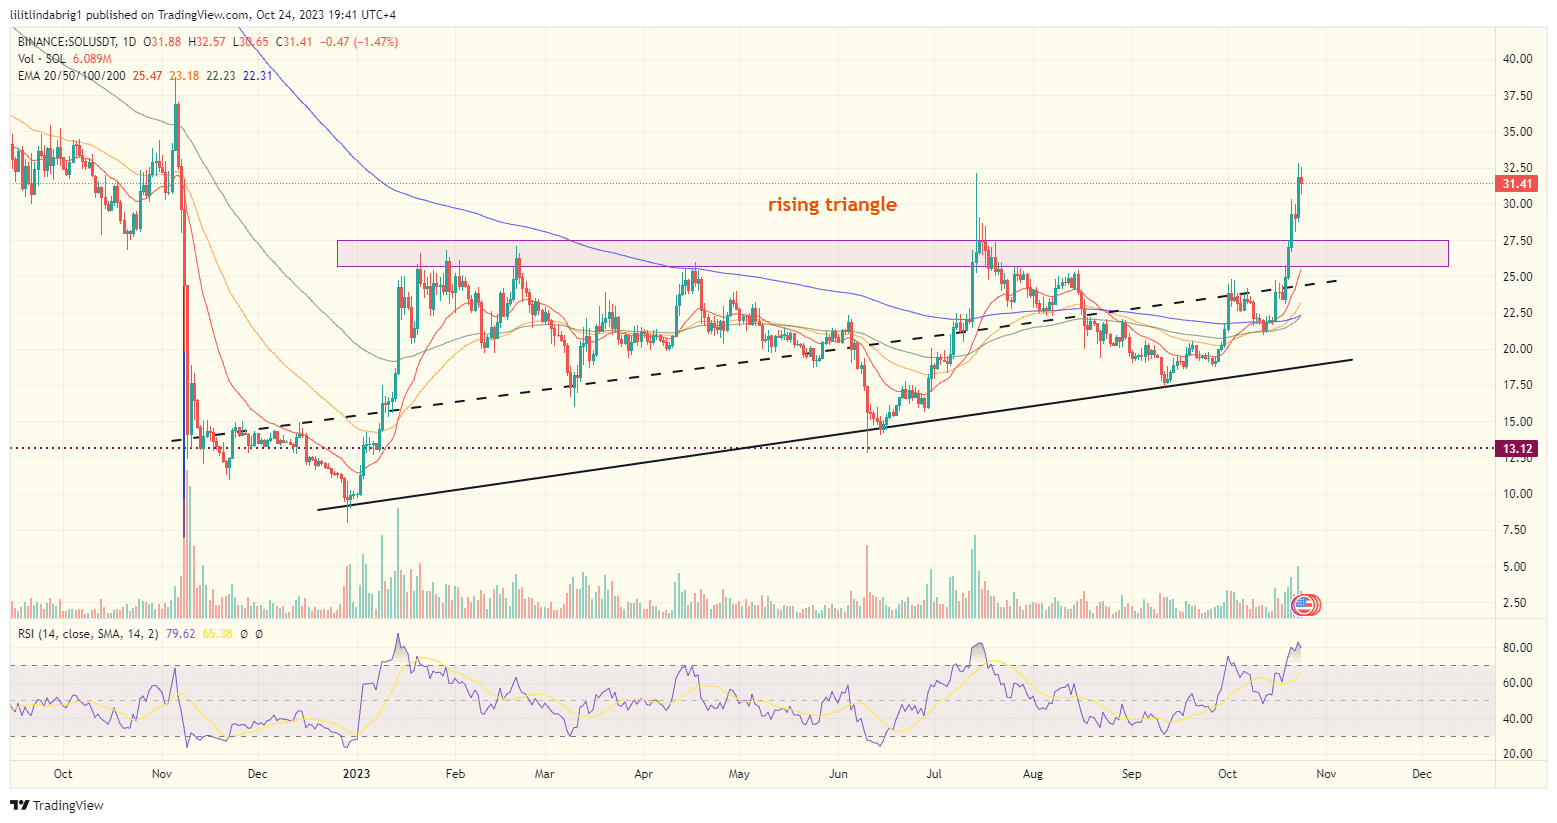
As of Oct 24, the likely short-term prediction for SOL sees the token at the previous support/resistance of $30. However, much like LINK, the Solana coin could jump more following Bitcoin’s lead.
#3 Polygon (MATIC) technicals point to a 90% rally
Polygon token MATIC rallied 20% in the previous 7 days. Similar to SOL and LINK, MATIC corrected 6% to $0.62 on Oct 24. Moreover, the coin broke out of a setup named the “falling wedge.” The latter features two converging trendlines that gradually reduce the asset price.

However, the wedge is a reversal setup that predicts a rally equal to the formation height, which pins the MATIC target price at $1.21, or 92% higher than the current value.
While the markets are euphoric about the possible Bitcoin spot ETF approval, Bitcoin’s rally might still fizzle out in the coming sessions.
If it does, MATIC is unlikely to pull off a solo rally of that magnitude, given its market cap of nearly $5.8 billion.
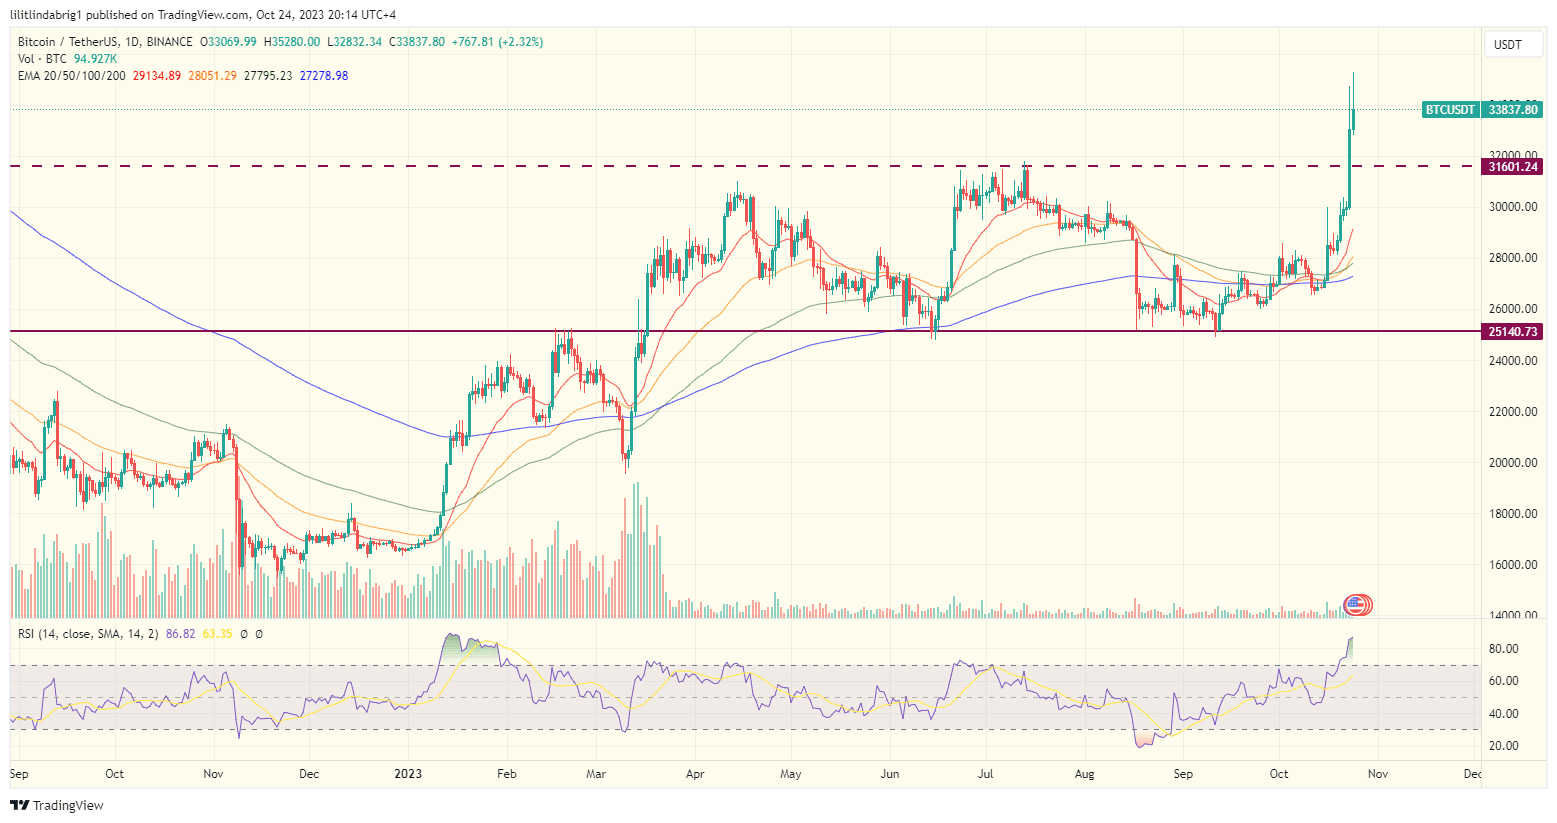
#4 Bitcoin ‘man-of-the-hour’ BTC at $34K
Bitcoin (BTC) broke above the psychological resistance of the $30,000-31,000 bar and reached $34,000 on Oct 24. The alpha crypto corrected south in the New York hours, but, unlike other entries on the list, maintained an intraday gain of nearly 10%.
The surge marked BTC’s highest price point in seventeen months, as the crypto gained 18% in the previous 7 days.
#5 Cardano (ADA) recoils from the 200-day EMA
Similar to SOL, LINK, and MATIC, Cardano’s ADA coin corrected 5% to $0.27 on Oct 24, reaching a 12% gain in 7 days. After the Bitcoin copycat rally, the token broke out of a “descending triangle” setup. It features a flat support line and a down-trending resistance that capped ADA’s upside attempts.
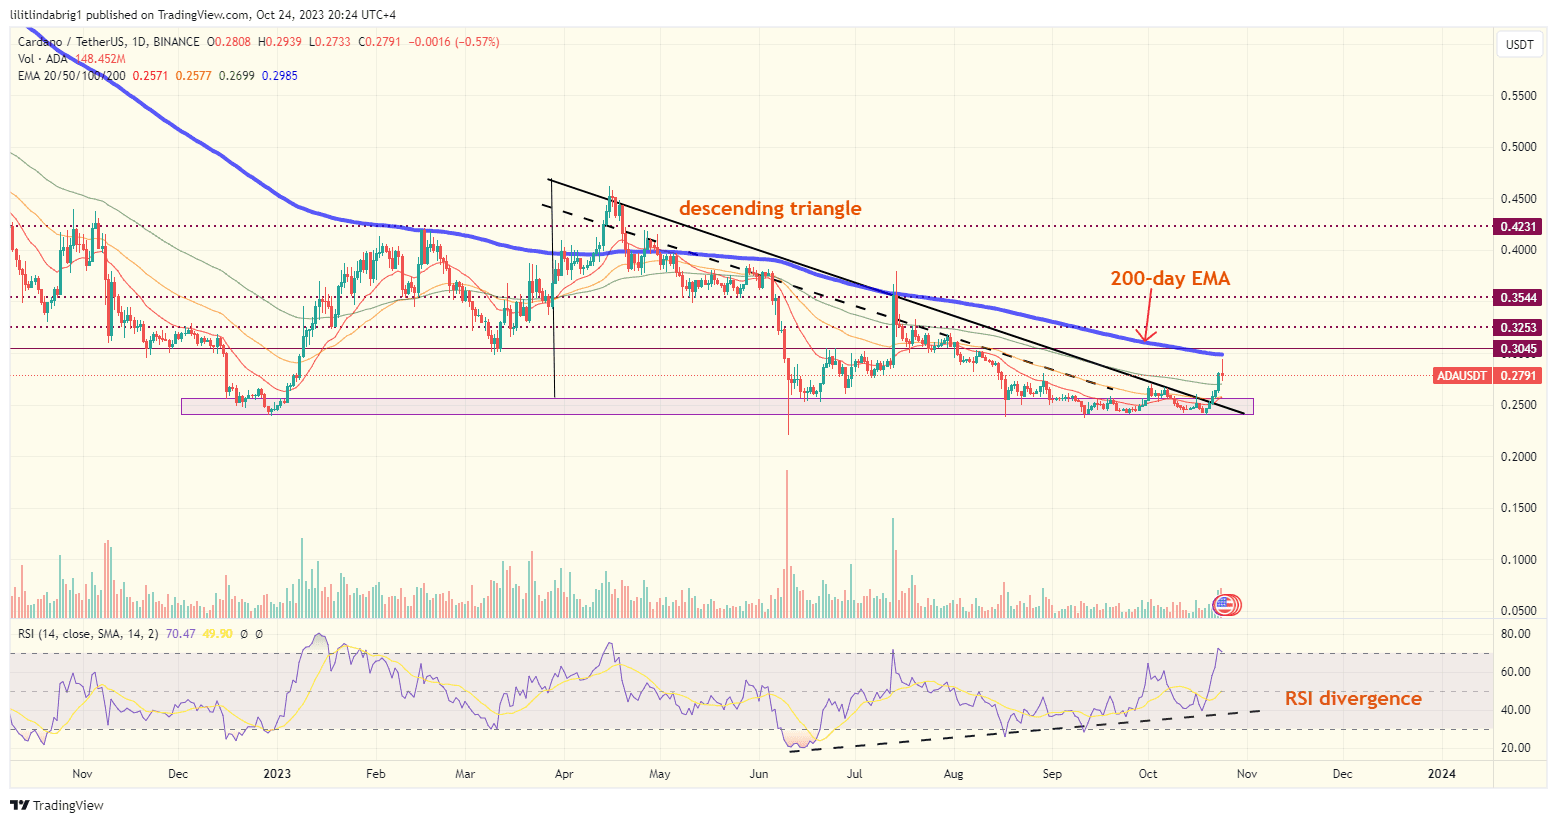
However, the coin retested its 200-day exponential moving average (200-day EMA; blue wave) as resistance once more. Notably, ADA traded below the said wave since November 2021.

На данном сайте можно ознакомиться с информацией о телешоу “Однажды в сказке”, его сюжете и ключевых персонажах. https://odnazhdy-v-skazke-online.ru/ Здесь размещены подробные материалы о создании шоу, исполнителях ролей и фактах из-за кулис.
На данном сайте вы найдёте подробную информацию о препарате Ципралекс. Вы узнаете здесь информация о показаниях, режиме приёма и возможных побочных эффектах.
http://NaglaSamraIndia.jocc.xyz/category/website/wgI2vZFhZf5rbhFqBTP7G0CD1
Центр ментального здоровья — это место, где каждый может найти поддержку и квалифицированную консультацию.
Специалисты работают с разными запросами, включая стресс, усталость и депрессивные состояния.
http://ei2ok.com/__media__/js/netsoltrademark.php?d=empathycenter.ru%2Farticles%2Fkinofobiya-boyazn-sobak%2F
В центре применяются современные методы лечения, направленные на улучшение эмоционального баланса.
Здесь создана безопасная атмосфера для доверительного диалога. Цель центра — помочь каждого клиента на пути к душевному равновесию.
На этом ресурсе вы найдете центр психологического здоровья, которая предлагает поддержку для людей, страдающих от стресса и других ментальных расстройств. Эта эффективные методы для восстановления психического здоровья. Наши опытные психологи готовы помочь вам справиться с проблемы и вернуться к гармонии. Профессионализм наших психологов подтверждена множеством положительных рекомендаций. Обратитесь с нами уже сегодня, чтобы начать путь к лучшей жизни.
http://jamison-bryant.com/__media__/js/netsoltrademark.php?d=empathycenter.ru%2Farticles%2Fgemofobiya-boyazn-vida-krovi%2F
На этом ресурсе вы найдете центр психологического здоровья, которая предоставляет поддержку для людей, страдающих от стресса и других психологических расстройств. Наша индивидуальный подход для восстановления психического здоровья. Наши специалисты готовы помочь вам справиться с проблемы и вернуться к психологическому благополучию. Опыт наших специалистов подтверждена множеством положительных рекомендаций. Свяжитесь с нами уже сегодня, чтобы начать путь к оздоровлению.
http://lehomes.net/__media__/js/netsoltrademark.php?d=empathycenter.ru%2Farticles%2Fgemofobiya-boyazn-vida-krovi%2F
Здесь вы найдете центр психологического здоровья, которая предоставляет поддержку для людей, страдающих от стресса и других психических расстройств. Эта эффективные методы для восстановления психического здоровья. Врачи нашего центра готовы помочь вам справиться с трудности и вернуться к психологическому благополучию. Квалификация наших врачей подтверждена множеством положительных отзывов. Свяжитесь с нами уже сегодня, чтобы начать путь к лучшей жизни.
http://lifetimelasikplus.com/__media__/js/netsoltrademark.php?d=empathycenter.ru%2Fpreparations%2Fo%2Folanzapin%2F
Game Athlon is a renowned online casino offering thrilling casino experiences for users of all levels.
The casino provides a extensive collection of slot games, live dealer games, card games, and betting options.
Players are offered smooth navigation, stunning animations, and easy-to-use interfaces on both PC and mobile devices.
gameathlon online casino
GameAthlon focuses on safe gaming by offering encrypted transactions and transparent game results.
Bonuses and VIP perks are constantly improved, giving registered users extra incentives to win and enjoy the game.
The support service is on hand around the clock, helping with any inquiries quickly and politely.
GameAthlon is the perfect place for those looking for fun and huge prizes in one reputable space.
Our store provides a comprehensive collection of high-quality healthcare solutions for different conditions.
Our online pharmacy guarantees speedy and secure shipping right to your door.
All products comes from licensed manufacturers so you get safety and quality.
Feel free to browse our online store and get your medicines with just a few clicks.
Got any concerns? Customer service is ready to assist you 24/7.
Prioritize your well-being with affordable online pharmacy!
https://bresdel.com/blogs/817900/Cialis-Black-Your-Partner-in-Overcoming-Sexual-Challenges
Purchasing medications from e-pharmacies can be far simpler than shopping in person.
There’s no reason to deal with crowds or worry about limited availability.
E-pharmacies let you order prescription drugs from home.
A lot of digital pharmacies have special deals compared to traditional drugstores.
http://old.pokvesti.ru/forum/viewtopic.php?f=42&t=433187&p=1218397#p1218397
Plus, it’s easy to browse different brands quickly.
Reliable shipping means you get what you need fast.
Have you tried buying medicine online?
Фанаты слотов всегда могут найти зеркальное альтернативный адрес онлайн-казино Champion чтобы без проблем запустить любым игровым ассортиментом.
На сайте можно найти различные слоты, от ретро-автоматов до современных, и последние автоматы от мировых брендов.
Когда основной портал не работает, зеркало казино Чемпион даст возможность моментально получить доступ и наслаждаться любимыми слотами.
казино чемпион зеркало
Все возможности остаются доступными, включая открытие профиля, депозиты и вывод выигрышей, а также бонусы.
Используйте обновленную ссылку, и наслаждаться игрой без блокировок!
BlackSprut – платформа с особыми возможностями
Сервис BlackSprut привлекает интерес широкой аудитории. Почему о нем говорят?
Эта площадка предлагает широкие возможности для аудитории. Оформление системы выделяется удобством, что делает его доступной даже для новичков.
Стоит учитывать, что BlackSprut имеет свои особенности, которые формируют его имидж в определенной среде.
Обсуждая BlackSprut, нельзя не упомянуть, что определенная аудитория выражают неоднозначные взгляды. Некоторые отмечают его удобство, а кто-то относятся к нему более критично.
Таким образом, BlackSprut остается предметом обсуждений и вызывает внимание разных слоев интернет-сообщества.
Ищете актуальное ссылку БлэкСпрут?
Хотите найти актуальное ссылку на BlackSprut? Это можно сделать здесь.
bs2best at
Иногда платформа перемещается, поэтому приходится искать актуальное зеркало.
Мы мониторим за изменениями и готовы предоставить актуальным линком.
Посмотрите актуальную ссылку у нас!
Nanomedicine targets diseases microscopically. The iMedix Medical podcast explores this frontier technology. Researchers explain cancer-fighting “smart particles”. The extremely small could make enormous differences—learn how with iMedix health care!
На нашем портале вам предоставляется возможность испытать широким ассортиментом слотов.
Слоты обладают живой визуализацией и увлекательным игровым процессом.
Каждый слот предлагает особые бонусные возможности, улучшающие шансы на успех.
1xbet казино официальный сайт
Игра в слоты подходит любителей азартных игр всех мастей.
Есть возможность воспользоваться демо-режимом, после чего начать играть на реальные деньги.
Попробуйте свои силы и окунитесь в захватывающий мир слотов.
На нашем портале вам предоставляется возможность играть в большим выбором игровых слотов.
Слоты обладают яркой графикой и интерактивным игровым процессом.
Каждая игра даёт уникальные бонусные раунды, увеличивающие шансы на выигрыш.
1win
Игра в игровые автоматы предназначена как новичков, так и опытных игроков.
Можно опробовать игру без ставки, после чего начать играть на реальные деньги.
Испытайте удачу и насладитесь неповторимой атмосферой игровых автоматов.
На данной платформе вы сможете найти интересные слоты казино в казино Champion.
Выбор игр представляет проверенные временем слоты и современные слоты с яркой графикой и уникальными бонусами.
Любая игра оптимизирован для комфортного использования как на ПК, так и на мобильных устройствах.
Независимо от опыта, здесь вы найдёте подходящий вариант.
champion зеркало
Автоматы доступны без ограничений и работают прямо в браузере.
Кроме того, сайт предоставляет бонусы и обзоры игр, чтобы сделать игру ещё интереснее.
Попробуйте прямо сейчас и оцените преимущества с брендом Champion!
На этом сайте можно найти игровые автоматы от казино Vavada.
Каждый пользователь найдёт слот на свой вкус — от классических аппаратов до видеослотов слотов с бонусными раундами.
Платформа Vavada открывает возможность сыграть в популярных игр, включая игры с джекпотом.
Любой автомат доступен без ограничений и подходит как для ПК, так и для телефонов.
вавада бонусы на сегодня
Каждый геймер ощутит настоящим драйвом, не выходя из квартиры.
Навигация по сайту понятна, что позволяет без труда начать играть.
Присоединяйтесь сейчас, чтобы открыть для себя любимые слоты!
On this platform, you can access lots of online slots from top providers.
Players can enjoy traditional machines as well as modern video slots with vivid animation and bonus rounds.
If you’re just starting out or a casino enthusiast, there’s something for everyone.
casino games
Each title are ready to play 24/7 and designed for PCs and tablets alike.
All games run in your browser, so you can start playing instantly.
The interface is easy to use, making it simple to browse the collection.
Sign up today, and enjoy the excitement of spinning reels!
Данный ресурс — сайт независимого сыскного бюро.
Мы оказываем помощь по частным расследованиям.
Штат профессионалов работает с абсолютной этичностью.
Мы занимаемся поиски людей и детальное изучение обстоятельств.
Детективное агентство
Любой запрос подходит с особым вниманием.
Задействуем эффективные инструменты и ориентируемся на правовые стандарты.
Ищете достоверную информацию — вы нашли нужный сайт.
Our platform offers a diverse range of home clock designs for all styles.
You can discover modern and timeless styles to enhance your apartment.
Each piece is curated for its design quality and durability.
Whether you’re decorating a stylish living room, there’s always a beautiful clock waiting for you.
best la crosse technology wireless weather station heat index dew point
The shop is regularly expanded with fresh designs.
We prioritize customer satisfaction, so your order is always in good care.
Start your journey to perfect timing with just a few clicks.
Лето 2025 года обещает быть непредсказуемым и нестандартным в плане моды.
В тренде будут свободные силуэты и яркие акценты.
Актуальные тона включают в себя неоновые оттенки, подчеркивающие индивидуальность.
Особое внимание дизайнеры уделяют аксессуарам, среди которых популярны макросумки.
https://www.saablink.net/members/lepodium.114382/
Набирают популярность элементы нулевых, интерпретированные по-новому.
На улицах мегаполисов уже можно увидеть модные эксперименты, которые удивляют.
Не упустите шанс, чтобы создать свой образ.
Mechanical watches will consistently be timeless.
They reflect tradition and provide a level of detail that digital devices simply cannot match.
Every model is powered by precision mechanics, making it both useful and elegant.
Timepiece lovers appreciate the craft behind them.
https://www.tumblr.com/sneakerizer/778880557374423040/horological-alchemy-best-luxury-watches-with
Wearing a mechanical watch is not just about telling time, but about celebrating tradition.
Their designs are iconic, often passed from generation to generation.
All in all, mechanical watches will stand the test of time.
1XBet Promo Code – Exclusive Bonus as much as 130 Euros
Use the 1xBet bonus code: 1XBRO200 during sign-up via the application to unlock the benefits provided by 1XBet for a 130 Euros as much as a full hundred percent, for wagering and a €1950 with free spin package. Open the app and proceed by completing the registration process.
The One X Bet promotional code: 1XBRO200 offers a great sign-up bonus for new users — a complete hundred percent maximum of 130 Euros once you register. Promo codes are the key to obtaining extra benefits, also 1xBet’s promo codes are the same. After entering this code, users can take advantage of several promotions in various phases of their betting experience. Though you don’t qualify for the welcome bonus, 1xBet India ensures its loyal users receive gifts via ongoing deals. Visit the Offers page via their platform often to stay updated on the latest offers designed for current users.
1xbet promo code egypt
What 1xBet promo code is presently available today?
The promo code relevant to 1XBet stands as Code 1XBRO200, permitting novice players joining the betting service to unlock a bonus of €130. For gaining special rewards related to games and bet placement, make sure to type this special code concerning 1XBET while filling out the form. To make use from this deal, future players must input the bonus code 1XBET at the time of registering procedure so they can obtain a 100% bonus applied to the opening contribution.
Модные тенденции нового времени сегодня начинают формироваться.
На первом месте — природность, видно дышащих текстурах и простых силуэтах.
Большой интерес получают модели с глубокими вырезами, которые добавляют изящество.
http://support-groups.org/viewtopic.php?f=161&t=799965
Гамма оттенков расширяется, добавляя тонкие полутона, как например: персик.
Детализация играет ключевую роль, в частности кружева искусные элементы.
Интересным дополнением выступают гибридные модели, как вариант: многослойные решения.
On this site, explore a wide range internet-based casino sites.
Whether you’re looking for well-known titles new slot machines, there’s something to suit all preferences.
The listed platforms fully reviewed to ensure security, so you can play securely.
play slots
Additionally, the site unique promotions along with offers to welcome beginners including long-term users.
Due to simple access, discovering a suitable site happens in no time, making it convenient.
Stay updated regarding new entries through regular check-ins, as fresh options appear consistently.
This flight-themed slot combines adventure with exciting rewards.
Jump into the cockpit and try your luck through aerial challenges for huge multipliers.
With its vintage-inspired graphics, the game captures the spirit of pioneering pilots.
https://www.linkedin.com/posts/robin-kh-150138202_aviator-game-download-activity-7295792143506321408-81HD/
Watch as the plane takes off – cash out before it vanishes to grab your winnings.
Featuring instant gameplay and dynamic background music, it’s a top choice for gambling fans.
Whether you’re looking for fun, Aviator delivers endless thrills with every flight.
На данном сайте можно получить сервис “Глаз Бога”, позволяющий проверить данные о гражданине из открытых источников.
Инструмент работает по номеру телефона, обрабатывая публичные материалы онлайн. С его помощью можно получить 5 бесплатных проверок и детальный анализ по имени.
Инструмент проверен согласно последним данным и поддерживает мультимедийные данные. Глаз Бога гарантирует найти профили в открытых базах и предоставит результаты в режиме реального времени.
глаз бога по номеру телефона
Такой инструмент — помощник в анализе персон онлайн.
… [Trackback]
[…] Find More Info here to that Topic: coinchapter.com/top-5-performing-altcoins-amid-bitcoin-etf-buzz/ […]
Vertinu pastangas, kurias įdėjai.